![\begin{figure}
\par\includegraphics[width=16.5cm,keepaspectratio]{9901fig1.eps}
\end{figure}](/articles/aa/full/2008/41/aa09901-08/Timg34.gif) |
Figure 1:
Polarimetric images of CRL 2136. The top panels are the obtained
intensity (Stokes I) images in the H ( left) and K ( right)
bands with the polarization vector lines. The field of view is
|
| Open with DEXTER | |
In the text
 |
Figure 2: Cartoon of CRL 2136 illustrating the features detected in our data, the direction of the CO outflow, as well as our interpretation of a disk and envelope structure. The polarization disk on the northeastern side of IRS 1 is not visible in our data. |
| Open with DEXTER | |
In the text
 |
Figure 3:
The degree of polarization dependence on the grain size
(
|
| Open with DEXTER | |
In the text
 |
Figure 4:
Comparison of the normalized optical depths of 3 |
| Open with DEXTER | |
In the text
 |
Figure 5:
Cross sections of extinction (solid line), scattering (dashed line),
and absorption (dotted line) of the modeled grains as a function of
wavelength. Black, red, and blue lines denote the bare grains
(
|
| Open with DEXTER | |
In the text
 |
Figure 6:
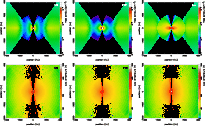
Mass density distribution ( top panels) and dust temperature
distribution ( bottom panels). The results of three potential disk
models of the SH, TO, and LA are shown in the left, middle, and
right columns, respectively. The dust temperature distribution
maps are generated with the standard full interacting mode and
|
| Open with DEXTER | |
In the text
 |
Figure 7:
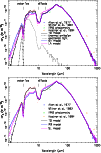
Comparisons of SEDs of the acceptable, SH, TO, and LA disk models
( top panel) and the rejected, RB and SL disk models
( bottom panel)
with observations. The results of these three disk models are
indicated with violet, black, and blue curves, respectively.
For the TO disk model, fluxes due to the thermal emission and dust
scattering are also shown with a dotted-dashed line and dotted line,
respectively. The attenuated stellar flux is not presented because
it is less than 10-14 Wm-2. The observed data is obtained
from Allen et al. (1977) for the JHK band photometry, Willner et al. (1982)
for the spectrum from 2.0 |
| Open with DEXTER | |
In the text
 |
Figure 8:
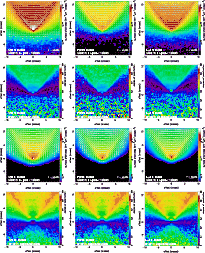
Our model results for the intensity images, polarization vector
lines, and the degree of polarization images.
The top two rows
represent the H band and the bottom two rows the K-band.
The left, middle, and right columns are results of the SH, TO, and
LA disk models, respectively. In these calculations, the scattering
mode with the peeling-off technique and
|
| Open with DEXTER | |
In the text