A&A 490, 61-76 (2008)
DOI: 10.1051/0004-6361:200809545
Molecular gas in NUclei of GAlaxies (NUGA)
X. The Seyfert 2 galaxy NGC 3147
V. Casasola1,2,4 - F. Combes2 - S. García-Burillo3 - L. K. Hunt4 - S. Léon5 - A. J. Baker6
1 - Dipartimento di Astronomia, Università di Padova, Vicolo dell'Osservatorio 2, 35122 Padova, Italy
2 - Observatoire de Paris, LERMA, 61 Av. de l'Observatoire, 75014 Paris, France
3 - Observatorio Astronómico Nacional (OAN), Alfonso XII 3, 28014 Madrid, Spain
4 - Istituto di Radioastronomia/INAF, Largo Enrico Fermi 5, 50125 Firenze, Italy
5 - Instituto de Astrofísica de Andalucía (CSIC), Camino Bajo de Huétor 24, 18008 Granada, Spain
6 - Dept. of Physics and Astronomy, Rutgers, the State Univ. of New Jersey, 136 Frelinghuysen Road, Piscataway, NJ 08854, USA
Received 8 February 2008 / Accepted 30 July 2008
Abstract
We present 12CO(1-0) and 12CO(2-1) observations of the SA(rs)bc Seyfert 2 galaxy NGC 3147, obtained with the IRAM interferometer at 1
 9
9  1
6 and
1
6
1
4 resolutions, respectively. We have also observed the central region of
NGC 3147 with the IRAM 30 m telescope (at resolutions of 22
1
6 and
1
6
1
4 resolutions, respectively. We have also observed the central region of
NGC 3147 with the IRAM 30 m telescope (at resolutions of 22
 and 12
for 12CO(1-0) and 12CO(2-1), respectively), in order to
obtain complete sampling at low spatial frequencies. These observations have
been made in the context of the NUclei of GAlaxies (NUGA) project, aimed at
the study of the different mechanisms for gas fueling of active galactic
nuclei (AGN). A central peak seen mainly in 12CO(2-1) and a ring-like structure
at
and 12
for 12CO(1-0) and 12CO(2-1), respectively), in order to
obtain complete sampling at low spatial frequencies. These observations have
been made in the context of the NUclei of GAlaxies (NUGA) project, aimed at
the study of the different mechanisms for gas fueling of active galactic
nuclei (AGN). A central peak seen mainly in 12CO(2-1) and a ring-like structure
at

 2 kpc dominate the 12CO maps.
In 12CO(1-0) an outer spiral at
2 kpc dominate the 12CO maps.
In 12CO(1-0) an outer spiral at
 kpc
is also detected, not visible in 12CO(2-1) emission because it
falls outside the field-of-view of the primary beam.
The average
I21/I10 line ratio
is 0.7 in temperature units over the region mapped in both lines,
consistent with the optically thick emission expected in the nuclei of spiral
galaxies. The kinematics of the molecular structures are quite regular, although there
is evidence for local non-circular or streaming motions.
We show that the molecular gas distribution is similar
but not exactly identical to those of star formation tracers, i.e., infrared
(Spitzer) and ultraviolet (GALEX) emission. This agreement is
consistent with a scenario of steady, ongoing formation of stars from the
molecular clouds at a rate of
kpc
is also detected, not visible in 12CO(2-1) emission because it
falls outside the field-of-view of the primary beam.
The average
I21/I10 line ratio
is 0.7 in temperature units over the region mapped in both lines,
consistent with the optically thick emission expected in the nuclei of spiral
galaxies. The kinematics of the molecular structures are quite regular, although there
is evidence for local non-circular or streaming motions.
We show that the molecular gas distribution is similar
but not exactly identical to those of star formation tracers, i.e., infrared
(Spitzer) and ultraviolet (GALEX) emission. This agreement is
consistent with a scenario of steady, ongoing formation of stars from the
molecular clouds at a rate of
 within the
innermost 4 kpc in radius.
within the
innermost 4 kpc in radius.
Using a near-infrared (NIR) image obtained with adaptive optics at the
Canada-France-Hawaii Telescope (CFHT), we identify a weak bar in NGC 3147,
which is classified as non-barred galaxy in the optical. We then compute the
gravity torques exerted by this stellar bar on the gas. The torque is
obtained first at each point in the map, and then azimuthally averaged with a
weighting determined by the gas surface density traced by the CO emission.
We find that the gas inside the inner CO ring is subject to a net negative
torque and loses angular momentum. This is expected for gas at the
ultra-harmonic resonance (UHR), just inside the corotation resonance of the
stellar bar. In contrast, the gas outside corotation, in the spiral arms
comprising the outer spiral structure, suffers positive torques
and is driven outwards.
We conclude that some molecular gas is presently flowing into the central region,
since we find negative torques down to the resolution limit of our
images.
Key words: galaxies: individual: NGC 3147 - galaxies: spiral - galaxies: active - galaxies: nuclei - galaxies: ISM - galaxies: kinematics and dynamics
The NUclei of GAlaxies (NUGA) project (García-Burillo et al. 2003) is an IRAM Plateau de Bure Interferometer (PdBI) survey of nearby active galaxies to map the distribution and dynamics of molecular gas in the inner 1 kpc at high spatial resolution (
 ,
corresponding to
,
corresponding to
 ), and to study the mechanisms for gas fueling of low-luminosity active galactic nuclei (AGNs).
Most galaxies possess central supermassive black holes (SMBHs), and gas accretion onto these black holes is the phenomenon usually invoked to explain nuclear activity in galaxies. However, even if most galaxies host black holes, the existence of nuclear activity is far from universal. It is not
clear whether the main limiting factor is the global gas mass available for fueling the AGN or the mechanisms for efficiently removing the angular momentum of the gas.
The main and non-trivial problem linked to the fueling of AGN is the removal of angular momentum from the disk gas (e.g., Jogee 2006, and references therein), a process which can be accomplished through non-asymmetric perturbations. These can be perturbations of external origin, such as galaxy collisions, mergers, and mass accretion (Heckman et al. 1986), or of internal origin due to density waves, such as spirals or bars, and their gravity torques (e.g. Sakamoto et al. 1999; Combes 2001). In addition to primary bars, fueling processes can be associated with more localized phenomena, such as nested nuclear bars (e.g. Friedli & Martinet 1993), lopsidedness or m = 1 perturbations (e.g. García-Burillo et al. 2000; Shu et al. 1990), or warped nuclear disks (e.g. Schinnerer et al. 2000a,b).
Since molecular gas is the predominant phase of the interstellar medium (ISM)
in the inner kiloparsec of spiral galaxies, the study of its morphology and
dynamics represents an optimal possibility for investigating AGN fueling
mechanisms and their link with circumnuclear star formation. In order to
do this, high-resolution maps of molecular gas are needed. Previous
CO single dish (Heckman et al. 1989; Casoli et al. 1996; Vila-Vilaró et al. 1998; Braine et al. 1993; Young et al. 1995)
and interferometric (Regan et al. 2001; Sakamoto et al. 1999; Helfer et al. 2003) surveys have mapped
the gas in galaxies with relatively low spatial resolution (
 ). Moreover, the majority of these surveys only included
small numbers of AGN in their samples. This paper, dedicated to the galaxy
NGC 3147, is the tenth of a series where results obtained for the galaxies
in the NUGA sample are described on a case-by-case basis.
). Moreover, the majority of these surveys only included
small numbers of AGN in their samples. This paper, dedicated to the galaxy
NGC 3147, is the tenth of a series where results obtained for the galaxies
in the NUGA sample are described on a case-by-case basis.
Table 1:
Fundamental parameters for NGC 3147.
NGC 3147 (
 ,
,
 ,
,
 )
is an isolated (Bettoni et al. 2003) Seyfert 2 galaxy (Ho et al. 1997) of Hubble
morphological type SA(rs)bc. Both ROSAT (Roberts & Warwick 2000) and
Chandra (Terashima & Wilson 2003) observations have shown that this galaxy
possesses a pointlike nuclear X-ray source,
which is presumed to be the location of the
AGN. The 0.3-10 keV Chandra image reveals a
bright, compact source surrounded by very faint, soft, and diffuse emission. The
2-10 keV core is clearly detected and confined to a region of
)
is an isolated (Bettoni et al. 2003) Seyfert 2 galaxy (Ho et al. 1997) of Hubble
morphological type SA(rs)bc. Both ROSAT (Roberts & Warwick 2000) and
Chandra (Terashima & Wilson 2003) observations have shown that this galaxy
possesses a pointlike nuclear X-ray source,
which is presumed to be the location of the
AGN. The 0.3-10 keV Chandra image reveals a
bright, compact source surrounded by very faint, soft, and diffuse emission. The
2-10 keV core is clearly detected and confined to a region of
 in radius.
Interferometric observations of the continuum emission at cm wavelengths
with MERLIN and the VLBA have also shown a pointlike nonthermal continuum
source at the position of the nucleus of NGC 3147,
coincident with the X-ray source (Krips et al. 2006,2007a; Ulvestad & Ho 2001).
Very recent optical and X-ray observations of the
nuclear region of this galaxy suggest
that NGC 3147 is the first ``true'' Seyfert 2 in the sense that it
intrinsically lacks a broad-line region (Bianchi et al. 2008).
Table 1 reports the fundamental characteristics of
NGC 3147.
in radius.
Interferometric observations of the continuum emission at cm wavelengths
with MERLIN and the VLBA have also shown a pointlike nonthermal continuum
source at the position of the nucleus of NGC 3147,
coincident with the X-ray source (Krips et al. 2006,2007a; Ulvestad & Ho 2001).
Very recent optical and X-ray observations of the
nuclear region of this galaxy suggest
that NGC 3147 is the first ``true'' Seyfert 2 in the sense that it
intrinsically lacks a broad-line region (Bianchi et al. 2008).
Table 1 reports the fundamental characteristics of
NGC 3147.
The structure of this paper is as follows. In Sect. 2, we describe our new
observations of NGC 3147 and the literature data with which we compare them.
In Sects. 3 and 4, we present the observational results, both single dish
and interferometric, describing the principal properties of the molecular gas
including its morphology, its kinematics, and its
excitation. A comparison between the CO observations and those obtained at
other wavelengths is given in Sect. 5. In Sect. 6, we describe the
computation of the gravity torques exerted on the gas by a weak stellar bar
that we have identified using a near-infrared (NIR) image. In Sect. 7, we discuss
our principal observational and theoretical results, which are summarized
in Sect. 8.
![\begin{figure}
\par\includegraphics[width=16cm,angle=-90]{9545fig1.eps} \end{figure}](/articles/aa/full/2008/40/aa09545-08/Timg74.gif) |
Figure 1:
12CO(1-0) velocity channel maps observed with the IRAM PdBI+30 m
in the nucleus of NGC 3147, with a spatial resolution of 1
9
1
6 (HPBW). The center of the maps, given in Table
1, is
 = 10
= 10 16 16 53.6 53.6 , ,
 =
73
=
73 24 24 03
.
Velocity channels range from 03
.
Velocity channels range from
 to
to
 in steps of
 relative to
 .
The contours begin at .
The contours begin at
 ,
their spacing is
,
and their maximum is ,
their spacing is
,
and their maximum is
 . . |
| Open with DEXTER |
![\begin{figure}
\par\includegraphics[width=16.3cm,angle=-90]{9545fig2.eps} \end{figure}](/articles/aa/full/2008/40/aa09545-08/Timg77.gif) |
Figure 2:
Same as Fig. 1 but for the 12CO(2-1) line,
with a spatial resolution of 1
6
1
4.
The velocity range is the same as for Fig. 1.
The contours begin at
 ,
their spacing is
,
and their maximum is ,
their spacing is
,
and their maximum is
 . . |
| Open with DEXTER |
We observed the J = 1-0 and J = 2-1 lines of 12CO in NGC 3147
using the IRAM PdBI in October 2004, with the array deployed in its ABCD
configurations. The six 15 m antennae were equipped with dual-band SIS
receivers yielding SSB receiver temperatures between 40 and 50 K at both
frequencies. The precipitable water vapor ranged from 4 to 10 mm (i.e.,
giving opacities of 0.2-0.3), resulting in system temperatures of
approximately
 on average. The spectral correlators were
centered at 114.197 GHz (
on average. The spectral correlators were
centered at 114.197 GHz (
 )
and 228.390 GHz
(
)
and 228.390 GHz
(
 ), respectively. The coordinates of the PdBI
phase tracking center are given in Table 1 and correspond to the
(6 cm VLBA) nuclear radio position of Nagar et al. (2002).
), respectively. The coordinates of the PdBI
phase tracking center are given in Table 1 and correspond to the
(6 cm VLBA) nuclear radio position of Nagar et al. (2002).
Data cubes with 256
256 pixels (0
46
 for 12CO(1-0) and
0
23
for 12CO(2-1)) were created over a velocity interval of -240 km s-1 to +240 km s-1 in bins of 10 km s-1. The images were reconstructed
using the standard IRAM/GILDAS
for 12CO(1-0) and
0
23
for 12CO(2-1)) were created over a velocity interval of -240 km s-1 to +240 km s-1 in bins of 10 km s-1. The images were reconstructed
using the standard IRAM/GILDAS![[*]](/icons/foot_motif.gif) software (Guilloteau & Lucas 2000) and restored with Gaussian beams of dimensions
1
8
1
6 (PA =
software (Guilloteau & Lucas 2000) and restored with Gaussian beams of dimensions
1
8
1
6 (PA =
 )
at 115 GHz
and 1
4
1
2 (PA =
)
at 115 GHz
and 1
4
1
2 (PA =
 )
at
230 GHz. In the cleaned maps, the rms levels are
)
at
230 GHz. In the cleaned maps, the rms levels are
 and
and
 for the 12CO(1-0) and 12CO(2-1) lines, respectively
(at a velocity resolution of
). The conversion
factors between intensity and brightness temperature are
for the 12CO(1-0) and 12CO(2-1) lines, respectively
(at a velocity resolution of
). The conversion
factors between intensity and brightness temperature are
 at 115 GHz and
 at 230 GHz.
A continuum point source is detected at both 3 mm and 1.3 mm.
The continuum flux density is
 at 3 mm
and
at 3 mm
and
 at 1.3 mm. Both values
are consistent with the synchrotron source detected at centimeter
wavelengths for a power-law spectrum with a slope of -1.
All maps presented in the paper are continuum-subtracted.
at 1.3 mm. Both values
are consistent with the synchrotron source detected at centimeter
wavelengths for a power-law spectrum with a slope of -1.
All maps presented in the paper are continuum-subtracted.
![\begin{figure}
\par\includegraphics[width=8.8cm,angle=0,bb=47 145 590 680]{9545fig3.ps}
\end{figure}](/articles/aa/full/2008/40/aa09545-08/Timg91.gif) |
Figure 3:
Radial brightness profiles are shown in the
top panel, with J given as a
dotted line (blue), and IRAC
 m as a solid
one (red).
Thevertical dashed line corresponds to 200 pc.
The lower panels display the radial runs of ellipticity, m as a solid
one (red).
Thevertical dashed line corresponds to 200 pc.
The lower panels display the radial runs of ellipticity,  ,
position angle ,
position angle  ,
and cos( ,
and cos( )
terms inthe ellipse
fitting residuals. )
terms inthe ellipse
fitting residuals. |
| Open with DEXTER |
2.2 IRAM single dish CO and HCN observations
We performed IRAM 30 m telescope observations in a
 raster pattern with
 spacing in
July 2002 and in June 2004. We used 4 SIS receivers to observe simultaneously
at the frequencies of the 12CO(1-0) (115 GHz), the 12CO(2-1) (230 GHz), and the
HCN(1-0) (89 GHz) lines. The half power beam widths are
spacing in
July 2002 and in June 2004. We used 4 SIS receivers to observe simultaneously
at the frequencies of the 12CO(1-0) (115 GHz), the 12CO(2-1) (230 GHz), and the
HCN(1-0) (89 GHz) lines. The half power beam widths are
 for 12CO(1-0),
 for 12CO(2-1), and
 for HCN(1-0). The typical system temperatures
were
for HCN(1-0). The typical system temperatures
were
 at 115 GHz,
 at
230 GHz, and 120 K at 89 GHz. The line intensity scale throughout
this paper is expressed in units of
at
230 GHz, and 120 K at 89 GHz. The line intensity scale throughout
this paper is expressed in units of
 ,
the beam-averaged radiation
temperature. The value of
is related to
,
the beam-averaged radiation
temperature. The value of
is related to
 ,
the
equivalent antenna temperature (corrected for rear spillover and ohmic
losses) reported above the atmosphere, by
,
the
equivalent antenna temperature (corrected for rear spillover and ohmic
losses) reported above the atmosphere, by
 where
where
 is the telescope main-beam efficiency.
is 0.79 at 115 GHz,
0.57 at 230 GHz, and 0.82 at 89 GHz. All observations were performed in
``wobbler-switching'' mode, with a minimum phase time for spectral line
observations of 2 s and a maximum beam throw of
is the telescope main-beam efficiency.
is 0.79 at 115 GHz,
0.57 at 230 GHz, and 0.82 at 89 GHz. All observations were performed in
``wobbler-switching'' mode, with a minimum phase time for spectral line
observations of 2 s and a maximum beam throw of
 .
The
pointing accuracy was
.
The
pointing accuracy was
 rms.
rms.
Single dish observations were used to compute short-spacings and
complete the interferometric measurements (e.g. Combes et al. 2004). In
particular, short-spacing visibilities are computed from a map built by
interpolation of the 30 m beam and multiplied by the PdBI primary beam.
We combined 30 m and PdBI data, using the SHORT-SPACE task in the GILDAS
software. To find the best compromise between good angular resolution and
complete restoration of the missing extended flux, we varied the weights
attached to the 30 m and PdBI data.
After writing the combined datasets to visibility tables,
converting to maps using standard data reduction procedures,
and deconvolving using the Clark algorithm, we obtained maps with
angular resolutions of 1
88
1
63
at PA 61.5
for the 12CO(1-0) map and
1
61
1
4 at PA 65.4
for
the 12CO(2-1) map.
The weights were adjusted in order to obtain the same mean
weights in the single-dish data as in the interferometric data in the uv range of
 to
to
 (D = 15 m). All figures
presented in this paper are made with short-spacing-corrected data.
(D = 15 m). All figures
presented in this paper are made with short-spacing-corrected data.
Figures 1 and 2 display the channel maps
for the 12CO(1-0) and 12CO(2-1) lines, respectively.
All maps are centered on the position of Table 1, and the
dynamical center coincides with this center, which is also the position
of the AGN (the radio continuum source).
Figures 4 and 5 display the single dish data,
for the 12CO(1-0), 12CO(2-1), and HCN(1-0) lines. The two CO lines have been
mapped on a
grid with
spacings, while
the HCN(1-0) line has been mapped on a
 grid with
spacings and the nine HCN(1-0) spectra have been
averaged to improve the signal-to-noise.
grid with
spacings and the nine HCN(1-0) spectra have been
averaged to improve the signal-to-noise.
To estimate the flux filtered out by the interferometric observations, we have computed the flux measured by Young et al. (1995) with the FCRAO 14 m telescope (HPBW =
 ). They found a 12CO(1-0) intensity towards the center of
 (in the
scale), which corresponds to an integrated flux of
(in the
scale), which corresponds to an integrated flux of
 if we adopt a conversion factor of
 .
In the same region, we measure
.
In the same region, we measure
 in 12CO(1-0) with the PdBI alone, and
 with the IRAM 30 m in a beam of
.
With short-spacings added, we estimate the total flux to be
with the IRAM 30 m in a beam of
.
With short-spacings added, we estimate the total flux to be
 in 12CO(1-0), which is compatible with the FCRAO value within the uncertainties. In 12CO(2-1), the PdBI alone indicates
 with a large region with negative flux levels. With the IRAM 30 m in 12CO(2-1) we measure a total flux of
 in a beam of 12
,
and when short-spacings are included we recover the value of
in a beam of 12
,
and when short-spacings are included we recover the value of
 .
.
The implication is that much of the 12CO(2-1) emission comes from smoothly distributed gas.
For modeling the gravitational potential, we used NIR images
which have the advantage of being relatively free of dust extinction and more
representative of old stellar populations than blue or visible images.
The NIR images were obtained in December 1998 at the 3.6 m
Canada-France-Hawaii Telescope (CFHT), using the CFHT Adaptive Optics
Bonnette (AOB) and the KIR infrared camera.
The AOB, also called PUEO after the sharp-visioned Hawaiian owl,
delivers essentially diffraction-limited images at H and K'(0
11 and 0
14, respectively), and images
with
 at J with guide stars as faint as R=14
(see Rigaut et al. 1998). Here the Seyfert nucleus of the galaxy
was used for wavefront sensing.
The KIR 1024
1024 pixel HgCdTe array
has 0
035/pixel, providing a field of view of
at J with guide stars as faint as R=14
(see Rigaut et al. 1998). Here the Seyfert nucleus of the galaxy
was used for wavefront sensing.
The KIR 1024
1024 pixel HgCdTe array
has 0
035/pixel, providing a field of view of
 .
The observations were obtained in excellent seeing conditions
(
.
The observations were obtained in excellent seeing conditions
(
 in the V band), with several images
taken in a dithering procedure to correct for camera defects.
The total on-source integration time was 8 minutes
each for J and
in the V band), with several images
taken in a dithering procedure to correct for camera defects.
The total on-source integration time was 8 minutes
each for J and
 ,
and the total observing time for
the two filters was 50 min including sky measurements and overheads.
,
and the total observing time for
the two filters was 50 min including sky measurements and overheads.
A J-K map was constructed by first subtracting sky
emission, as estimated from the outer regions of the images.
Then mean instrumental magnitude zero points were used to calculate a
J-K image, after aligning them to a common center.
![\begin{figure}
\par\includegraphics[height=12.5cm,angle=-90]{9545fg4t.ps}\par\includegraphics[height=12.5cm,angle=-90]{9545fg4b.ps} \end{figure}](/articles/aa/full/2008/40/aa09545-08/Timg122.gif) |
Figure 4:
Spectra maps of NGC 3147 made with the IRAM 30 m with
spacing in 12CO(1-0) ( top) and 12CO(2-1) ( bottom). The
positions are offsets relative to the center of NGC 3147, whose coordinates
are listed in Table 1. Each spectrum has a velocity scale from
-500 to
 ,
and an antenna temperature scale
(
)
from -0.05 to ,
and an antenna temperature scale
(
)
from -0.05 to
 for 12CO(1-0) and to 0.20 K
for 12CO(2-1).
for 12CO(1-0) and to 0.20 K
for 12CO(2-1). |
| Open with DEXTER |
2.4 Archival observations with Spitzer and GALEX
We acquired public images of NGC 3147 at other wavelengths to compare our
molecular gas observations with other star formation tracers.
We used a far-ultraviolet (FUV) image from the GALEX satellite,
whose band is centered at
 .
This image has been already used and studied in the context of
the GALEX Nearby Galaxies Survey
(NGS, Bianchi et al. 2003b; Gil de Paz et al. 2004; Bianchi et al. 2003a), a project that spans a
large range of physical properties and morphological types of
nearby galaxies.
The image has been obtained with a total exposure
time of 1693 s and covers a square
region on the sky of size
.
This image has been already used and studied in the context of
the GALEX Nearby Galaxies Survey
(NGS, Bianchi et al. 2003b; Gil de Paz et al. 2004; Bianchi et al. 2003a), a project that spans a
large range of physical properties and morphological types of
nearby galaxies.
The image has been obtained with a total exposure
time of 1693 s and covers a square
region on the sky of size
 ,
i.e., much larger than the extent of the optical disk
of NGC 3147, with 1
5 pixels.
As the image was reduced with the GALEX data pipeline,
it is already expressed in intensity units and sky-subtracted.
The total FUV
calibrated magnitude is
,
i.e., much larger than the extent of the optical disk
of NGC 3147, with 1
5 pixels.
As the image was reduced with the GALEX data pipeline,
it is already expressed in intensity units and sky-subtracted.
The total FUV
calibrated magnitude is
 ,
corresponding to a FUV
flux density of
,
corresponding to a FUV
flux density of
 .
.
We also acquired infrared (IR) images obtained with the IRAC camera on Spitzer,
available thanks to the project ``A Mid-IR Hubble Atlas of Galaxies''
(Principal Investigator: G. Fazio, see also Pahre et al. 2004).
These images range in wavelength from
 to
to
 ,
and were
reduced with the Spitzer data pipeline
(version S14.0.0). As in the case of the GALEX image,
they cover a large sky area (
,
and were
reduced with the Spitzer data pipeline
(version S14.0.0). As in the case of the GALEX image,
they cover a large sky area (
 ).
These images have been rotated to canonical
orientation (north up, east left) in order to allow correct superposition
on the molecular gas map.
The pixel size is 1
20 in the final images.
The stellar component at 3.6
).
These images have been rotated to canonical
orientation (north up, east left) in order to allow correct superposition
on the molecular gas map.
The pixel size is 1
20 in the final images.
The stellar component at 3.6  m and 4.5 m was
subtracted from the 8.0 m image
according to the prescriptions of
Helou et al. (2004) and Pahre et al. (2004).
This procedure provides a ``dust-only'' image at
8 m, which we will discuss in Sect. 5.2.
m and 4.5 m was
subtracted from the 8.0 m image
according to the prescriptions of
Helou et al. (2004) and Pahre et al. (2004).
This procedure provides a ``dust-only'' image at
8 m, which we will discuss in Sect. 5.2.
Using the
image, we calculated radial surface-brightness profiles by fitting
ellipses (using the IRAF/STSDAS task ellipse). The center was fixed, but the ellipticity and the position angle were allowed to vary. This brightness profile is shown in Fig. 3, together with the J-band radial profile obtained in a similar way from the
CFHT image. The zero point for the IRAC image was taken from the IRAC documentation at the Spitzer Science Center (http://ssc.spitzer.caltech.edu/irac/calib/). No corrections were made to the ``standard'' IRAC photometric calibrations. Also shown are the runs of ellipticity, ellipse position angle, and cos()
residuals of the ellipse fitting. A local peak in the ellipticity profile at
 (1 kpc) at constant position angle (85)
corresponds to a weak bar/oval feature that will be discussed in Sect. 5.1.
(1 kpc) at constant position angle (85)
corresponds to a weak bar/oval feature that will be discussed in Sect. 5.1.
3 Single dish results
The observations performed with the A and B receivers of the IRAM 30 m telescope in the two 12CO lines covered the central 50
,
corresponding to the central 10 kpc (in diameter) of the galaxy (Fig. 4). The 25 observed positions show that the central region of NGC 3147 presents extended molecular emission in both 12CO(1-0) and 12CO(2-1) (Fig. 4). The maximum detected
is 0.32 K in 12CO(1-0) and 0.31 K in 12CO(2-1), in the southeast region corresponding to the offsets (10,
-10)
and (5,
-10)
relative to the galaxy center.
The combination of observations of the 12CO(1-0) and 12CO(2-1) lines
allowed us to compute the line ratio,
 dv /
dv /
 dv,
an indicator of physical properties of the molecular gas such as
excitation and optical depth.
After smoothing the 12CO(2-1) data to the 12CO(1-0) beam resolution
(
)
and correcting for the different beam efficiencies, we found a mean
line ratio for the central region of NGC 3147 of 0.8.
This value is consistent with the optically thick emission from molecular
gas expected for the central regions of spiral galaxies (Braine & Combes 1992).
dv,
an indicator of physical properties of the molecular gas such as
excitation and optical depth.
After smoothing the 12CO(2-1) data to the 12CO(1-0) beam resolution
(
)
and correcting for the different beam efficiencies, we found a mean
line ratio for the central region of NGC 3147 of 0.8.
This value is consistent with the optically thick emission from molecular
gas expected for the central regions of spiral galaxies (Braine & Combes 1992).
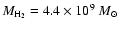
Assuming a CO-H2 conversion factor
 cm-2 (K km s-1)-1 (Solomon & Barrett 1991), the total H2 mass derived from these single dish observations is

 ,
within a radius of 5 kpc.
,
within a radius of 5 kpc.
![\begin{figure}
\par\includegraphics[height=8.8cm,angle=-90]{9545fig5.ps} \end{figure}](/articles/aa/full/2008/40/aa09545-08/Timg135.gif) |
Figure 5:
HCN(1-0) spectrum towards the center of NGC 3147, averaged over
the 9-point map made with the IRAM 30 m with
spacing. |
| Open with DEXTER |
The HCN(1-0) line has been observed for 9 positions with 7
spacing
covering the central 43
,
corresponding to the central 8.5 kpc
(in diameter). The HCN(1-0) emission has been detected most significantly
in the northwest part of the observed grid corresponding to the offset (-7
,
7
). The HCN(1-0) average spectrum over the
grid is plotted in Fig. 5. The CO(1-0)/HCN(1-0) ratio is equal to 20 on average.
Because the observed region contains the AGN, we would expect enhanced
HCN emission there. Hence, the observed CO(1-0)/HCN(1-0) ratio is unexpectedly high.
For instance in NGC 1097, this ratio is 3 in the nucleus and 10 in the star-forming ring (Kohno et al. 2003). NGC 3147 is more similar to the starburst in NGC 6951 (Krips et al. 2007b), where the ratio is 30 in the ring, and 2.5 in the nucleus.
To study the physics and distribution of the molecular gas in detail
we need to analyze both single dish and interferometric observations.
The analysis in the remainder of the paper will be performed on the
combined IRAM PdBI+30 m datasets.
4.1 Morphology and mass of the CO rings
The 12CO(1-0) and 12CO(2-1) integrated intensity distributions are
shown in Fig. 6.
The figure reveals a nuclear peak, a symmetric and
complete inner ring at a distance of about 10
from the nucleus, and a larger and incomplete ring at
a distance of about 20
from the nucleus (left panel).
In 12CO(2-1) the nuclear peak is stronger and more visible (right panel),
but there is no outer ring at a radius of 20
because of the restricted field-of-view (FWHM of primary beam
of 22
).
The outer ring-like structure can also be interpreted as spiral arms,
more tightly wound in the inner regions than in the outer ones.
The radial distribution of the azimuthally averaged 12CO(1-0)
and 12CO(2-1) intensities
is shown in Fig. 7, where there are clear dips
between the central peak and the inner ring and between the inner
ring and the outer spiral structure (partial outer ring).
Both 12CO(1-0) structures are clumpy, composed of individual giant
molecular cloud complexes,
each with a mass of a few 107 to 108 .
The total
H2 mass derived from the interferometer maps,
assuming the same CO-to-H2 conversion value used before, is
 .
The inner ring alone contributes more than half
of the total mass;
.
The inner ring alone contributes more than half
of the total mass;
 ,
and the two parts of the outer spiral have similar mass, the western part has a mass of
,
and the two parts of the outer spiral have similar mass, the western part has a mass of
 and the eastern one
 .
The total
.
The total
 (=
(=
 )
we find is in good agreement with the mass derived by Young et al. (1995) for a position centered on the galaxy nucleus,
)
we find is in good agreement with the mass derived by Young et al. (1995) for a position centered on the galaxy nucleus,
 .
Our mass estimate from single dish observations presented in Sect. 3 is larger, since it corresponds to a more extended region. In any case, this molecular gas mass is very large, more than three times larger than the most massive of the other NUGA galaxies studied so far (NGC 2782 and NGC 4569, see Hunt et al. 2008; Boone et al. 2007).
.
Our mass estimate from single dish observations presented in Sect. 3 is larger, since it corresponds to a more extended region. In any case, this molecular gas mass is very large, more than three times larger than the most massive of the other NUGA galaxies studied so far (NGC 2782 and NGC 4569, see Hunt et al. 2008; Boone et al. 2007).
![\begin{figure}
\par\includegraphics[width=8cm,angle=-90,bb=145 17 460 750]{9545fig6.eps} \end{figure}](/articles/aa/full/2008/40/aa09545-08/Timg146.gif) |
Figure 6:
Left panel: 12CO(1-0) integrated intensity
contours observed with the IRAM
PdBI+30 m toward the center of NGC 3147.
The cross marks the coordinates
of the center as given in Table 1, with offsets in arcseconds.
The rms noise level is
 .
The map, derived with 2 .
The map, derived with 2 clipping, has not been corrected for
primary beam attenuation. Contour levels run from 4
to 17
with 2.5
spacing. In this map the full
clipping, has not been corrected for
primary beam attenuation. Contour levels run from 4
to 17
with 2.5
spacing. In this map the full
 velocity range is used. The beam of 1
9
1
6
is plotted at lower left.
Right panel: same for 12CO(2-1).
The rms noise level is
velocity range is used. The beam of 1
9
1
6
is plotted at lower left.
Right panel: same for 12CO(2-1).
The rms noise level is
 .
Contour levels run from 5
to
18
with 2.5
spacing.
The beam of 1
4
1
2 is plotted at
lower left. .
Contour levels run from 5
to
18
with 2.5
spacing.
The beam of 1
4
1
2 is plotted at
lower left. |
| Open with DEXTER |
![\begin{figure}
\par\hbox{
\includegraphics[width=8cm,angle=-90]{9545fg7l.ps}\includegraphics[width=8cm,angle=-90]{9545fg7r.ps} }
\end{figure}](/articles/aa/full/2008/40/aa09545-08/Timg147.gif) |
Figure 7:
Left panel:
radial distribution (azimuthal average, deprojected to face-on
orientation) of the 12CO(1-0) integrated intensity shown in Fig. 6.
Right panel: same for 12CO(2-1). |
| Open with DEXTER |
The comparison between the 12CO maps of the two transitions,
at the same resolution and with the same spatial frequency sampling,
gives insight about the excitation conditions
of the molecular gas locally, pixel by pixel.
Figure 8 shows that when the 12CO(2-1) data are tapered
and convolved to the 12CO(1-0) resolution, the maxima of the 12CO(2-1) ring agree
quite well with the 12CO(1-0) peaks.
The ratio map is shown in Fig. 9
where the values range from 0.1 to 1.8.
The mean ratio is 0.7, consistent with the value found
with single dish observations
and also, in this case, consistent with the bulk of emission
being optically thick, as expected
in the nuclei of spiral galaxies.
Some regions, especially the center, reach a higher ratio (1.3-1.4)
where the gas is warm and dense, while in the disk and spiral arms
it is colder and more diffuse.
The peak in the northwest region of the CO(2-1)/CO(1-0) ratio map
is coincident with the strongest HCN(1-0) emission corresponding
to the offset (-7
,
7
).
4.2 Kinematics
The channel maps in Fig. 1 display overall a gross regularity of the large scale kinematics, following the expected spider diagram. However, there are some local wiggles superposed on this pattern, i.e., streaming motions. Such streaming motions are also visible in Fig. 10, which shows the isovelocity curves (first-moment map) of the 12CO(1-0) emission superposed on the 12CO(1-0) integrated intensity. Some of the perturbations in the velocity field are clearly coincident with the spiral arms, as expected from density wave theory.
A position-velocity (p-v) cut along the major axis using a position angle of 150
is presented in Fig. 11. The major-axis p-v diagram shows approximately regular kinematics, although there are clear signs of deviations from ``flatness'' at 15
on either side of the nucleus of amplitude 40 km s-1.
The minor-axis p-v diagram is displayed in Fig. 12.
The wiggles are more conspicuous on the major axis in Fig. 11
than in 12.
Although the minor-axis velocities are
not completely symmetric about the nucleus, they hint that
the outer spiral arm/pseudo-ring at a radius of 20
is already outside corotation.
This is because the sign of the radial streaming motions
(visible on the minor-axis) is expected to change at corotation, while
the tangential streaming (visible on the major-axis) does not change
at corotation (e.g. Canzian 1993).
Thus, we conclude (although with substantial
uncertainty) that corotation occurs at 15
(3 kpc),
consistent with the minor-axis p-v plot. This result will help constrain
the pattern speed of the weak bar/oval which we discuss in
Sect. 7.
4.3 Dynamical mass
The peak velocity of 200 km s-1 in the major-axis p-v diagram occurs
at a radius of 7-8
(1.5 kpc).
This value, when corrected for disk
inclination (we adopt
 ,
see Table 1) by a
factor sin i,
becomes 400 km s-1.
From the corrected peak velocity, we can estimate the
dynamical mass within this radius:
,
see Table 1) by a
factor sin i,
becomes 400 km s-1.
From the corrected peak velocity, we can estimate the
dynamical mass within this radius:
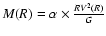 ,
where M(R) is in ,
R in kpc, and V in km s-1.
Assuming the most flattened disk-like distribution
(
,
where M(R) is in ,
R in kpc, and V in km s-1.
Assuming the most flattened disk-like distribution
(
 ),
gives a dynamical mass
),
gives a dynamical mass
 within a diameter of 3 kpc.
Assuming a roughly flat rotation curve (see Sect. 7),
this would imply a mass
within a diameter of 3 kpc.
Assuming a roughly flat rotation curve (see Sect. 7),
this would imply a mass
 within 4 kpc (roughly the radius of the PdBI primary
beam for our 12CO(1-0) observations).
With a total molecular gas mass of
within 4 kpc (roughly the radius of the PdBI primary
beam for our 12CO(1-0) observations).
With a total molecular gas mass of
 (see Sect. 4.1),
we would thus estimate a molecular mass fraction of 4-5%.
(see Sect. 4.1),
we would thus estimate a molecular mass fraction of 4-5%.
5 Comparison with other wavelengths
It is instructive to compare the distribution of the
molecular gas in the inner kpc of NGC 3147 with observations at
other wavelengths.
In particular, molecular clouds are thought to be the birth site of
future generations of stars, and thus should be strongly connected to other
emissions tracing
star formation, such as far-ultraviolet and warm dust emission.
5.1 The bar and the lopsided nucleus
The CO contours are superposed on the CFHT J-band image in Fig. 13.
There is a weak bar/oval feature at a position
angle PA = 85,
just contained inside the inner CO
ring. Only the NIR reveals this bar, since
NGC 3147 is not classified optically as a barred galaxy. Its
late type (Sbc) corresponds to a non-dominating bulge,
and the bar feature is likely not diluted by this bulge.
The major axis orientation differs by 65
from the bar
PA, which minimizes confusion due to projection effects.
![\begin{figure}
\par\includegraphics[width=7.5cm,angle=-90]{9545fig8.eps}\end{figure}](/articles/aa/full/2008/40/aa09545-08/Timg154.gif) |
Figure 8:
12CO(1-0) contours as in Fig. 6 ( left panel) superposed on the
greyscale 12CO(2-1) map that has been tapered, convolved to the same resolution,
and corrected for primary beam attenuation, in units of
 .
The beam is plotted at lower left. .
The beam is plotted at lower left. |
| Open with DEXTER |
![\begin{figure}
\par\includegraphics[width=7.5cm,angle=-90]{9545fig9.eps}\end{figure}](/articles/aa/full/2008/40/aa09545-08/Timg155.gif) |
Figure 9:
Contours and greyscale of the CO(2-1)/CO(1-0) ratio map.
Contours run from 0.1 to 1.8 in steps of 0.1 in temperature units. |
| Open with DEXTER |
![\begin{figure}
\par\includegraphics[width=7.5cm,angle=-90]{9545fg10.eps} \end{figure}](/articles/aa/full/2008/40/aa09545-08/Timg156.gif) |
Figure 10:
Overlay of the integrated 12CO(1-0) emission in grey scale,
same as Fig. 6 ( left panel), with the CO mean-velocity field in contours
spanning the range -200 km s-1 to 200 km s-1 in steps of
10 km s-1. The velocities are referred
to
 km s-1. Solid (dashed) lines are used for positive
(negative) velocities. The dotted line indicates the major axis (PA = 150). km s-1. Solid (dashed) lines are used for positive
(negative) velocities. The dotted line indicates the major axis (PA = 150). |
| Open with DEXTER |
Möllenhoff & Heidt (2001) have obtained JHK images of NGC 3147 with the 2.2 m telescope
of the Calar Alto observatory using the MAGIC NICMOS3 camera, together with 40 other
unbarred galaxies with low inclinations. They
decomposed the images into bulge and disk components, and noticed that
the bulge in NGC 3147 appears at a very different position angle than the disk;
they concluded that the bulge must be triaxial, which was a rare
feature in their sample.
We have re-reduced their MAGIC J and K' images and the oval is present,
similar to the feature seen in our CFHT images, although with noisier
isophotes. Our kinematic data suggest that this bar may be the agent of the inflow that we discuss in Sect. 6,
![\begin{figure}
\par\includegraphics[width=8.8cm]{9545fg11.ps} \end{figure}](/articles/aa/full/2008/40/aa09545-08/Timg159.gif) |
Figure 11:
12CO(1-0) position-velocity (p-v) diagram along the major
axis of NGC 3147 using the whole velocity range +/-240 km s-1.
The coordinates of the center (0, 0), the heliocentric velocity, and PA used are
given in Table 1. Contour levels are from 3.2 to
 in steps of
 . . |
| Open with DEXTER |
The ellipticity profile shown in Fig. 3 (see Sect. 2.4)
helps us estimate the length of the bar/oval distortion.
The ellipticity peaks at 5
(1 kpc), but the bar
extends roughly to a radius of 7.5
(1.5 kpc).
This is also seen in the J-band image (Fig. 13) where the bar is roughly
16
in diameter, and in the Fourier decomposition of the
stellar potential discussed in Sect. 6.
We therefore adopt a bar radius of 7.5
or 1.5 kpc,
although this estimate is subject to a rather large uncertainty,  30%.
30%.
The J-K image of NGC 3147
is shown in Fig. 14 with the 12CO(2-1) integrated
intensity overlaid as contours (see Sect. 4.1).
Coincident with the nuclear CO emission,
there is a clearly-defined
non-axisymmetric structure of 700 pc in size, which is bluer
in J-K than the surrounding regions that are devoid of gas.
This central asymmetric ``blob'' or ``lopsided nucleus''
could be the destination of the gas inflow that we discuss in Sect. 6.
5.2 The inner ring and the outer spiral
Figure 15 displays the
FUV image obtained with the GALEX satellite, described in
Sect. 2.4.
Inspection of Fig. 15
shows that NGC 3147 has a quite well-defined outer spiral
structure, outside the range of our CO observations.
There is also a compact nucleus with a central peak,
surrounded by a roughly axisymmetric ``plateau'' of emission
which breaks up into a pseudo ring at a radius of 20
.
Figure 16 shows the superposition of GALEX FUV
image with the 12CO(1-0) (left panel) and 12CO(2-1) (right)
integrated intensity contours.
The cross shown in Fig. 15 is at
the center of our CO observations, and coincides with the peak of the FUV nuclear emission.
This agreement suggests that the FUV and CO emissions are cospatial
in the nuclear region.
![\begin{figure}
\par\includegraphics[width=8.8cm]{9545fg12.ps} \end{figure}](/articles/aa/full/2008/40/aa09545-08/Timg163.gif) |
Figure 12:
12CO(1-0) position-velocity (p-v) diagram along the minor
axis of NGC 3147 using the same velocity range, center, PA, and
systemic velocity as for Fig. 11.
Contour levels are from 2.8 to
 in steps of
 . . |
| Open with DEXTER |
However, there is no clear ring in the FUV image.
The inner 10
-radius
CO ring is contained inside the circular region of the FUV emission, and the outer
CO spiral (20
-radius), at least its eastern part, has
some overlap with the FUV spiral, but there are clear shifts between the two distributions.
The 12CO(2-1) emission (essentially the inner ring) also appears to settle
inside the GALEX FUV inner ``plateau'' (Fig. 16).
The ``outer spiral'' in 12CO(1-0) falls in the interarm ``gap''
in the GALEX image.
Offsets between FUV and CO (or FIR and HI) emissions are not
uncommon in grand design spiral galaxies, such as M 100
(Sempere & García-Burillo 1997; Rand 1995) and M 51 (Calzetti et al. 2005),
and may relate to star-formation efficiency and timescale variations
in response to a spiral density wave.
The star formation and all related tracers are often located
in different regions of the spiral arms: FUV emission is more prominent
at the outer edge of the arms, where the dust extinction is low, while
FIR and
 emission is stronger at the inner edge.
However, in NGC 3147 we find CO in the middle
of the interarm region in the GALEX image, not at the inner or
outer edge of the arm; this result is quite rare.
emission is stronger at the inner edge.
However, in NGC 3147 we find CO in the middle
of the interarm region in the GALEX image, not at the inner or
outer edge of the arm; this result is quite rare.
Unlike the FUV, the 8 m ``dust-only''
image described in Sect. 2.4 shows an inner ring
apparently associated with molecular gas.
Figure 17 shows this image,
which clearly exhibits an inner-ring structure at about 10
radius,
together with a central peak.
Such rings are frequently observed in barred galaxies with
Spitzer (e.g. Regan et al. 2006).
Figure 18
shows the dust-only 8 m image with the 12CO(1-0) (left panel) and 12CO(2-1)
(right) intensity contours superposed.
The ring visible at 8 m corresponds to both the 12CO(1-0)
inner ring and the 12CO(2-1) one.
However, the outer 12CO(1-0) spiral is slightly inside the corresponding
structure in dust emission.
This may be a similar phenomenon to that seen in the GALEX FUV
image, where molecular gas peaks in the interarm regions as described
above.
We can use the 8 m dust-only image, together with the CO emission itself, to define the size and width of the inner gas (and dust) ring. The ring is rather broad, extending over roughly 2-3
in radius, or 500 pc. Measured to the middle of its width, the inner gas ring has a radius of 9-10
(1.8-2 kpc), although it is slightly elongated, being
longer along the horizontal axis. If instead we measure to the innermost portion of the ring, we
find a radius of
 (1.5 kpc). This uncertainty (20-30%) will influence our discussion in Sect. 7, where we will use the size of the ring in the context of the rotation curve to help constrain the pattern speed and location of the resonances that define the kinematics in NGC 3147.
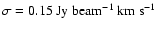
![\begin{figure}
\par\includegraphics[width=8cm,angle=-90]{9545f13c.eps} \end{figure}](/articles/aa/full/2008/40/aa09545-08/Timg166.gif) |
Figure 13:
Left panel: 12CO(1-0) contours
(0.6 to 2.6 by 0.35 Jy km s-1 beam-1)
superposed on the near-infrared J image from the CFHT,
shown in logarithmic levels. The central 50
are
shown. Right panel: same for 12CO(2-1) contours
(1.0 to 3.5 by 0.5 Jy km s-1 beam-1).
The central 30
are
shown.
|
| Open with DEXTER |
5.3 Star formation
The agreement, where present, between the molecular gas distribution and the
ultraviolet and infrared emission is consistent with on-going star formation
within the molecular clouds.
The star formation rate (SFR) can be computed from both
UV and FIR emission using the calibrations given by Kennicutt (1998)
for a
 Salpeter initial mass function:
![$\displaystyle \textit{SFR} ~ [M \mbox{$_{\odot}$ ~yr$^{-1}$ ]} = 1.4 \times 10^{-28}~L_{\rm UV}$](/articles/aa/full/2008/40/aa09545-08/img168.gif) |
|
|
(1) |
where
 is the UV luminosity in
erg s-1 Hz-1 over the wavelength range 1500-2800
is the UV luminosity in
erg s-1 Hz-1 over the wavelength range 1500-2800  ,
and
,
and
![$\displaystyle \textit{SFR} ~[M_{\odot}~{\rm yr}^{-1}] = 4.5 \times 10^{-44}~ L_{\rm FIR}$](/articles/aa/full/2008/40/aa09545-08/img171.gif) |
|
|
(2) |
where
 ,
expressed in ergs s-1, refers to the total infrared luminosity integrated over the entire mid and far-IR spectrum (8-1000 m). We first compute the UV luminosity from the GALEX map inside the FOV of 42
,
to better separate the SFR in the PdBI FOV from the total, and find a
,
expressed in ergs s-1, refers to the total infrared luminosity integrated over the entire mid and far-IR spectrum (8-1000 m). We first compute the UV luminosity from the GALEX map inside the FOV of 42
,
to better separate the SFR in the PdBI FOV from the total, and find a
 yr-1.
yr-1.
We then use the Spitzer MIPS images available from the archive to estimate how much FIR flux falls within the FOV of the PdBI primary beam compared to the total integrated over the much larger IRAS beams. Rough measurements give a fraction of 12% for 160 m and
22% for 24 m (the 70 m image is not available). We then estimate the FIR luminosity by scaling the IRAS 100 m and 60 m fluxes by 12% and 17%, respectively. This gives 1.39 Jy at 60 m and 3.55 Jy at 100 m, which results in an estimate for the SFR of 0.8 yr-1, similar to that obtained from GALEX.
The compatibility between the two estimations of SFR (from UV and FIR) means that there is not
significant obscuration, which is probably due to the nearly face-on view of the galaxy.
The SFR per unit area inferred from these values is
0.016 yr-1 kpc-2,
high for spiral disks but similar to, although slightly lower than, typical
values for IR-selected circumnuclear starbursts (Kennicutt 1998).
Moreover, given the gas mass we derived in Sect. 4.1
and the correlations shown in Kennicutt (1998),
the global star-formation efficiency within the inner 8 kpc is low, 1% rather
than the more typical value of 10%.
On the other hand, the molecular gas is concentrated into well-defined
structures; more than half the molecular mass is found in the inner ring
alone (see Sect. 4.1).
If we consider only the molecular gas in the inner ring, the gas surface
density is 320 pc-2, roughly 4 times higher
than we obtain by averaging over the entire FOV.
Nevertheless, it is significantly lower than that in M 51
spiral arms (Henry et al. 2003).
6 Computation of the torques
6.1 Evaluation of the gravitational potential
As described in previous papers (e.g., García-Burillo et al. 2005),
we assume that NIR images can give us the best approximation
for the total stellar mass distribution, being less affected than
optical images by
dust extinction or by stellar population biases. We here recall
the essential definitions and assumptions.
The J-band image was first deprojected according to the
angles PA = 150
and
.
We have not deprojected
the bulge separately, since we do not know its actual flattening, but
because the galaxy is of late type (Sbc), it does not have
a large contribution. The image is
completed in the vertical
dimension by assuming an isothermal plane model with a constant scale height,
equal to 1/12th of the radial scale-length of the image. The potential is
then derived by a Fourier transform method, assuming a constant mass-to-light (M/L) ratio.
The M/L value is selected to reproduce the observed CO rotation curve.
The potential was also calculated from the lower-resolution
MAGIC images, which have a much larger field-of-view (162
).
The same results are obtained, and the potential is shown to be axisymmetric
at large radii.
Beyond a radius of 20
,
the mass density
is set to 0, thus suppressing any spurious m=4 terms;
this is sufficient to compute the potential over the PdBI 12CO(1-0) primary beam.
![\begin{figure}
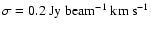
\par\includegraphics[width=8cm,angle=-90]{9545f14c.eps} \end{figure}](/articles/aa/full/2008/40/aa09545-08/Timg173.gif) |
Figure 14:
The J-K image from the CFHT with
12CO(2-1) integrated intensity overlaid in contours
(1.0 to 3.5 by 0.5 Jy km s-1 beam-1).
North is up and east to the left.
|
| Open with DEXTER |
![\begin{figure}
\par\includegraphics[width=8cm,angle=-90]{9545f15c.eps} \end{figure}](/articles/aa/full/2008/40/aa09545-08/Timg174.gif) |
Figure 15:
GALEX FUV sky subtracted image of NGC 3147.
The central 120
of the galaxy are
shown.
The box shows the central 50
,
field of view of our 12CO observations.
|
| Open with DEXTER |
For the non-axisymmetric part, the
potential
 is then decomposed in the different
 -modes:
where  and
and  represent the amplitude and phase of the m-mode.
The strength of the m-Fourier component, Qm(R) is defined as
 ,
i.e. by the ratio between tangential
and radial forces (e.g. Combes & Sanders 1981).
The strength of the total non-axisymmetric perturbation is defined by:
,
i.e. by the ratio between tangential
and radial forces (e.g. Combes & Sanders 1981).
The strength of the total non-axisymmetric perturbation is defined by:
![\begin{figure}
\par\includegraphics[width=8cm,angle=-90]{9545f16c.eps} \end{figure}](/articles/aa/full/2008/40/aa09545-08/Timg182.gif) |
Figure 16:
Left panel: 12CO(1-0) contours
(0.6 to 2.6 by 0.35 Jy km s-1 beam-1) superposed on
the GALEX FUV image of NGC 3147, shown in logarithmic
levels. The central 50
are
shown. Right panel: same for 12CO(2-1) contours
(1.0 to 3.5 by 0.5 Jy km s-1 beam-1). The central
30
are shown. |
| Open with DEXTER |
where
 represents the maximum amplitude of the tangential force and F0(R) is the mean
axisymmetric radial force.
Figure 19 displays these Q values as a function of radius for NGC 3147.
A bar (m=2) can be seen clearly, with a peak radius of 1 kpc (5
),
and a total extent of 1.5 kpc (7.5
)
in radius.
These dimensions are similar to those inferred from the
ellipticity distribution discussed in Sect. 5.1, and strengthen
our conclusion that this structure is ``bar-like''.
There is also an asymmetry in the m=2 profile towards
the center. The lopsidedness has a correspondence in the gas
morphology described in Sect. 4.1 and the J-K image
discussed in Sect. 2.4.
The bar is regular in phase, but its strength is relatively modest.
represents the maximum amplitude of the tangential force and F0(R) is the mean
axisymmetric radial force.
Figure 19 displays these Q values as a function of radius for NGC 3147.
A bar (m=2) can be seen clearly, with a peak radius of 1 kpc (5
),
and a total extent of 1.5 kpc (7.5
)
in radius.
These dimensions are similar to those inferred from the
ellipticity distribution discussed in Sect. 5.1, and strengthen
our conclusion that this structure is ``bar-like''.
There is also an asymmetry in the m=2 profile towards
the center. The lopsidedness has a correspondence in the gas
morphology described in Sect. 4.1 and the J-K image
discussed in Sect. 2.4.
The bar is regular in phase, but its strength is relatively modest.
After having calculated the forces per unit mass (Fx and Fy) from the derivatives of
on
each pixel, the torques per unit mass t(x,y) can be computed by:
t(x,y) = x Fy -y Fx.
The torque map is oriented according to the sense of rotation in the plane of the galaxy.
The combination of the torque map and the gas density  map then
allows us to derive the net effect on the gas at each radius.
The gravitational torque map weighted by the gas surface density
map then
allows us to derive the net effect on the gas at each radius.
The gravitational torque map weighted by the gas surface density
 ,
normalized to its maximum value, is shown in Figs. 20
and 21 for CO(1-0) and CO(2-1), respectively.
,
normalized to its maximum value, is shown in Figs. 20
and 21 for CO(1-0) and CO(2-1), respectively.
To estimate the radial gas flow induced by the torques, we first compute the torque
per unit mass averaged over azimuth, using
 as the actual weighting function, i.e.:
By definition, t(R) represents the time derivative of the specific angular momentum L of the gas averaged azimuthally, i.e.,
 .
To derive dimensionless quantities,
we normalize this variation of angular momentum per unit time to the angular momentum at this radius and to the rotation period. We then estimate the efficiency of the gas flow as
the average fraction of the gas specific angular momentum transferred in one rotation
(
.
To derive dimensionless quantities,
we normalize this variation of angular momentum per unit time to the angular momentum at this radius and to the rotation period. We then estimate the efficiency of the gas flow as
the average fraction of the gas specific angular momentum transferred in one rotation
(
 )
by the stellar potential, as a function of radius, i.e., by the function
)
by the stellar potential, as a function of radius, i.e., by the function
 defined as:
where  is assumed to be well represented by its axisymmetric
estimate, i.e.,
is assumed to be well represented by its axisymmetric
estimate, i.e.,
 .
The
curves for NGC 3147 derived from the CO(1-0) and
the CO(2-1) data are displayed in
Fig. 22.
.
The
curves for NGC 3147 derived from the CO(1-0) and
the CO(2-1) data are displayed in
Fig. 22.
![\begin{figure}
\par\includegraphics[width=8cm,angle=-90]{9545f17c.eps}\end{figure}](/articles/aa/full/2008/40/aa09545-08/Timg193.gif) |
Figure 17:
Spitzer/IRAC ``dust-only'' image at 8 m of NGC 3147. The central 120
of the galaxy are shown. The box shows the central 50
,
field of view of our 12CO observations. |
| Open with DEXTER |
![\begin{figure}
\par\includegraphics[width=8cm,angle=-90]{9545f18b.eps}\end{figure}](/articles/aa/full/2008/40/aa09545-08/Timg194.gif) |
Figure 18:
Left panel: 12CO(1-0) contours
(0.6 to 2.6 by 0.35 Jy km s-1 beam-1) superposed on
the 8 m ``dust-only'' (Spitzer/IRAC) image of
NGC 3147, shown in logarithmic levels. The central 50
are
shown. Right panel: same for 12CO(2-1) contours (1.0 to 3.5 by
0.5 Jy km s-1 beam-1). The central 30
are
shown. |
| Open with DEXTER |
The gravitational torque maps in Fig. 20 show
that the derived torques change sign following a characteristic 2D
butterfly pattern. The CO contours reveal that for the material in the inner ring
(radius 2 kpc, 10
), part of the gas is trailing the bar,
while part of the gas is leading it. The observed gas distribution is representative
of the time spent by a molecular cloud on a typical orbit at this
location. The azimuthal average of the torques shown in Fig. 22
suggests that the torques are predominantly negative
inside a radius of 2 kpc, while they become zero or positive outside.
If the near side is the northeast side, the rotation sense of the galaxy is counterclockwise, and the whole spiral structure is trailing with respect to the rotation. In the spiral structure winding into the outer 12CO(1-0) ring, the torques almost cancel out on average but are still predominantly positive. Inside the inner ring (r <2 kpc), however, the dominating torques are negative, although weak in absolute value. The 12CO(2-1) emission is more clumpy, and our map suffers from lower sensitivity; there is relatively more emission in the central part. Although the emission is spread over three quadrants in the center, the negative torques are still predominant there (Fig. 21). The negative torques there are due to the central asymmetric CO distribution, mainly the nuclear component, at radii inside 3-4
.
The component is resolved in 12CO(2-1), and is not aligned with the nuclear bar, but rather shifted to the leading
side; therefore, negative torques dominate.
7 Discussion
We find that the two molecular structures (inner ring and outer spiral),
in addition to a central peak of 12CO(2-1) emission, dominate the
CO map of NGC 3147's inner region.
The inner ring coincides with the ring in the dust-only 8 m image,
and the lopsided central peak falls at the same position as
the asymmetric nuclear structure
in the J-K map.
These features are not present in the stars (e.g., J band, IRAC 3.6 m,
and GALEX), but are rather features of the ISM.
On the other hand, the outer spiral also appears in the stars as shown by the
GALEX image; however, there is an offset between
them, as the CO emission falls in the interarm region relative to
the outer spiral (see Fig. 16).
A probable explanation is that the CO outer spiral is not a permanent structure but is transient.
The gas participates in a spiral wave and forms stars, and then
the newly formed stars decouple from the gas component.
The young stars heat only the dust present at their location, while the bulk
of the gas has moved to another density condensation.
The inward migration of the dense gas with respect to the initial resonance
has for been discussed by, e.g., Regan & Teuben (2003).
This phenomenon, because it is very transient, is statistically rarely encountered.
In this scenario, the CO clouds would not trace stars of the same age as those
that have heated the dust observable at 8 m or of those whose emission
is detected in the FUV, but rather they will be the birth site of future stellar generations.
For the torques computation, we interpret the
results by identifying the resonances with the bar.
Let us note that CO resonant rings have already been observed
in weakly barred galaxies, where the bar is inconspicuous in the optical
(e.g., NGC 5005, NGC 7217: Combes et al. 2004; Sakamoto et al. 2000).
The rotation curve derived from the CO kinematics
is rather peaked in the center, and corresponds well
to the gravitational model obtained from the NIR
image. Both are fitted by an axisymmetric mass model, with a rotation curve as shown in Fig. 23, which allows us to derive the characteristic dynamical frequencies.
If the stellar bar ends at or just inside its ultra-harmonic resonance
(UHR), as is canonical for bar dynamics, this means
that the pattern speed of the bar would be roughly
 km s-1 kpc-1, corresponding to a bar
with one or two inner Lindblad resonances, as is common. The presence of these ILRs is not certain, however, given the possible non-circular motions in the bar. The inner CO ring would then correspond to the UHR (r=2 kpc, 10
)
just inside corotation, which we estimated to be at a radius of 15
(3 kpc) in Sect. 4.2.
The measurements of the inner ring radius and bar length suggest that the bar/oval ends roughly at the onset of the inner ring. However, the considerable uncertainties of these measurements and the finite width of the ring lead to an uncertainty in the pattern speed
km s-1 kpc-1, corresponding to a bar
with one or two inner Lindblad resonances, as is common. The presence of these ILRs is not certain, however, given the possible non-circular motions in the bar. The inner CO ring would then correspond to the UHR (r=2 kpc, 10
)
just inside corotation, which we estimated to be at a radius of 15
(3 kpc) in Sect. 4.2.
The measurements of the inner ring radius and bar length suggest that the bar/oval ends roughly at the onset of the inner ring. However, the considerable uncertainties of these measurements and the finite width of the ring lead to an uncertainty in the pattern speed
 of the bar.
The outer CO spiral corresponds to the spiral
structure emerging from the bar, beyond its
corotation.
The pitch angle of these spiral arms is quite small,
as is expected for a weak bar.
In this scenario, the gas in the inner CO ring is inside
corotation; due to the negative torques there, the gas
loses angular momentum and is therefore
flowing inwards.
Due to the weak bar, the rate of inflow
is relatively low, with a time-scale
of about 5 rotations (Fig. 22).
The amount of gas flowing inwards is consistent with what might be needed to fuel the Seyfert 2 nucleus. The gas surface density in the central kiloparsec is about 10 pc-2;
if the gas at 1 kpc from the center falls in within 5 dynamical time-scales (of 20 Myr),
then the feeding rate is about 0.5 yr-1. Assuming a mass-to-energy conversion efficiency of
 % (
% (
 ), then a luminosity of order
 erg s-1 is accounted for, more than enough for this low-luminosity AGN.
The spatial resolution of the CO maps is not yet sufficient to determine more precisely whether the gas is actually feeding the AGN, but we can at least conclude that we are observing the gas inflow into the 100-200 pc scale circumnuclear region.
8 Conclusions
![\begin{figure}
\par\includegraphics[angle=-90,width=8.8cm]{9545f19.ps} \end{figure}](/articles/aa/full/2008/40/aa09545-08/Timg200.gif) |
Figure 19:
Strengths (Q1, Q2, and total  )
and phases ( )
and phases ( and
and  )
of
the m=1 and m=2 Fourier
components of the stellar potential inside a field of
48
in diameter (r < 4.6 kpc). )
of
the m=1 and m=2 Fourier
components of the stellar potential inside a field of
48
in diameter (r < 4.6 kpc). |
| Open with DEXTER |
![\begin{figure}
\par\includegraphics[angle=-90,width=8.8cm,bb=80 80 530 610]{9545f20.ps}\end{figure}](/articles/aa/full/2008/40/aa09545-08/Timg201.gif) |
Figure 20:
CO(1-0) contours overlaid on the gravitational torque
map (t(x, y) (x, y), as defined in text) in the center of NGC 3147.
The torque map (grey/color scale) is
normalized to the maximum absolute value of the torques.
The derived torques change sign as expected in a butterfly diagram,
delineating four quadrants. The orientation of quadrants follows
the bar orientation in NGC 3147. In this deprojected picture,
the major axis of the galaxy is oriented parallel to the abscissa.
The line reproduces the mean orientation of the bar
(PA = 20
on the
deprojected image and 85
on the projected one). |
| Open with DEXTER |
![\begin{figure}
\par\includegraphics[angle=-90,width=8.8cm,bb=80 80 530 610]{9545f21.ps} \end{figure}](/articles/aa/full/2008/40/aa09545-08/Timg202.gif) |
Figure 21:
Same as Fig. 20 for the 12CO(2-1)
emission taken as a tracer of gas surface density. |
| Open with DEXTER |
![\begin{figure}
\par\includegraphics[angle=-90,width=18cm]{9545f22.ps} \end{figure}](/articles/aa/full/2008/40/aa09545-08/Timg203.gif) |
Figure 22:
The torque, or more precisely the fraction of the angular momentum transferred
from/to the gas in one rotation - dL/L - is plotted for 12CO(1-0) ( left) and
12CO(2-1) ( right). |
| Open with DEXTER |
The molecular gas in the Seyfert 2 galaxy NGC 3147 has been
mapped with high resolution (1
9
1
6 Gaussian beam
for the 12CO(1-0) line) inside a radius of 25
(5 kpc).
The CO emission shows a central peak (mainly in 12CO(2-1)) and a ring at distance of 2 kpc.
In 12CO(1-0) also an outer spiral at distance of 4 kpc is detected.
The observed CO has a mean line intensity ratio
 ,
consistent with the optically thick emission expected in the nuclei of spiral galaxies, and broadly regular kinematics with some evidence for local non-circular motions.
,
consistent with the optically thick emission expected in the nuclei of spiral galaxies, and broadly regular kinematics with some evidence for local non-circular motions.
Comparing the molecular gas distribution with tracers of
star formation, we find that central emission and the inner
CO ring coincide well with the FUV (GALEX) and 8 m
(Spitzer) emissions, while the outer CO spiral structure/ring is
instead located
within an interarm interval
detected by GALEX and Spitzer.
We interpret this partial disagreement as due to the transient
nature of the outer CO ring.
It would be a structure
in re-condensation that traces a future stellar generation, but
is decoupled from those that have heated the dust observable at
8 m or from whose emission is detected in the FUV.
![\begin{figure}
\par\includegraphics[angle=-90,width=8.8cm]{9545f23.ps} \end{figure}](/articles/aa/full/2008/40/aa09545-08/Timg206.gif) |
Figure 23:
Model rotation curve and derived frequencies  , ,
 ,
and ,
and
 ,
for NGC 3147. The star symbols
are the data derived from the CO kinematics, deprojected
with an inclination of
.
The horizontal line corresponds to ,
for NGC 3147. The star symbols
are the data derived from the CO kinematics, deprojected
with an inclination of
.
The horizontal line corresponds to
 km s-1 kpc-1. km s-1 kpc-1. |
| Open with DEXTER |
With a NIR image obtained with the Canada-France-Hawaii Telescope,
we have identified the presence of a weak bar in NGC 3147,
a galaxy classified as non-barred in the optical.
This stellar bar acting on the gas produces gravity torques.
A portion of the gas present
in the inner 12CO(1-0) ring is trailing the bar, while part
of the gas leads it. The gravity torques are negative inside
a radius of 2 kpc, while they become zero or positive outside.
In the outer 12CO(1-0) spiral the torques almost cancel
out on average, but are positive. In the more clumpy inner 12CO(2-1) ring,
the predominant torques are negative.
We interpret these results by identifying the resonances with the bar.
The inner CO ring would correspond to the ultra-harmonic resonance (r = 2 kpc) just inside corotation, and the outer CO spiral
to the spiral structure emerging from the bar, beyond
its corotation, which we estimate is located at 3 kpc.
In the inner CO ring, the gas is inside corotation due to the negative
torques there; it loses angular momentum and is flowing inwards.
NGC 3147 is not the first case in the NUGA sample where inflowing gas has been found:
NGC 2782 (Hunt et al. 2008), and NGC 6574 (Lindt-Krieg et al. 2008)
also show this feature. However, only NGC 2782 has a strong
and significant inflow, due to a nuclear bar
embedded in the primary one and to gas aligned with the nuclear bar.
The amount of inflowing gas in NGC 3147, quantified
from the gravity torques computation, is modest but could still be sufficient to feed the
Seyfert 2 nucleus at a rate of about 0.5 yr-1.
Although higher spatial resolution is needed to determine whether the
gas is actually feeding the AGN, we are observing the gas inflow to the
100-200 pc central region.
Acknowledgements
The authors would like to thank the anonymous referee,
whose comments have been very instructive
and useful for improving the original version of the paper.
We thank the scientific and technical staff at IRAM for their
work in making our 30 m and PdBI observations possible.
V. Casasola is pleased to acknowledge the hospitality and
stimulating environment provided by the Observatoire de
Paris-LERMA, where part of the work on this paper was done
during her stay in Paris, thanks to the EARA agreement.
In this work, we have made use of MAST/GALEX
images and the Spitzer archive.
- Bettoni, D.,
Galletta, G., & García-Burillo, S. 2003, A&A, 405,
5 [NASA ADS] [CrossRef] [EDP Sciences]
(In the text)
- Bianchi, L.,
Madore, B., Thilker, D., et al. 2003a, The Local Group as an
Astrophysical Laboratory, 10 [NASA ADS]
- Bianchi, L.,
Madore, B., Thilker, D., Gil de Paz, A., & GALEX Science Team
2003b, BAAS, 35, 1354 [NASA ADS]
- Bianchi, S.,
Corral, A., Panessa, F., et al. 2008, MNRAS, 108
(In the text)
- Boone, F., Baker, A.
J., Schinnerer, E., et al. 2007, A&A, 471, 113 [NASA ADS] [CrossRef] [EDP Sciences]
- Braine, J., &
Combes, F. 1992, A&A, 264, 433 [NASA ADS]
(In the text)
- Braine, J., Combes,
F., Casoli, F., et al. 1993, A&AS, 97, 887 [NASA ADS]
- Calzetti, D.,
Kennicutt, R. C., Jr., Brianch, L., et al. 2005, ApJ, 633,
871 [NASA ADS] [CrossRef]
(In the text)
- Canzian, B. 1993,
ApJ, 414, 487 [NASA ADS] [CrossRef]
(In the text)
- Casoli, F., Dickey,
J., Kazes, I., et al. 1996, A&AS, 116, 193 [NASA ADS] [CrossRef] [EDP Sciences]
- Combes, F. 2001,
Advanced Lectures on the Starburst-AGN, 223 [NASA ADS] [CrossRef]
- Combes, F., &
Sanders, R. H. 1981, A&A, 96, 164 [NASA ADS]
(In the text)
- Combes, F.,
Garca-Burillo, S., Boone, F., et al. 2004, A&A, 414, 857 [NASA ADS] [CrossRef] [EDP Sciences]
(NUGA II)
(In the text)
- Friedli, D., &
Martinet, L. 1993, A&A, 277, 27 [NASA ADS]
(In the text)
-
García-Burillo, S., Sempere, M. J., Combes, F., Hunt,
L. K., & Neri, R. 2000, A&A, 363, 869 [NASA ADS]
-
García-Burillo, S., Combes, F., Humt, L. K., et al. 2003,
A&A, 407, 485 [NASA ADS] [CrossRef] [EDP Sciences] (NUGA I)
(In the text)
-
García-Burillo, S., Combes, F., Schinnerer, E., Boone, F.,
& Hunt, L. K. 2005, A&A, 441, 1011 [NASA ADS] [CrossRef] [EDP Sciences] (NUGA IV)
(In the text)
- Gil de Paz, A.,
Madore, B. F., Boissier, S., & GALEX Science 2004, BAAS,
36, 1410 [NASA ADS]
- Guilloteau, S.,
& Lucas, R. 2000, in Imaging at Radio through Submillimeter
Wavelengths, ASP Conf. Proc., 217, 299
(In the text)
- Heckman,
T. M., Smith, E. P., Baum, S. A., et al. 1986,
ApJ, 311, 526 [NASA ADS] [CrossRef]
(In the text)
- Heckman,
T. M., Blitz, L., Wilson, A. S., Armus, L., & Miley,
G. K. 1989, ApJ, 342, 735 [NASA ADS] [CrossRef]
- Helfer, T. T.,
Thornley, M. D., Regan, M. W., et al. 2003, ApJS, 145,
259 [NASA ADS] [CrossRef]
- Helou, G., Roussel,
H., Appleton, P., et al. 2004, ApJS, 154, 253 [NASA ADS] [CrossRef]
(In the text)
- Henry, A. L.,
Quillen, A. C., & Gutermuth, R. 2003, AJ, 126, 2831 [NASA ADS] [CrossRef]
(In the text)
- Ho, L. C., Filippenko,
A. V., & Sargent, W. L. W. 1997, ApJS, 112,
315 [NASA ADS] [CrossRef]
(In the text)
- Hunt, L. K., Combes,
F., Garcia-Burillo, S., et al. 2008, A&A, 482, 133 [NASA ADS] [CrossRef] [EDP Sciences]
(NUGA IX)
- Jogee, S. 2006, in
Physics of Active Galactic Nuclei at all Scales, Lectures Notes in
Physics, 693, 143
(In the text)
- Kennicutt,
R. C., Jr. 1998, ARA&A, 36, 189 [NASA ADS] [CrossRef]
(In the text)
- Kohno, K., Ishizuki, S.,
Matsushita, S., Vila-Vilaro, B., & Kawabe, R. 2003, PASJ, 55,
L1 [NASA ADS]
(In the text)
- Krips, M., Eckart,
A., Neri, R., et al. 2006, A&A, 446, 113 [NASA ADS] [CrossRef] [EDP Sciences]
- Krips, M., Eckart
A., Krichbaum T. P. et al. 2007a, A&A, 464, 553 [NASA ADS] [CrossRef] [EDP Sciences]
(NUGA V)
- Krips, M., Neri R.,
& García-Burillo, S. 2007b, A&A 468, L63 [NASA ADS] [CrossRef]
(NUGA VI)
(In the text)
- Lindt-Krieg, E., Eckart,
A., Neri, R., et al. 2008, A&A, 479, 377 [NASA ADS] [CrossRef] [EDP Sciences]
(NUGA VIII)
(In the text)
- Möllenhoff, C.,
& Heidt, J. 2001, A&A, 368, 16 [NASA ADS] [CrossRef] [EDP Sciences]
(In the text)
- Nagar, N. M.,
Falcke, H., Wilson, A. S., & Ulvestad, J. S. 2002,
A&A, 392, 53 [NASA ADS] [CrossRef] [EDP Sciences]
(In the text)
- Pahre, M. A.,
Ashby, M. L. N., Fazio, G. G., & Willner,
S. P. 2004, ApJS, 154, 229 [NASA ADS] [CrossRef]
(In the text)
- Rand, R. J. 1995,
AJ, 109, 2444 [NASA ADS] [CrossRef]
- Roberts, T. P.,
& Warwick, R. S. 2000, MNRAS, 315, 98 [NASA ADS] [CrossRef]
(In the text)
- Regan, M. W.,
& Teuben P. 2003, ApJ, 582, 723 [NASA ADS] [CrossRef]
(In the text)
- Regan, M. W.,
Thornley, M. D., Helfer, T. T., et al. 2001, ApJ,
561, 218 [NASA ADS] [CrossRef]
- Regan, M. W.,
Thornley, M. D., Vogel S. N., et al. 2006, ApJ, 652,
1112 [NASA ADS] [CrossRef]
(In the text)
- Rigaut, F., Salmon,
D., Arsenault, R., et al. 1998, PASP, 110, 152 [NASA ADS] [CrossRef]
(In the text)
- Sakamoto, K.,
Okumura, S. K., Ishizuki, S., & Scoville, N. Z. 1999,
ApJS, 124, 403 [NASA ADS] [CrossRef]
- Sakamoto, K.,
Baker A. J., & Scoville N. Z. 2000, ApJ, 533,
149 [NASA ADS] [CrossRef]
-
Schinnerer, E., Eckart, A., & Tacconi, L. J. 2000a, ApJ,
533, 826 [NASA ADS] [CrossRef]
-
Schinnerer, E., Eckart, A., Tacconi, L. J., Genzel, R., &
Downes, D. 2000b, ApJ, 533, 850 [NASA ADS] [CrossRef]
- Sempere,
M. J., & García-Burillo, S. 1997, A&A, 325,
769 [NASA ADS]
- Shu, F. H., Tremaine,
S., Adams, F. C., & Ruden, S. P. 1990, ApJ, 358,
495 [NASA ADS] [CrossRef]
- Solomon, P. M.,
& Barrett, J. W. 1991, in Dynamics of Galaxies and Their
Molecular Cloud Distributions, Proc. IAU Symp., 146, 235
(In the text)
- Terashima,
Y., & Wilson, A. S. 2003, ApJ, 583, 145 [NASA ADS] [CrossRef]
(In the text)
- Ulvestad,
J. S., & Ho, L. C. 2001, ApJ, 562, L133 [NASA ADS] [CrossRef]
- Vila-Vilaró, B.,
Taniguchi, Y., & Nakai, N. 1998, AJ, 116, 1553 [NASA ADS] [CrossRef]
- Young, J. S., Xie,
S., Tacconi, L., et al. 1995, ApJS, 98, 219 [NASA ADS] [CrossRef]
Copyright ESO 2008
![\begin{figure}
\par\includegraphics[width=16cm,angle=-90]{9545fig1.eps} \end{figure}](/articles/aa/full/2008/40/aa09545-08/img74.gif)
![\begin{figure}
\par\includegraphics[width=16.3cm,angle=-90]{9545fig2.eps} \end{figure}](/articles/aa/full/2008/40/aa09545-08/img77.gif)
![\begin{figure}
\par\includegraphics[width=8.8cm,angle=0,bb=47 145 590 680]{9545fig3.ps}
\end{figure}](/articles/aa/full/2008/40/aa09545-08/img91.gif)
![\begin{figure}
\par\includegraphics[height=12.5cm,angle=-90]{9545fg4t.ps}\par\includegraphics[height=12.5cm,angle=-90]{9545fg4b.ps} \end{figure}](/articles/aa/full/2008/40/aa09545-08/img122.gif)
![\begin{figure}
\par\includegraphics[height=8.8cm,angle=-90]{9545fig5.ps} \end{figure}](/articles/aa/full/2008/40/aa09545-08/img135.gif)
![\begin{figure}
\par\includegraphics[width=8cm,angle=-90,bb=145 17 460 750]{9545fig6.eps} \end{figure}](/articles/aa/full/2008/40/aa09545-08/img146.gif)
![\begin{figure}
\par\hbox{
\includegraphics[width=8cm,angle=-90]{9545fg7l.ps}\includegraphics[width=8cm,angle=-90]{9545fg7r.ps} }
\end{figure}](/articles/aa/full/2008/40/aa09545-08/img147.gif)
![\begin{figure}
\par\includegraphics[width=7.5cm,angle=-90]{9545fig8.eps}\end{figure}](/articles/aa/full/2008/40/aa09545-08/img154.gif)
![\begin{figure}
\par\includegraphics[width=7.5cm,angle=-90]{9545fig9.eps}\end{figure}](/articles/aa/full/2008/40/aa09545-08/img155.gif)
![\begin{figure}
\par\includegraphics[width=7.5cm,angle=-90]{9545fg10.eps} \end{figure}](/articles/aa/full/2008/40/aa09545-08/img156.gif)
![\begin{figure}
\par\includegraphics[width=8.8cm]{9545fg11.ps} \end{figure}](/articles/aa/full/2008/40/aa09545-08/img159.gif)
![\begin{figure}
\par\includegraphics[width=8.8cm]{9545fg12.ps} \end{figure}](/articles/aa/full/2008/40/aa09545-08/img163.gif)
![\begin{figure}
\par\includegraphics[width=8cm,angle=-90]{9545f13c.eps} \end{figure}](/articles/aa/full/2008/40/aa09545-08/img166.gif)
![\begin{figure}
\par\includegraphics[width=8cm,angle=-90]{9545f14c.eps} \end{figure}](/articles/aa/full/2008/40/aa09545-08/img173.gif)
![\begin{figure}
\par\includegraphics[width=8cm,angle=-90]{9545f15c.eps} \end{figure}](/articles/aa/full/2008/40/aa09545-08/img174.gif)
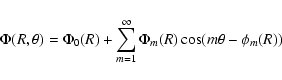
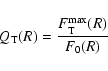
![\begin{figure}
\par\includegraphics[width=8cm,angle=-90]{9545f16c.eps} \end{figure}](/articles/aa/full/2008/40/aa09545-08/img182.gif)
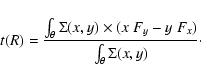
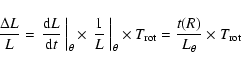
![\begin{figure}
\par\includegraphics[width=8cm,angle=-90]{9545f17c.eps}\end{figure}](/articles/aa/full/2008/40/aa09545-08/img193.gif)
![\begin{figure}
\par\includegraphics[width=8cm,angle=-90]{9545f18b.eps}\end{figure}](/articles/aa/full/2008/40/aa09545-08/img194.gif)
![\begin{figure}
\par\includegraphics[angle=-90,width=8.8cm]{9545f19.ps} \end{figure}](/articles/aa/full/2008/40/aa09545-08/img200.gif)
![\begin{figure}
\par\includegraphics[angle=-90,width=8.8cm,bb=80 80 530 610]{9545f20.ps}\end{figure}](/articles/aa/full/2008/40/aa09545-08/img201.gif)
![\begin{figure}
\par\includegraphics[angle=-90,width=8.8cm,bb=80 80 530 610]{9545f21.ps} \end{figure}](/articles/aa/full/2008/40/aa09545-08/img202.gif)
![\begin{figure}
\par\includegraphics[angle=-90,width=18cm]{9545f22.ps} \end{figure}](/articles/aa/full/2008/40/aa09545-08/img203.gif)
![\begin{figure}
\par\includegraphics[angle=-90,width=8.8cm]{9545f23.ps} \end{figure}](/articles/aa/full/2008/40/aa09545-08/img206.gif)