A&A 488, 161-165 (2008)
DOI: 10.1051/0004-6361:20079316
D. Chakrabarty1 - I. V. Sideris2
1 - School of Physics &
Astronomy, University of Nottingham,
Nottingham NG7 2RD, UK
2 - Institute for Theoretical Physics, University of Zürich,
Winterthurerstrasse 190, Zürich 8057, Switzerland
Received 21 December 2007 / Accepted 18 April 2008
Abstract
Aims. We quantify the amount of chaos that exists in the local phase space.
Methods. A sample of orbits from four different models of the solar neighbourhood phase space are analysed by a new chaos identification (and quantification) technique. While three of the models we used bear the signature of the perturbation due to both the Galactic bar and the spiral pattern, the last of the models is a bar-only one. We explore the models by comparing the corresponding values of chaos strength that are induced at the various energy levels.
Results. We find that all the viable models that have been demonstrated to successfully reproduce the local phase space structure - models that include the bar as well as the spiral - bear strong chaoticity, though the model that implies the highest degree of chaos is the one in which overlap of the major resonances of the bar and the spiral occurs. The bar-only model is found to display regularity. We advance chaos as primarily responsible for the splitting of the Hyades-Pleiades mode (the larger mode) of the local velocity distribution.
Key words: chaos - Galaxy: solar neighbourhood
The availability of transverse velocities of nearby stars from
Hipparcos has facilitated the construction of the local phase space
distribution (Dehnen 1998; Skuljan et al. 1999; Fux 2001). In contradiction to the
conventional idea of stellar dynamics, all representations of this
distribution manifest strong non-linearity and multi-modalness. This
clumpy nature of the solar neighbourhood velocity distribution (f)
has been addressed in Quillen (2003); Dehnen (2000); de Simone et al. (2004); Chakrabarty (2007); Famaey et al. (2005); Fux (2001)
and others; consensus appears to be emerging as to the origin of the basic bimodal
nature of the distribution in terms of scattering off the outer
Lindblad resonance of the Galactic bar (
![]() ).
).
However, a dynamical basis for the existence of the other structure
(such as the Hyades, Pleiades, Sirius, Coma Berenicus stellar streams)
has not been explored sufficiently Chakrabarty (2007, hereafter,
Paper I) concluded that the observed phase space structure is due to the
dynamical influence of the Galactic bar and 4-armed spiral pattern;
the influence of the bar alone or the spiral alone was reported to
be insufficient in explaining the present day observations of the
solar neighbourhood Quillen (2003). invoked the chaos caused by the
overlapping of the
![]() and the 4:1 resonance of the Galactic
spiral pattern to explain the chaos-dominated state of the local disc,
which, Quillen (2003) suggested, is responsible for the clumpy nature of f.
and the 4:1 resonance of the Galactic
spiral pattern to explain the chaos-dominated state of the local disc,
which, Quillen (2003) suggested, is responsible for the clumpy nature of f.
In spite of these investigations, the quantification of the degree of chaos in the solar vicinity has not been undertaken yet. This is of interest in interpreting the state of the local patch in the disc and extrapolating this notion to the understanding of the Galactic disc as a whole, as well as of outer discs in external spiral systems. The former of these motivations is set to get a boost in the near future, with the quantity and spatial cover promised in the data from the upcoming GAIA mission. Here we present a new technique for estimating the amount of chaos that is induced in the solar neighbourhood by the Galactic bar and spiral pattern. The different models used in Paper I will be analysed by the technique advanced in Sideris (2006). Thus, the aim of this paper is to evaluate the extent of chaos in the solar neighbourhood and examine the possible connection between the identified chaos and the local phase space structure.
This paper is organised as follows. The following section deals with the models, while in Sect. 3 the equations of motion are briefly discussed. The chaos quantification technique is advanced in Sect. 4 and the recovered results are presented herein. Section 5 is dedicated to a discussion of some aspects of the work. The paper is rounded off with the concluding remarks in Sect. 6.
As said before, we endeavour to infer the degree of chaos present in the vicinity of the Sun by gauging the chaoticity of the solar neighbourhood models that were presented in Paper I. Thus, the justification of the choice of the relevant parameters will not be repeated here; rather, it is the quantification of the inherent chaos in each of these models that is discussed below.
In Paper I, an annulus in the outer part of the Galactic disc was
modelled by test particle simulations, in which a warm exponential
disc was stirred by the bar or a spiral pattern alone, or by both
these perturbations jointly. In these simulations, the Galactic disc
is assumed to be ideal with the disc stars assumed to be drawn from a
4D phase space. A sample of phase space coordinates were chosen from a
model initial phase space distribution function (chosen to ensure an
exponential surface mass density profile and enough warmth to attain
the velocity dispersions and vertex deviation observed in the solar
neighbourhood today). These coordinates were allowed to evolve with
time in the presence of the potential of the disc and the
perturbation(s), i.e. the bar or (and) spiral. The bar was modelled as
a rigidly rotating quadrupole (see Eq. (1) in Paper I) with a
perturbation strength that is half the strength of the bar used in Fux
(2001). The spiral pattern is modelled as a logarithmic spiral that is
4-armed (Vallée 2002) and tightly wound (pitch angle of
15![]() ), as the model spiral pattern used by Johnston et al. (2001);
this choice of number of arms and a low pitch angle also ties in with
the suggestion of Bissantz et al. (2003); Melnik (2006); Vallée (2002); Englmaier & Gerhard (1999). The initial disc configuration is characterised by a
logarithmic potential to ensure flat rotation curve and a doubly-cut
out distribution function (Evans & Read 1998) that ensures an exponential
surface stellar mass density profile. This distribution function is
parametrised by a hotness parameter that is maintained high enough to
ensure the recovery of velocity dispersions and vertex deviation that
match with the observed values of these quantities in the solar
neighbourhood today.
), as the model spiral pattern used by Johnston et al. (2001);
this choice of number of arms and a low pitch angle also ties in with
the suggestion of Bissantz et al. (2003); Melnik (2006); Vallée (2002); Englmaier & Gerhard (1999). The initial disc configuration is characterised by a
logarithmic potential to ensure flat rotation curve and a doubly-cut
out distribution function (Evans & Read 1998) that ensures an exponential
surface stellar mass density profile. This distribution function is
parametrised by a hotness parameter that is maintained high enough to
ensure the recovery of velocity dispersions and vertex deviation that
match with the observed values of these quantities in the solar
neighbourhood today.
The orbits were recorded in the annulus between
![]() to
to
![]() ,
where
,
where
![]() is the corotation radius of the
bar;
is the corotation radius of the
bar;
![]() occurs at 1.7
occurs at 1.7
![]() for the above-mentioned choice
of the disc potential. In this work, all lengths are expressed in
units of
for the above-mentioned choice
of the disc potential. In this work, all lengths are expressed in
units of
![]() and given the scale-free nature of our disc
configuration, the physical value of
and given the scale-free nature of our disc
configuration, the physical value of
![]() is not relevant. An
important parameter that was varied to define the individual models is
the ratio between the pattern speeds of the bar (
is not relevant. An
important parameter that was varied to define the individual models is
the ratio between the pattern speeds of the bar (
![]() )
and the
4-armed spiral (
)
and the
4-armed spiral (
![]() ). In every other respect, the bar+spiral
models are similar to each other. The bar-only model is similar to the
bar+spiral models in every respect except that there is no
perturbation from the spiral in this model. The
spiral-only model on the other hand, excludes the effect of the bar. Thus, the 5 models used in Paper I are:
). In every other respect, the bar+spiral
models are similar to each other. The bar-only model is similar to the
bar+spiral models in every respect except that there is no
perturbation from the spiral in this model. The
spiral-only model on the other hand, excludes the effect of the bar. Thus, the 5 models used in Paper I are:
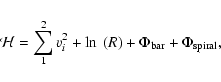
In this section, the stellar equations of motion are discussed. Below
is presented the Hamiltonian in an intertial frame, in galactocentric
coordinates xi, for i=1,2 and their conjugate momentum (or velocity
vi), given the logarithmic potential of the background disc
(![]()
![]() ,
where
,
where
![]() )
and the perturbations
due to the quadrupolar bar (
)
and the perturbations
due to the quadrupolar bar (
![]() )
and the logarithmic m = 4
spiral pattern (
)
and the logarithmic m = 4
spiral pattern (
![]() ).
).
 |
(1) |
Thus, in the inertial frame, the equations of motion are
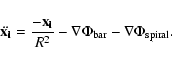 |
(3) |
 |
(4) |
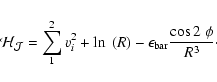
However, in the multiple pattern speed scenario, the Hamiltonian is no
longer the Jacobi integral; thus, when the spiral pattern is included
as the second perturbation, and the orbits recorded in the frame
rotating with the bar, the orbital energy is
![$\displaystyle {\cal{H_J}} = {\sum_1^2 v_i^2 +\ln~(R) -\epsilon_{\rm bar}\frac{\...
...a,m){\rm e}^{{\rm i}[m(\phi-{(\Omega_s-\Omega_b)}t\
)]}R^{i\alpha-\frac{1}{2}}.$](/articles/aa/full/2008/34/aa9316-07/img33.gif) |
(5) |
A chaotic orbit usually evolves in a divided phase space - a phase space which is characterised by both regular and chaotic regions (Contopoulos 2002; Sideris 2008). In such a regime, any chaotic orbit (provided it is integrated for long enough timescales) will experience two kinds of dynamical epochs: strong or wild chaos and weak or sticky chaos (Contopoulos 2002; Shirts & Reinhardt 1982). Strong chaos is associated with motion of the orbit far away from the regular islands. Such motion is completely unpredictable, and the chaotic orbit attempts to cover broad parts of the chaotic sea that is energetically available to it. When the orbit moves close to the regular islands it becomes trapped for a long time around them; in practice, it attempts to mimic regularity. The closer to a regular island the chaotic orbit moves the more persuasive is this mimicry.
The pattern method can identify when an orbit gets into weakly chaotic regimes. Semi-smooth curves correlating extrema of the signal of the orbit appear in that epoch of its evolution. The big advantage of the pattern method is that it treats orbits as sets of segments, piece by piece, and not as one monolithic entity as other measures typically do. This is how it achieves to distinguish parts of the orbit where weak chaos is experienced.
We applied this method to the orbits associated with the aforementioned simulations. For every simulation, a number of orbits corresponding to a given value of energy, were randomly extracted. This exercise was repeated in several different energy bands and the chaos quantification followed.
![\begin{figure}
\par\includegraphics[width=7cm,clip]{9316fig1.ps}
\end{figure}](/articles/aa/full/2008/34/aa9316-07/img35.gif) |
Figure 1: Poincaré section for the bar-only model, at the energy of -0.75. The white inner regions mark the part of x-vx space that is not populated by orbits for the specific implementation of our numerical experiment. The blue lines are invariant curves (i.e. curves representing the 4D regular orbits in the 2D Poincaré space). |
| Open with DEXTER | |
![\begin{figure}
\par\includegraphics[width=9cm,clip]{9316fig2.ps}
\end{figure}](/articles/aa/full/2008/34/aa9316-07/img36.gif) |
Figure 2: Surface of sections of orbits integrated in the model with a spiral to bar pattern speed ratio of 21/55. Red signifies strong chaos, green signifies weak chaos, and blue signifies regularity. Each panel represents a surface of section plot for a particular energy value; top left panel corresponds to J=-0.300, top right to -0.5, middle left to -0.75, middle right to -1.0, bottom left to -1.25, and bottom right to orbits corresponding to energy of -1.5. It is evident that chaos decreases as energy decreases. |
| Open with DEXTER | |
![\begin{figure}
\par\includegraphics[width=14cm,clip]{9316fig3.ps}
\end{figure}](/articles/aa/full/2008/34/aa9316-07/img37.gif) |
Figure 3: Fractions of chaotic orbits (in red), weakly chaotic orbits (in green) and regular orbits (in blue), plotted as functions of energy, for the three bar+spiral models 18/55 ( left), 21/55 ( middle), 25/55 ( right). |
| Open with DEXTER | |
For the bar only model for the six energies evolved (from -0.3 to -1.5) no chaos was found. In Fig. 1, we show a surface of section that is constructed for orbits characterised by an energy of -0.75. All the surfaces of sections presented herein are recorded for the orbits crossing the plane vy=0.
The results for six different energies for the ratio 21/55 can be seen in Fig. 2. Similar pictures hold true for models 18/55 and 25/55. In all three models it is obvious that chaos is very strong for high energies but reduces as energy decreases.
To compare the chaos inducing ability of the different models, the fraction of the regular and (strongly and weakly) chaotic orbits is shown in Fig. 3. These plots show the percentage of chaotic orbits appearing in the three models. One may notice that the case 21/55 is quantified as more chaotic than the other cases.
In Fig. 4 the chaos strength is plotted with respect to
the energy for the four models
![]() ,
21/55, 25/55
and the bar-only.
,
21/55, 25/55
and the bar-only.
Our chaos quantification technique helps shed light on the models. We
find that at the higher energies, the model that manifests the
highest chaos is the model that ensures resonance overlap (the 21/55
model). This is in line with our expectations of course, but it is
also interesting to note that the chaos induced by the other
bar+spiral models is not much less either. At the same time, from
Paper I, we know that all three of the bar+spiral models were
successful in explaining the observed structure of the local phase
space. This adds weight to the suggestion that chaos is
responsible for the clumps of the local velocity space. (Of course,
this is only part of the story, since scattering off the
![]() and
the effects of minor resonances of the bar and the spiral are also
important, as reported in Paper I).
and
the effects of minor resonances of the bar and the spiral are also
important, as reported in Paper I).
To understand the trends in our results, we need to invoke the
following:
![]() is an ``angular momentum emmitter''
(Lynden-Bell & Kalnajs 1972), the basic effect of which is to ``stir without
heating'' (Sellwood & Binney 2002). This idea that the
is an ``angular momentum emmitter''
(Lynden-Bell & Kalnajs 1972), the basic effect of which is to ``stir without
heating'' (Sellwood & Binney 2002). This idea that the
![]() is the
location from which stars are driven outwards, is corroborated by the
experiments of Chakrabarty (2004). Now in our modelling, we choose
to record our orbits in an annulus that extends from R=1.7
is the
location from which stars are driven outwards, is corroborated by the
experiments of Chakrabarty (2004). Now in our modelling, we choose
to record our orbits in an annulus that extends from R=1.7
![]() to 2.3
to 2.3
![]() ,
where
,
where
![]() is the corotation radius of the bar. Thus,
the occurrence of
is the corotation radius of the bar. Thus,
the occurrence of
![]() at R < 1.7
at R < 1.7
![]() (the 25/55 model)
implies that stars will be pushed into the relevant annulus from lower
radii than when
(the 25/55 model)
implies that stars will be pushed into the relevant annulus from lower
radii than when
![]() concurs with the physical location of
concurs with the physical location of
![]() .
In the case
.
In the case
![]() occurs at
occurs at
![]() ,
(the 18/55 model), a part of the annulus will be depleted at the cost
of the parts at radii around 2.3
,
(the 18/55 model), a part of the annulus will be depleted at the cost
of the parts at radii around 2.3
![]() .
Thus, for the 25/55 model,
more stars will be entering our annulus from lower energies than in
the other two models. Now, in a smooth, unperturbed background
potential, stars at lower radii are also more energetic than those at
higher radii. This implies that in the absence of resonances due to
imposed perturbations, there would have been more high-energy stars
recorded for the 25/55 case than in the 18/55 or 21/55 models.
.
Thus, for the 25/55 model,
more stars will be entering our annulus from lower energies than in
the other two models. Now, in a smooth, unperturbed background
potential, stars at lower radii are also more energetic than those at
higher radii. This implies that in the absence of resonances due to
imposed perturbations, there would have been more high-energy stars
recorded for the 25/55 case than in the 18/55 or 21/55 models.
![\begin{figure}
\par\includegraphics[width=7.5cm,clip]{9316fig4.ps}
\end{figure}](/articles/aa/full/2008/34/aa9316-07/img40.gif) |
Figure 4: Average strength of chaos against energy, for the four models 18/55, 21/55, 25/55 and bar only. Blue signifies the 18/55 model, red 21/55, cyan 25/55 and green the bar only model. |
| Open with DEXTER | |
This situation is of course challenged once the perturbations are introduced - in particular, proximity to resonance overlap indicates enhanced chaoticity in the recorded orbits. The relative excess in the energy of the recorded orbits, as implied by the 25/55 model is surpassed, more at higher energies than lower, by the strength of chaos that is a signature of the resonance overlap case. This explains the relative trends in chaos strength that is noticed in the different models (Fig. 4).
We conclude that the observed phase space structure in the solar
neighbourhood (particularly the splitting of the Hyades-Pleiades mode)
is, to a large extent, chaos induced. But this chaos does not
necessarily have to be triggered by resonance overlap (in
contradiction to what Quillen 2003 suggested). In fact, the presence
of chaos is found to be actuated by the spiral potential. We
say this since our results indicate that the bar potential alone
is insufficient in producing chaos. This contradicts the suggestion
by Fux (2001). The bar that was used in the modelling in Paper I (our
models) imposes a field of 3.6![]() of that of the background disc,
nearly half of what was used by Fux (2001). Thus, it may be argued
that it is this low a bar strength that was incapable of heating the
disc enough; after all, as shown in Chakrabarty (2004), disc heating
increases rapidly with increases in bar strength.
of that of the background disc,
nearly half of what was used by Fux (2001). Thus, it may be argued
that it is this low a bar strength that was incapable of heating the
disc enough; after all, as shown in Chakrabarty (2004), disc heating
increases rapidly with increases in bar strength.
In this work, we have presented an objective quantification of chaos that shows up in models of the local phase space. This work needs to be buttressed in the future with more sophisticated models that span all six phase space dimensions and account for the Galactic halo as well. This estimation and classification of orbits into strongly chaotic, weakly chaotic and regular, allows us to understand the local phase space in more detail than has been possible before. We implement this technique on models of the solar neighbourhood to conclude that all models that include the spiral pattern exhibit chaoticity and this nature of the local phase space is advanced as an important contributor to the formation of the observed phase space structure. We advance this technique as a blueprint for evaluating the degree of chaos present in kinematic samples that would be collated in the near future by GAIA.
Acknowledgements
DC is supported by a Royal Society Dorothy Hodgkin Fellowship. IVS is supported by the Tomalla Foundation.