![[*]](/icons/foot_motif.gif) ,
,
A&A 488, 117-131 (2008)
DOI: 10.1051/0004-6361:200809782
,E. Kutdemir1,2 - B. L. Ziegler3,1 - R. F. Peletier2 - C. Da Rocha3,1 - T. Kronberger4 - W. Kapferer4 - S. Schindler4 - A. Böhm5 - K. Jäger6 - H. Kuntschner7 - M. Verdugo1
1 - Institut für Astrophysik, Georg-August-Universität,
Friedrich-Hund-Platz 1, 37077 Göttingen, Germany
2 -
Kapteyn Astronomical Institute, PO BOX 800, 9700 AV Groningen,
The Netherlands
3 -
European-Southern Observatory, Karl-Schwarzschild Str. 2, 85748 Garching, Germany
4 -
Institut für Astro- und Teilchenphysik, Universität Innsbruck,
Technikerstrasse 25, 6020 Innsbruck, Austria
5 -
Astrophysikalisches Institut Potsdam, An der Sternwarte 16, 14482 Potsdam, Germany
6 -
Max-Planck-Institut für Astronomie, 69117 Heidelberg, Germany
7 -
ST-ECF, Karl-Schwarzschild Str. 2, 85748 Garching, Germany
Received 14 March 2008 / Accepted 20 June 2008
Abstract
Context. We continue our investigation on how the cluster environment affects the evolution of galaxies.
Aims. By examining both galaxy structure and internal kinematics of cluster galaxies at lookback times of  5 Gyr we study the nature and impact of possible interactions at the peak epoch of cluster assembly.
Methods. Going beyond our previous measurements of two-dimensional rotation curves, we here observe the whole velocity field of the galaxies of the sample. We achieve a complete coverage and optimal spatial sampling of galaxy sizes by placing three adjacent and parallel FORS2 MXU (Mask eXchange Unit) slits onto each object yielding simultaneously several emission and absorption lines. We reconstruct the gas velocity field and decompose it into circular rotation and irregular motions using a harmonic decomposition method called kinemetry. To measure the irregularity in the gas kinematics, we define 3 parameters:
 (the standard deviation of the kinematic position angle within a galaxy),
 (the average misalignment between kinematic and photometric position angles) and k3,5 (squared sum of the higher order Fourier terms).
Results. We present the analysis of the velocity fields and morphology of 22 distant galaxies in the MS 0451.6-0305 field with 11 members at z=0.54 and a local sample from SINGS. Using local, undistorted galaxies the three parameters
,
and k3,5 can be used to establish the regularity of the gas velocity fields. Among the galaxies for which we could measure these parameters, we find both field ones (4 of 8) and cluster members (3 of 4), which have a velocity field that we consider both irregular and asymmetric. We show that these fractions are underestimates of the total number of objects with irregular velocity fields. The values of the irregularity parameters for cluster galaxies are not very different from those of the field galaxies, implying that there are isolated field galaxies that are as distorted as the cluster members. None of the deviations in our small sample correlate with photometric/structural properties like luminosity or disk scale length in a significant way.
Conclusions. We have demonstrated that our 3D-spectroscopic method successfully maps the velocity field of distant galaxies. Together with a structural analysis the importance and efficiency of cluster specific interactions can be assessed quantitatively.
Key words: galaxies: evolution - galaxies: kinematics and dynamics - galaxies: clusters: individual: MS 0451.6-0305 - galaxies: spiral
The motion of stars and gas clouds within a galaxy are important measurable
characteristics representative of the whole system. Since the internal
kinematics are subject to the overall gravitational potential they provide a
proxy for the total mass. In addition to the baryonic mass of gas and stars,
that may be inferred from photometric observations, velocities trace the dark
matter distribution (e.g. Sofue & Rubin 2001). The (ir)regularity of its
3-dimensional velocity field can provide clues about possible distortions of a
galaxy, such as warps. Peculiar velocity fields may also be indicators of recent
or ongoing interaction processes. This is particularly important in the
environment of galaxy clusters, where specific interactions occur in addition to
merging and accretion events that are observed in the field population and that
are elements of the hierarchical growth of structure in the Universe
(e.g. Poggianti 2004; van Gorkom 2004). Cluster specific processes are presumably rather
frequent at redshifts
 ,
because the assembly of galaxy clusters is
expected to peak at these epochs under the conditions of the concordance
cosmology (e.g. Kay et al. 2007; Bower 1991). That is also the reason why fundamental
properties of galaxies at these redshifts are measured and compared to those of
local objects in order to explore galaxy formation and evolution.
,
because the assembly of galaxy clusters is
expected to peak at these epochs under the conditions of the concordance
cosmology (e.g. Kay et al. 2007; Bower 1991). That is also the reason why fundamental
properties of galaxies at these redshifts are measured and compared to those of
local objects in order to explore galaxy formation and evolution.
There are considerable advantages in using 3-dimensional spectroscopy over
conventional long-slit data. Apart from a better assessment of the interaction
origin of galaxies it also improves the accuracy of the establishment of
scaling relations. For example, an important tool to measure the cosmological
evolution of disk galaxies is the Tully-Fisher relation (TFR, Tully & Fisher 1977)
where the parameter next to the intrinsic luminosity is the maximum velocity
 of the flat part of the rotation curve. Only for very regular
Rotation Curves (RC's), where the turn-over and the flat part are clearly
visible,
can be derived with sufficient accuracy to include the
galaxy under scrutiny into a TF analysis. This is particularly important in the case
of distant, small and faint galaxies
(e.g. Böhm & Ziegler 2007; Böhm et al. 2004; Ziegler et al. 2002; Kassin et al. 2007; Bamford et al. 2006; Conselice et al. 2005). The assessment of RC quality may also be the main reason why recent studies of the cluster TFR
evolution differ from each other with respect to sign and amount of offset
between distant galaxies in the cluster and the field environment
(Bamford et al. 2005; Ziegler et al. 2003; Nakamura et al. 2005; Metevier et al. 2006).
of the flat part of the rotation curve. Only for very regular
Rotation Curves (RC's), where the turn-over and the flat part are clearly
visible,
can be derived with sufficient accuracy to include the
galaxy under scrutiny into a TF analysis. This is particularly important in the case
of distant, small and faint galaxies
(e.g. Böhm & Ziegler 2007; Böhm et al. 2004; Ziegler et al. 2002; Kassin et al. 2007; Bamford et al. 2006; Conselice et al. 2005). The assessment of RC quality may also be the main reason why recent studies of the cluster TFR
evolution differ from each other with respect to sign and amount of offset
between distant galaxies in the cluster and the field environment
(Bamford et al. 2005; Ziegler et al. 2003; Nakamura et al. 2005; Metevier et al. 2006).
Apparently smooth RCs can nevertheless result in wrong estimates of
,
if for example the position angle of the major axis, as measured from
the photometry, is not the same as the kinematic position angle. The same
holds if the photometric center does not agree with the center measured from
the kinematics. A way to resolve the situation is to obtain 3-dimensional
kinematical information. For example, Mendes de Oliveira et al. (2003) use velocity fields of
galaxies in compact groups obtained using Fabry-Pérot spectroscopy to
show that smooth RCs can be derived for most galaxies that were previously
judged to be distorted on the basis of the limited information given by
2D-spectra (Rubin et al. 1991). Alternatively, in some cases the rotation curve
along the photometric axis may look regular even though the velocity field
is distorted. Because of this, 3-dimensional information is clearly
preferable to long-slit data. It remains a requirement that the observed
velocity fields should cover the flat part of the rotation curve.
Several comprehensive studies of galaxies in the Local Universe exist that
explore velocity fields using optical observations. Fabry-Pérot
interferometry of the H emission line is the basis of the GHASP
(Garrido et al. 2005), SINGS (Daigle et al. 2006) and Virgo (Chemin et al. 2006) surveys, for
example. 3D-spectroscopy is regularly performed with the SAURON integral
field unit, delivering spectra within a limited wavelength range, with which
stellar absorption lines can be investigated in addition to gaseous emission
lines (e.g. Sarzi et al. 2006; Ganda et al. 2006; Falcón-Barroso et al. 2006). Integral-field
spectroscopy of HII regions in nearby disk galaxies was established, as another
example, with DensePak on the WIYN 3.5 m telescope (Andersen et al. 2006). While
spatially resolved H I measurements with radio telescopes are quite
common locally, (e.g. Noordermeer et al. 2007; Boomsma et al. 2005) such observations at higher
redshift are just becoming feasible with new instrumentation (e.g. EVLA, APEX).
emission line is the basis of the GHASP
(Garrido et al. 2005), SINGS (Daigle et al. 2006) and Virgo (Chemin et al. 2006) surveys, for
example. 3D-spectroscopy is regularly performed with the SAURON integral
field unit, delivering spectra within a limited wavelength range, with which
stellar absorption lines can be investigated in addition to gaseous emission
lines (e.g. Sarzi et al. 2006; Ganda et al. 2006; Falcón-Barroso et al. 2006). Integral-field
spectroscopy of HII regions in nearby disk galaxies was established, as another
example, with DensePak on the WIYN 3.5 m telescope (Andersen et al. 2006). While
spatially resolved H I measurements with radio telescopes are quite
common locally, (e.g. Noordermeer et al. 2007; Boomsma et al. 2005) such observations at higher
redshift are just becoming feasible with new instrumentation (e.g. EVLA, APEX).
At  ,
studies of the global velocity field of galaxies in the optical and
near-infrared regimes are also quite challenging. While in the NIR a high spatial
resolution can be achieved thanks to the combination of 3D-spectroscopy with
adaptive-optics techniques (Förster Schreiber et al. 2006), one is hampered by seeing effects in
the optical (Kronberger et al. 2007). One of the more comprehensive optical studies has made
use of the 15 deployable small IFUs (integral field units) of the FLAMES instrument
at the VLT. That way, 35 field galaxies at 0.4<z<0.7 were examined and
analyzed using the TFR (Flores et al. 2006). Eliminating the galaxies that have perturbed
or complex kinematics, they found no evolution in the Tully Fisher Relation since
z=0.6. Other investigations are restricted to a small number of objects. Using
the GMOS integral field spectrograph and exploiting the light magnification of a
foreground cluster, Swinbank et al. (2006) for example, probed the emission-line properties
of six z=1 field galaxies in the background. Investigating where these galaxies
lie on the B and I band TFR compared to local galaxies, they reported that in the
B-band the galaxies are brightened by 0.5
,
studies of the global velocity field of galaxies in the optical and
near-infrared regimes are also quite challenging. While in the NIR a high spatial
resolution can be achieved thanks to the combination of 3D-spectroscopy with
adaptive-optics techniques (Förster Schreiber et al. 2006), one is hampered by seeing effects in
the optical (Kronberger et al. 2007). One of the more comprehensive optical studies has made
use of the 15 deployable small IFUs (integral field units) of the FLAMES instrument
at the VLT. That way, 35 field galaxies at 0.4<z<0.7 were examined and
analyzed using the TFR (Flores et al. 2006). Eliminating the galaxies that have perturbed
or complex kinematics, they found no evolution in the Tully Fisher Relation since
z=0.6. Other investigations are restricted to a small number of objects. Using
the GMOS integral field spectrograph and exploiting the light magnification of a
foreground cluster, Swinbank et al. (2006) for example, probed the emission-line properties
of six z=1 field galaxies in the background. Investigating where these galaxies
lie on the B and I band TFR compared to local galaxies, they reported that in the
B-band the galaxies are brightened by 0.5  0.3 mag, while in the I band they are
in agreement with the local relation.
0.3 mag, while in the I band they are
in agreement with the local relation.
To determine the nature and efficiency of interaction processes in the cluster environment
we continue our study of galaxies at
 with new spectroscopy using FORS2 at
the VLT and HST/ACS imaging. Our project involves observations of four different cluster
fields (MS 0451.6-0305 at z=0.54, MS 1008.1-1224 at z=0.301, F1557.19TC at z=0.510,
MS 2137.3-2353 at z=0.313) with about 20 galaxies in each of them. While in our
previous campaigns we derived the internal kinematics along the photometric major axis of
the galaxies (Ziegler et al. 2003; Jäger et al. 2004) this time we measure the three-dimensional velocity
fields of the galaxies. We achieve this by placing three adjacent, parallel FORS2 MXU
(Mask eXchange Unit) slits onto the same galaxy. In HST Cycle 14 the clusters were
observed using the ACS camera (PID 10635), covering the full field-of-view of the
spectroscopy by a 2
with new spectroscopy using FORS2 at
the VLT and HST/ACS imaging. Our project involves observations of four different cluster
fields (MS 0451.6-0305 at z=0.54, MS 1008.1-1224 at z=0.301, F1557.19TC at z=0.510,
MS 2137.3-2353 at z=0.313) with about 20 galaxies in each of them. While in our
previous campaigns we derived the internal kinematics along the photometric major axis of
the galaxies (Ziegler et al. 2003; Jäger et al. 2004) this time we measure the three-dimensional velocity
fields of the galaxies. We achieve this by placing three adjacent, parallel FORS2 MXU
(Mask eXchange Unit) slits onto the same galaxy. In HST Cycle 14 the clusters were
observed using the ACS camera (PID 10635), covering the full field-of-view of the
spectroscopy by a 2  2 mosaic allowing a detailed morphological and structural
analysis of all target galaxies. In this paper, we present the results of our kinematic
and photometric analysis of the cluster MS 0451 at z=0.54 (Donahue 1996), classify the
galaxies according to the regularity of their gas kinematics and investigate whether this
is related to the environment (cluster/field) and some other properties like galaxy type,
luminosity, disk scale length, etc. In follow-up papers, similar data for the other three
clusters will be investigated. In addition, we will compare the kinematic and structural
analysis with hydrodynamic N-body simulations of both isolated (Kapferer et al. 2006) and
interacting galaxies (Kronberger et al. 2006). Using these simulations we already examined
systematically what is the effect of observational constraints like a low spatial sampling
in the case of distant small galaxies on the measured velocity fields (Kronberger et al. 2007). In
a final paper we will combine all our results to address the question of the interaction
history of cluster galaxies.
2 mosaic allowing a detailed morphological and structural
analysis of all target galaxies. In this paper, we present the results of our kinematic
and photometric analysis of the cluster MS 0451 at z=0.54 (Donahue 1996), classify the
galaxies according to the regularity of their gas kinematics and investigate whether this
is related to the environment (cluster/field) and some other properties like galaxy type,
luminosity, disk scale length, etc. In follow-up papers, similar data for the other three
clusters will be investigated. In addition, we will compare the kinematic and structural
analysis with hydrodynamic N-body simulations of both isolated (Kapferer et al. 2006) and
interacting galaxies (Kronberger et al. 2006). Using these simulations we already examined
systematically what is the effect of observational constraints like a low spatial sampling
in the case of distant small galaxies on the measured velocity fields (Kronberger et al. 2007). In
a final paper we will combine all our results to address the question of the interaction
history of cluster galaxies.
In Sect. 2, we outline our unique approach of ``matched IFU simulations'' using MXU
masks with the FORS2 spectrograph at the VLT and give an account of our spectral
reduction, explain how the velocity fields are constructed and describe the observed
sample in the field of MS 0451. Our kinematic analysis of the gas velocity fields and
how we measure the stellar kinematics are also explained in this section. In Sect. 3,
we describe how we derive structural parameters from HST images and luminosities in
different filters from ground-based photometry. In Sect. 4, we explain how we quantify
the deviations from regularity in the gas kinematics, present the results of that
analysis, make a comparison between the field and cluster galaxies and investigate the
existence of a relation between the kinematic regularity and some photometric
properties. In Sect. 5, we discuss our results. In Sect. 6 we summarize the paper and
draw our conclusions. In Appendix A, we discuss the effects of the spatial
resolution on our kinematical analysis. Kinematic and photometric information on
individual galaxies in the MS 0451 cluster field are given in Appendix B. Throughout
this paper we use a standard cosmology with: H0 = 70 km s-1 Mpc-1,
 ,
,
 (Tonry et al. 2003).
Our aim was to obtain spatially resolved emission line rotation curves for
galaxies with typical surface brightnesses of
 mag/
mag/
 .
This is feasible in a reasonable time only with large ground based telescopes.
The natural approach to observe 3D-velocity fields would be to use IFUs to achieve
some kind of 3D-spectroscopy. Inspecting the performance of all such instruments
available at the ESO-VLT, it turned out that none of them are optimally suited and
efficient for our purpose. One of the main goals of our study, although not of
the current paper, is to unambiguously determine the maximum rotation velocity
of galaxies with regular velocity fields. From our previous
campaigns, we knew that many spirals at
z=0.3-0.6 have rather large sizes with
the turn-over points of their RCs at radii around
.
This is feasible in a reasonable time only with large ground based telescopes.
The natural approach to observe 3D-velocity fields would be to use IFUs to achieve
some kind of 3D-spectroscopy. Inspecting the performance of all such instruments
available at the ESO-VLT, it turned out that none of them are optimally suited and
efficient for our purpose. One of the main goals of our study, although not of
the current paper, is to unambiguously determine the maximum rotation velocity
of galaxies with regular velocity fields. From our previous
campaigns, we knew that many spirals at
z=0.3-0.6 have rather large sizes with
the turn-over points of their RCs at radii around
 ,
corresponding to disk scale lengths of
,
corresponding to disk scale lengths of 
 on either side of the center
of the galaxies (see Ziegler et al. 2003, Fig. 1). Thus, the FLAMES/ARGUS field-of-view
in high-resolution mode (
on either side of the center
of the galaxies (see Ziegler et al. 2003, Fig. 1). Thus, the FLAMES/ARGUS field-of-view
in high-resolution mode (

 )
would just have been adequate,
but given the low throughput of the high-resolution spectrograph GIRAFFE, the
necessary exposure times would have been so high that even a full night would not
have been sufficient to observe just one galaxy. With the VIMOS IFU, still only 2
or 3 objects could have been observed per night due to the small field of view.
Suitable to some extent are only the 15 deployable IFUs of FLAMES, whose octagonal
lens array has a spatial coverage of
)
would just have been adequate,
but given the low throughput of the high-resolution spectrograph GIRAFFE, the
necessary exposure times would have been so high that even a full night would not
have been sufficient to observe just one galaxy. With the VIMOS IFU, still only 2
or 3 objects could have been observed per night due to the small field of view.
Suitable to some extent are only the 15 deployable IFUs of FLAMES, whose octagonal
lens array has a spatial coverage of

 .
This does
not probe the outer regions of rotation curves, which is vital for an accurate
determination of
.
Only extrapolation of the measurements from the
inner parts of the VF gives an estimate of
(see, e.g., Fig. 7
in Flores et al. 2006). No real way out is the possibility to use a mosaic of four
pointings per field, because then the necessary observing time would be too large.
.
This does
not probe the outer regions of rotation curves, which is vital for an accurate
determination of
.
Only extrapolation of the measurements from the
inner parts of the VF gives an estimate of
(see, e.g., Fig. 7
in Flores et al. 2006). No real way out is the possibility to use a mosaic of four
pointings per field, because then the necessary observing time would be too large.
For this reason and for other reasons stated below, we conceived a method to
``simulate IFUs'' that are exactly matched to our purpose using the FORS2 focal
reducer spectrograph. This instrument offers a mode (MXU) using custom-made slit
masks, in which slitlets can be rotated with respect to the y-axis of the CCD
(Schink et al. 2000). We designed three masks for each cluster field, so that each
object was subsequently covered by three different, but parallel slits of
 width. One slit was placed along the photometric major axis of a galaxy, the
other two were shifted by
along the minor axis on both sides of the
central slit, respectively (Fig. 1). This resulted in an appropriate
aperture of
width. One slit was placed along the photometric major axis of a galaxy, the
other two were shifted by
along the minor axis on both sides of the
central slit, respectively (Fig. 1). This resulted in an appropriate
aperture of
 for each target (the actual dimensions of
the slits along the major axes are much longer to retrieve the velocities at
larger distances from the center than
for each target (the actual dimensions of
the slits along the major axes are much longer to retrieve the velocities at
larger distances from the center than
 ,
in case there is still signal, and
to allow accurate sky subtraction). Although each cluster field must be observed
three times (with three different masks), this method is still very efficient due
to two reasons. First, the high-throughput VPH grisms of FORS2 provide the
necessary S/N in the spectra with an integration time of 2.5 h only, i.e. for
all three setups together 7.5 h would be needed (comparable/lower than
shutter-open times needed with FLAMES). Second, the multiplex capability of
designing many slits across the full field of FORS2 (
,
in case there is still signal, and
to allow accurate sky subtraction). Although each cluster field must be observed
three times (with three different masks), this method is still very efficient due
to two reasons. First, the high-throughput VPH grisms of FORS2 provide the
necessary S/N in the spectra with an integration time of 2.5 h only, i.e. for
all three setups together 7.5 h would be needed (comparable/lower than
shutter-open times needed with FLAMES). Second, the multiplex capability of
designing many slits across the full field of FORS2 (
 )
allows to observe simultaneously a rather high number of objects (in case of
MS 0451 there were 20 slits for 22 galaxies).
)
allows to observe simultaneously a rather high number of objects (in case of
MS 0451 there were 20 slits for 22 galaxies).
Our approach has several additional advantages: since the pixel scale of the
two FORS2 MIT-CCD chips is
 pixel, our spatial resolution of the
resulting velocity fields is very adequate for the investigated redshifts
(Fig. 2) and is in practise only limited by the seeing. An adequate
spectral resolution of
pixel, our spatial resolution of the
resulting velocity fields is very adequate for the investigated redshifts
(Fig. 2) and is in practise only limited by the seeing. An adequate
spectral resolution of
 is achieved by using the holographic
grism grism_600RI. The instrumental resolution we measure from the data is
is achieved by using the holographic
grism grism_600RI. The instrumental resolution we measure from the data is
 (FWHM) which corresponds to
 km s-1 at
 .
Here we are able to measure the velocities down to
.
Here we are able to measure the velocities down to  km s-1, i.e. the typical accuracy of our velocities is 12 km s-1. With this grism a rather large wavelength coverage was obtained, making it possible to simultaneously observe several emission lines, allowing independent determinations of the velocity field (VF), as well as many
absorption lines, that can be used to derive, for example, stellar rotation
curves (see Sect. 2.5). For the cluster members of MS 0451, we probe the
emission lines of [O II]3727, H
km s-1, i.e. the typical accuracy of our velocities is 12 km s-1. With this grism a rather large wavelength coverage was obtained, making it possible to simultaneously observe several emission lines, allowing independent determinations of the velocity field (VF), as well as many
absorption lines, that can be used to derive, for example, stellar rotation
curves (see Sect. 2.5). For the cluster members of MS 0451, we probe the
emission lines of [O II]3727, H ,
H
,
H ,
[O III]4959 and [O III]5007. Line ratios can then be used,
for example, to derive the gas-phase metallicities of the galaxies or to detect
possible contaminations from AGN. To summarize, our observational strategy
provides a matched aperture size, large target coverage and a wide range of
wavelength for efficiently low exposure times. Spatial sampling is sufficient (0
,
[O III]4959 and [O III]5007. Line ratios can then be used,
for example, to derive the gas-phase metallicities of the galaxies or to detect
possible contaminations from AGN. To summarize, our observational strategy
provides a matched aperture size, large target coverage and a wide range of
wavelength for efficiently low exposure times. Spatial sampling is sufficient (0
 25) along the spatial axis while it is 1
 along the spectral axis (Fig. 2).
Each cluster field was observed with three separate masks to be able to
place three parallel slits onto each galaxy; the central one along the
photometric major axis and the other two 1
offset along the
minor axis in opposite directions. For cosmic ray removal, the integration
time for each mask was split into three exposures. The observations for
MS 0451 were spread across 6 nights in January and February 2005. In the
case of one mask, all exposures were taken during the same night. For that
mask, all science frames were combined right after the overscan and bias
correction process, since the alignment of the frames was excellent. For
the rest, the order of the reduction steps was the following:
In this paper, we present the analysis of the cluster field of MS 0451 at z=0.54. Twenty-six galaxies in this cluster had already been spectroscopic targets in our previous campaigns, similar to the MOS observations described by Ziegler et al. (2003) and Jäger et al. (2004). In these previous runs, only one MXU slit was placed onto each galaxy, mostly along the photometric major axis as determined from (ground-based) FORS images (ESO PID 66.A-0547). Due to geometric constraints (mask setup) or when two objects were forced into the same slit other slit orientations were chosen. The results from this campaign will be presented in another paper of this series. Examples of four galaxies have already been given in Kronberger et al. (2006).
Since for these galaxies accurate redshifts and equivalent widths of visible emission
lines were available, they formed the primary candidate list for target selection for
our new study presented here. First priority was given to cluster members
with significant emission in [OII]3727, second priority to field galaxies
with a clear detection of any emission line that would fall onto our chosen observed
wavelength range. Note that no morphological information was used for the sample
selection. Further objects were drawn from a catalog provided by the CNOC survey
(Ellingson et al. 1998) with either redshift information or measured (g-r) color that
matches expectations for spiral templates at
.
If there was space in the
MXU setup, and no suitable candidate at all was available, a galaxy was picked at
random. In the end, we had defined 20 slits for 22 targets, of which ten had
spectroscopic information, six appropriate colors and six were just fillers. After
data reduction, the sample turned out to have eleven cluster members. Five galaxies
four of which are cluster members have no or very weak emission lines and are,
therefore, not suitable for a kinematic analysis of their gas velocity fields.
| ID | z | d | NED name | Type, Ref. | z, Ref. |
| (1) | (2) | (3) | (4) | (5) | (6) |
| C1 | 0.5421 | 1.7 | PPP 002414 | Sb-Sc (1) | 0.54160 (1) |
| Sab (2) | 0.54240 (2) | ||||
| C2 | 0.5486 | 0.7 | PPP 000802 | E (1) | 0.54956 (1) |
| C3 | 0.5465 | 0.7 | PPP 001123 | S (2) | 0.54747 (2) |
| C4 | 0.5324 | 0.9 | PPP 001795 | S (2) | 0.53345 (2) |
| C5 | 0.5312 | 1.1 | PPP 001787 | Sc-Irr (1) | 0.53156 (1) |
| S0 (2) | |||||
| C6 | 0.5305 | 1.1 | PPP 001802 | Sb-Sc (1) | 0.53094 (1) |
| S (2) | 0.53007 (2) | ||||
| C7 | 0.5277 | 0.8 | PPP 001696 | S (2) | 0.52700 (3) |
| C8 | 0.5325 | 0.7 | PPP 001482 | Sc-Irr (1) | 0.53257 (1) |
| S(2) | 0.53215 (2) | ||||
| C9 | 0.5246 | 0.5 | [SED2002] 111 | E/S0 (4) | 0.52420 (2) |
| Irr (2) | |||||
| C10 | 0.5312 | 0.8 | - | - | - |
| C11 | - | 0.1 | PPP 001264 | E (1) | 0.53070 (1) |
| F1 | 0.9009 | - | - | - | 0.90011 (2) |
| F2 | 0.5795 | - | PPP 001818 | Sb-Sc (1) | 0.57924 (1) |
| 0.57918 (2) | |||||
| F3 | 0.5667 | - | PPP 002130 | Sc-Irr (1) | 0.56686 (1) |
| S (2) | |||||
| F4 | 0.1867 | - | PPP 001358 | Sc-Irr (1) | 0.18727 (1) |
| S (2) | |||||
| F5 | 0.1573 | - | PPP 001403 | Irr (4) | 0.15679 (2) |
| S (2) | |||||
| F6 | 0.0982 | - | PPP 001542 | S (2) | 0.09809 (2) |
| F7 | - | - | - | Merger (2) | 0.91251 (2) |
| F8 | 0.4443 | - | PPP 001259 | Sc-Irr (1) | 0.44392 (1) |
| F9 | 0.3259 | - | PPP 000798 | - | 0.32561 (2) |
| F10 | 0.4947 | - | - | Irr (2) | 0.648 (2)(ph.) |
| F11 | - | - | PPP 001478 | - | 0.319 (2)(ph.) |
|
Column (1): object ID; Col. (2): redshift; Col. (3): the projected distance from the cluster center in Mpc; Col. (4): the name of the galaxy in Nasa Extragalactic Database (NED); Col. (5): the morphological type of the galaxy and its reference; Col. (6): redshift of the galaxy and its reference. Photometric redshifts are indicated with ``(ph.)''. References: (1): (Ellingson et al. 1998); (2): (Moran 2008); (3): (Moran et al. 2007b); (4): (Stanford et al. 2002). All galaxy names given in Col. 4 begin with ``MS 0451.6-0305:''. [SED2002]=Stanford+Eisenhardt+Dickinson. For C11, F7 and F11, we couldn't measure the redshifts using our data as explained in the text. The distance of C11 to the cluster center is calculated using its redshift from the literature. |
To each galaxy we assign a number and put a ``C'' or an ``F'' in front of it, indicating whether it is a cluster member or a field galaxy. In Table 1, we give their redshifts and for the cluster members we give the projected distance from the center, together with some information taken from the literature (morphological type and redshift). For C11, F7 and F11 we could not determine the redshift from our data. F8 and C11 were observed within the same slit. They are so close together that their spectra can not be distinguished. The redshift that is calculated using the emission lines in the composite spectrum is z=0.4443. Ellingson et al. (1998) shows that C11 is an elliptical cluster member and that the emission we measure comes from F8. In the spectra of F7 and F11, one strong emission line is visible and no other feature can be identified. In both cases, different possibilities for identification of the line rule out that these two galaxies are cluster members. Therefore they are flagged with an ``F'' showing that they are field galaxies. In Table 1 we give a redshift of galaxy F7 and F11 from Moran (2008). The redshift of galaxy F11 is photometric. Since photometric redshifts have big uncertainties, we do not use it in our analysis. All cluster members are within 2 Mpc from the center and most of them are closer than 1 Mpc, i.e. they are well inside one virial radius (or R200) of the cluster.
Our spectra cover the wavelength range 5000 Å 
 8000 Å. Several lines can be observed within this interval depending on the
redshift. In case of visible emission lines excited by different mechanisms we can
use them to investigate the physical state of different gas clouds. We checked
whether the kinematics derived from different lines are consistent with each other or
whether there are prominent discrepancies that may indicate ongoing or recent
interaction processes. If strong absorption lines are present, we also compare the
stellar rotation with the gas kinematics (see Sect. 2.5 and, e.g. Fig. 3).
8000 Å. Several lines can be observed within this interval depending on the
redshift. In case of visible emission lines excited by different mechanisms we can
use them to investigate the physical state of different gas clouds. We checked
whether the kinematics derived from different lines are consistent with each other or
whether there are prominent discrepancies that may indicate ongoing or recent
interaction processes. If strong absorption lines are present, we also compare the
stellar rotation with the gas kinematics (see Sect. 2.5 and, e.g. Fig. 3).
In case of cluster spirals, the visible emission lines are [OII]3727, H,
H,
[OIII]4959 and [OIII]5007, of which [OII]3727 is usually the strongest. The rotation
curves extracted along the central slit using prominent emission lines of a cluster member (C8) are shown together with its stellar rotation curve in Fig. 3. The redshift
range of field galaxies is
 .
For the highest redshift in this range, the
only visible line in the spectrum is [OII]3727 doublet while for small redshifts several
lines are visible. For example the emission lines covered in the spectrum of F5 at
z=0.1573 are H,
H,
[OIII]4959, [OIII]5007, OI, H,
[NII]6583,
[SII]6716 and [SII]6730. There are three foreground galaxies for which the H line is
visible (F4, F5 and F6) and it is the strongest line in all cases. In Fig. 4 we show
the rotation curves extracted along the central slit using the prominent lines of F5.
.
For the highest redshift in this range, the
only visible line in the spectrum is [OII]3727 doublet while for small redshifts several
lines are visible. For example the emission lines covered in the spectrum of F5 at
z=0.1573 are H,
H,
[OIII]4959, [OIII]5007, OI, H,
[NII]6583,
[SII]6716 and [SII]6730. There are three foreground galaxies for which the H line is
visible (F4, F5 and F6) and it is the strongest line in all cases. In Fig. 4 we show
the rotation curves extracted along the central slit using the prominent lines of F5.
In the Appendix, we give some information about each galaxy. In case the galaxy has emission, we present:
The redshifts were calculated using all visible emission lines and a few prominent absorption lines in the integrated 1D-spectra of the central slit. Then, for each galaxy and for each emission line, the photometric center of the galaxy was determined by fitting a Gaussian to the continuum light distribution in the spatial direction averaged over 160 Å excluding the emission line itself. For each emission line separately, line centers and widths were measured along the spatial axis by Gaussian fits row by row, after the underlying continuum had been subtracted. The measurements were done by starting at the photometric center and continuing outwards on both sides. In regions of low signal, rows were first binned until a minimum flux in the emission line was reached. This means that in the outer regions of a galaxy, not every pixel of the grid shown in Fig. 2 corresponds to an independent data point for the velocity field (Fig. 5, top left). Finally, rotation curves were constructed. This was done for the spectra at all three positions (Fig. 5, bottom row).
![\begin{figure}
\par\includegraphics[width=17cm,clip]{9782fg05} \end{figure}](/articles/aa/full/2008/34/aa09782-08/img55.gif) |
Figure 5:
Top left: pixel map of the galaxy in Fig. 2 (galaxy C8),
based on [O II]3727 emission line measurements. In case that the
pixels are binned, the flux weighted position is indicated with a red/blue
line on the map. The intersection between the pixel rows is caused by the
spatial offsets between the masks mentioned in Sect. 2.3. Velocities are
given in km s-1. Top right: the velocity map visualizing the data on
the left. Velocities are interpolated linearly. Bottom left: rotation curve extracted along the slit
below the central one. Bottom middle: rotation curve extracted along the central slit. Bottom right: rotation curve extracted along the
slit
above the central one. |
To construct the 3D-velocity fields from the three rotation curves,
all measurements were transformed to a common coordinate system defined by (the
continuum center of) the central slit. The spatial offsets of the three masks
relative to each other were determined using spectra of stars observed with 2 slits oriented perpendicular to each other so that the shift along both x and y axes could be determined. Because of the shift, the slit offsets along the
minor axis of the galaxies between the three setups were not exactly
as intended, leading to a slightly different coverage of each
galaxy from the ideal version of the grid shown in Fig. 2. The maximum
absolute difference that we measured between the position of each mask is
1.5 pixels. Taking this into account, the observed velocity map was
constructed using linear interpolation (Fig. 5, top right). We also
made emission line strength maps (see the Appendix). Here we will explain how
we analyzed the velocity maps, and we derived parameters such as kinematic
position angle ( )
and kinematic inclination (i) (Fathi et al. 2005).
)
and kinematic inclination (i) (Fathi et al. 2005).
To analyze the velocity fields, we used the kinemetry package of
Krajnovic et al. (2006) that was extensively tested and used for SAURON IFU observations
of local galaxies. For a rotating disk the line of sight velocity is given by:
 is the observed line of sight velocity,
 is the systemic
velocity,
is the systemic
velocity,
 is the circular velocity and (
 )
are polar coordinates
in the plane of the galaxy with
)
are polar coordinates
in the plane of the galaxy with  measured from the apparent major axis.
According to Eq. (1), the observed velocity along a certain orbit can be
expressed as a simple cosine form when plotted versus azimuthal angle. In general,
since the motion of gas in galaxies can often be explained by rotation plus a smaller
perturbation, one can generalise Eq. (1) to
measured from the apparent major axis.
According to Eq. (1), the observed velocity along a certain orbit can be
expressed as a simple cosine form when plotted versus azimuthal angle. In general,
since the motion of gas in galaxies can often be explained by rotation plus a smaller
perturbation, one can generalise Eq. (1) to
![\begin{figure}
\par\includegraphics[width=17.1cm,clip]{9782fg06} \end{figure}](/articles/aa/full/2008/34/aa09782-08/img65.gif) |
Figure 6:
Top left: reconstructed velocity field of the galaxy in
Fig. 2 (galaxy C8) constructed using 6 harmonic terms of the
Fourier analysis performed by kinemetry. Top right: residual of the observed velocity map and the reconstructed map given on the left. Middle: kinematic position angle
and flattening q as a function of distance to the kinematic center.
Bottom left: velocity field of the best fitting rotating
disk (
 )
constructed fixing the position angle and flattening q to their global values. Bottom right: residual of the observed velocity map and the rotating disk velocity field given on the left. )
constructed fixing the position angle and flattening q to their global values. Bottom right: residual of the observed velocity map and the rotating disk velocity field given on the left. |
For an infinitesimally thin disk the flattening of the isovelocity contours is
related to the inclination by
 .
For every galaxy we determined
a global position angle and inclination by taking the median of the values at
several radii outside half the FWHM (full width at half maximum) of the seeing. In
Fig. 7 we show, for a field galaxy in our sample, the comparison between
the rotation curves extracted along the central slit and along the
kinematic major axis. This reveals a very important advantage of measuring the
full velocity field instead of just one rotation curve. The rotation
curve along the kinematic major axis clearly reaches a higher value of
than the photometric major axis rotation curve, which is mostly
used for the Tully-Fisher analysis.
.
For every galaxy we determined
a global position angle and inclination by taking the median of the values at
several radii outside half the FWHM (full width at half maximum) of the seeing. In
Fig. 7 we show, for a field galaxy in our sample, the comparison between
the rotation curves extracted along the central slit and along the
kinematic major axis. This reveals a very important advantage of measuring the
full velocity field instead of just one rotation curve. The rotation
curve along the kinematic major axis clearly reaches a higher value of
than the photometric major axis rotation curve, which is mostly
used for the Tully-Fisher analysis.
![\begin{figure}
\par\includegraphics[width=7.6cm,clip]{9782fg07} \end{figure}](/articles/aa/full/2008/34/aa09782-08/img67.gif) |
Figure 7:
Rotation curves of a field galaxy at z=0.5667 (galaxy F3) extracted along the central slit which is 3 misaligned w.r.t. the photometric major axis, and the kinematic major axis.
 |
To determine the deviations from simple rotation, we repeated the Fourier analysis
of the velocity maps fixing the position angle and the inclination of the orbits
to these global values. By subtracting the model of a regular rotation disk
 from the observed velocity field, non-circular motions and perturbations can
be seen in the residual image (Fig. 6). We can quantify them using
the Fourier terms An and Bn. We use the amplitude of the
from the observed velocity field, non-circular motions and perturbations can
be seen in the residual image (Fig. 6). We can quantify them using
the Fourier terms An and Bn. We use the amplitude of the  order
Fourier term, defined in Krajnovic et al. (2006):
order
Fourier term, defined in Krajnovic et al. (2006):
In addition to the analysis of the gas velocity fields, we can also investigate the kinematics of the stellar component, if absorption lines are present in the galaxy spectra with sufficient S/N. This prerequisite is mostly fulfilled only for the central slit spectrum, where the surface brightness is large enough. In these cases, we determine the stellar rotation and velocity dispersion from several strong absorption lines using the pPXF software (Cappellari & Emsellem 2004). This program fits different linear combinations of stellar templates to a wavelength region in pixel space. As templates, we use SSP (Single age and metallicity Stellar Population) models created with the MILES library (Sánchez-Blázquez et al. 2006). In Fig. 3, we compare, as an example, the gas and stellar rotation curves of a cluster member, both extracted along the central slit.
In our sample, there are 6 galaxies for which we could extract the stellar rotation curve. For those, we have compared the rotation of stars and gas (see Appendix, Figs. B.1b, B.3b-B.6b, B.9b). In the case of galaxy C8 and F2 they show a similar behaviour. For galaxy C5 and galaxy C9, there is a discrepancy between the two
curves. Galaxy C5 is interacting with its companion (Fig. B.3).
Galaxy C9 has a big misalignment between its kinematic and photometric axes. It
appears that the gas component in both galaxies is disturbed. In case of galaxy C7, which has an irregular gas velocity field, while the H
and H rotation curves do not show a big discrepancy with the stellar one, the [O II]3727 curve does show a somewhat larger discrepancy. Galaxy C1 has very weak [O II]3727 emission, so a comparison in this case would not give reliable information.
In all cases, the stellar rotation curve is regular. The cross sections for gas clouds in
spiral disks are large enough that disturbances in the gas velocities are triggered rather
easily, whereas stellar orbits are collisionless (Sarzi et al. 2006). Therefore, gas
velocity fields are expected to be more distorted and richly structured than their stellar
counterparts (e.g. Dumas et al. 2007). However, comparing with local spiral galaxies
(see Falcón-Barroso et al. 2006) one sees that in the inner regions of galaxies such discrepancies
between stars and gas are rare in the local Universe. For the local cluster members, the
situation might be different. From H morphologies of galaxies in the Virgo cluster
Koopmann & Kenney (2004) find that about half of their Virgo spiral galaxies have truncated H disks, while several spiral galaxies have asymmetric H enhancements at the outer edge
of their disks, and at least two highly inclined spiral galaxies have extraplanar
concentrations of H II regions. Chemin et al. (2006) investigated H velocity fields
of local cluster spirals, and showed that they exhibit typical kinematical perturbations like
streaming motions along spiral arms, twist of the major axis, Z shape of velocities due to
the presence of a bar, decoupled nuclear spiral or misalignment between photometric and
kinematic major axes. In general, however, these perturbations are minor: for most galaxies
the kinematics of the gas can be considered a perturbation to the stellar kinematics.
To study the photometry of our galaxies we used data from the HST and ground-based
telescopes. To determine luminosities and colours of our target galaxies we make
use of photometry obtained at ground-based telescopes. For the cluster MS 0451,
we have taken direct images with FORS2 at the VLT (ESO PID 66.A-0547). Frames in
the V,  and
and  filters were reduced in the standard manner (bias and
flatfield correction, registering, astrometric calibration using IRAF tasks) and combined to
yield total exposure times of 3300, 1800 and 2400 s, respectively. Photometric
calibration was achieved via standard stars from Landolt (1992). For
determination of colours, the final combined V, R and I images were convolved
with a 2D-Gaussian filter to a common seeing of
filters were reduced in the standard manner (bias and
flatfield correction, registering, astrometric calibration using IRAF tasks) and combined to
yield total exposure times of 3300, 1800 and 2400 s, respectively. Photometric
calibration was achieved via standard stars from Landolt (1992). For
determination of colours, the final combined V, R and I images were convolved
with a 2D-Gaussian filter to a common seeing of
 .
Photometry was
performed using the SExtractor package (Bertin & Arnouts 1996). While MAG_BEST
magnitudes are taken as total magnitudes, apertures with diameter
.
Photometry was
performed using the SExtractor package (Bertin & Arnouts 1996). While MAG_BEST
magnitudes are taken as total magnitudes, apertures with diameter
 were
used to compute colours. All magnitudes were corrected for Galactic extinction by
AV=0.110, AR=0.088 and AI=0.064 given for the cluster coordinates in NED
(NASA/IPAC Extragalactic Database), which are based on
E(B-V) = 0.033(Schlegel et al. 1998). The three filter magnitudes were transformed to rest-frame
Johnson-B using the k-correction algorithm by Blanton & Roweis (2007). The absolute total
luminosities of the galaxies are the second parameter entering the Tully-Fisher
relation. All derived magnitudes of the objects for which we have spectra are
listed in Table C.1. The tabulated MB magnitudes of the spiral
galaxies are not corrected for internal dust (inclination).
were
used to compute colours. All magnitudes were corrected for Galactic extinction by
AV=0.110, AR=0.088 and AI=0.064 given for the cluster coordinates in NED
(NASA/IPAC Extragalactic Database), which are based on
E(B-V) = 0.033(Schlegel et al. 1998). The three filter magnitudes were transformed to rest-frame
Johnson-B using the k-correction algorithm by Blanton & Roweis (2007). The absolute total
luminosities of the galaxies are the second parameter entering the Tully-Fisher
relation. All derived magnitudes of the objects for which we have spectra are
listed in Table C.1. The tabulated MB magnitudes of the spiral
galaxies are not corrected for internal dust (inclination).
For the cluster MS 0451 presented here, we exploit existing imaging in the ACS/F814Wfilter from the ST-ECF archive. We basically used the pipeline reduced images but with an additional cosmic ray rejection routine.
Structural parameters of the galaxy disks such as scale length, inclination, ellipticity and position angle were determined by decomposing the 3D-surface brightness distribution of the target objects into an exponential disk and a Sérsic bulge using the GALFIT algorithm (Peng et al. 2002) (Table C.2).
The model-subtracted residual images reveal additional structural features like spiral arms (Fig. 8) and bars, or signatures of ongoing or recent interaction processes such as tidal tails that can be compared to the kinematic tracers.
![\begin{figure}
\par\includegraphics[width=8.3cm,clip]{9782fg08} \end{figure}](/articles/aa/full/2008/34/aa09782-08/img76.gif) |
Figure 8: Left: the HST-ACS I band image of a cluster member (Galaxy C2). Right: the residual of the exponential disk + Sérsic bulge fit. |
To further investigate the structure of these galaxies we also determined the
asymmetry and concentration index of the galaxies (e.g. Abraham et al. 1994). To
calculate the concentration parameter, we use the ellipticity, position angle and
central coordinates (derived with SExtractor on the second order moments of the
images) to define an elliptical area that includes all the flux above  of
the sky level and an elliptical area for which the semi-major axis is 30% of the
outer one (Eq. (6)).
of
the sky level and an elliptical area for which the semi-major axis is 30% of the
outer one (Eq. (6)).
 sky level. A 3
3 grid was defined around the
initial center to search for the coordinates that give the smallest asymmetry.
The distance from the central point to the eight surrounding points was set to
0
1. The grid was reconstructed around the coordinates that gave the
smallest asymmetry in the previous grid. That was done until the smallest value
was measured at the center. Similarly, the asymmetry of a blank region was
calculated in the sky subtracted image using the same elliptical mask that was
used for the galaxy. To correct for the contribution of the noise, this ``blank
asymmetry'' was then subtracted from the asymmetry of the galaxy:
sky level. A 3
3 grid was defined around the
initial center to search for the coordinates that give the smallest asymmetry.
The distance from the central point to the eight surrounding points was set to
0
1. The grid was reconstructed around the coordinates that gave the
smallest asymmetry in the previous grid. That was done until the smallest value
was measured at the center. Similarly, the asymmetry of a blank region was
calculated in the sky subtracted image using the same elliptical mask that was
used for the galaxy. To correct for the contribution of the noise, this ``blank
asymmetry'' was then subtracted from the asymmetry of the galaxy:
![\begin{figure}
\par\includegraphics[width=8cm,clip]{9782fg09} \end{figure}](/articles/aa/full/2008/34/aa09782-08/img81.gif) |
Figure 9: Distribution of our galaxies in the A-C plane. Symbols are used to indicate morphologies of these galaxies. The references for this information are given in Table 1. In case inconsistent morphology information was given in different references, we used the morphologies from Moran (2008). The dashed lines are the selection limits taken from Menanteau et al. (2006). |
Here we want to classify our galaxies using a number of parameters that are
expected to be good indicators of the irregularity of velocity
fields:
k3,5/k1,
and
.
The deviation from
simple rotation was measured using the
k3,5/k1 parameter, described in
Sect. 2.4. It is the squared sum of the higher order Fourier terms (normalized
by the rotation velocity) obtained for a fit with a fixed position angle and
ellipticity. For each galaxy we obtained an average
k3,5/k1 value.
is the standard deviation of the
kinematic position angle within a galaxy and
is the absolute value
of the average difference between the kinematic and photometric position angle at
several radii. The radial extent over which these parameters have been calculated
depends on the distance of the galaxy, its surface brightness and its ionized gas
contents. Since not at every radius enough gas is present we could not fit the
velocity fields at all radii for all galaxies. The maximum radius for which we
could measure these parameters for each galaxy (
 )
is given in Table 2.
,
and
k3,5/k1 are calculated
between
)
is given in Table 2.
,
and
k3,5/k1 are calculated
between
 and the
(Table 2). The errors in these
parameters are the variance of the parameters in the range of the observations.
and the
(Table 2). The errors in these
parameters are the variance of the parameters in the range of the observations.
| ID |
|
|
|
k3,5/k1 |
| (1) | (2) | (3) | (4) | (5) |
| C7 | 13.8 | 23 | 68
26 |
0.32
0.20 |
| C8 | 20.9 | 2 | 9
6 |
0.06
0.05 |
| C9 | 9.2 | 19 | 66
20 |
0.10
0.03 |
| C10 | 11.7 | 9 | 14
9 |
0.26
0.08 |
| F2 | 10.5 | 2 | 35
37 |
0.08
0.02 |
| F3 | 10.0 | 7 | 39
9 |
0.07
0.05 |
| F4 | 5.5 | 21 | 18
20 |
0.30
0.19 |
| F5 | 11.3 | 5 | 46
9 |
0.08
0.03 |
| F6 | 4.4 | 29 | 57
44 |
0.27
0.18 |
| F7 | 14.1 | 3 | 0
11 |
0.05
0.02 |
| F10 | 8.4 | 8 | 1
7 |
0.25
0.05 |
| F11 | 1
7 |
5 | 18
5 |
0.05
0.02 |
|
Column (1): object ID; Col. (2): maximum radius for which kinematic parameters could be calculated. The conversion from arcsecond into kpc was done as explained in Wright (2006); Col. (3): standard deviation of the kinematic position angle (
); Col. (4): mean misalignment between the kinematic and photometric position angles (
); Col. (5): mean
k3,5/k1 of the analysis done while fixing the position angle and the ellipticity to their global values. For galaxy F11, only the photometric redshift is available. Since photometric redshifts have big uncertainties, we give
of this galaxy in
arcseconds.
k3,5/k1 of galaxy F5,
of the galaxies that
have
 (galaxy F2) and all parameters for galaxy F10 are
rather meaningless as explained in Sect. 4.1. Therefore they are
excluded from the analysis.
(galaxy F2) and all parameters for galaxy F10 are
rather meaningless as explained in Sect. 4.1. Therefore they are
excluded from the analysis.
|
In Fig. 10, we show how the galaxies are distributed in the parameter space
of
k3,5/k1,
and
.
To be able to decide whether these velocity fields are regular we should determine a regularity treshold for each parameter. To do that, we measured the parameters for the H velocity fields of the SINGS local sample
(Daigle et al. 2006) in which most galaxies have regular kinematics. Among the
velocity fields we were provided with (all but NGC 925, NGC 2403, UGC 5423, NGC 3198,
NGC 4321, NGC 6946) we excluded from the analysis the galaxies that have magnitudes
which are very different from the ones in our sample (m81dwb, NGC 2915) and the
velocity fields that are very noisy (IC 4710 and NGC 5398). For every galaxy we ran
kinemetry to determine the parameters
k3,5/k1,
and
.
To be able to calculate
,
the photometric position
angle should be known as a function of radius. To measure that, we used the red
Palomar DSS images (6450 Å), apart from NGC 3521, NGC 3621 and NGC 5713, for which
we used blue UK-Schmidt images (4680 Å), also from the DSS. All parameters are
given in Table 3. It is pointed out in Daigle et al. (2006), Table 1 that
some of these galaxies are peculiar. These galaxies are indicated next to their ID
in Table 3. We plotted the parameters against each other for both the
local sample and our sample together in Fig. 11. Using the location of the
local galaxies that are not peculiar and do not belong to the Virgo cluster, we
defined a limit for each parameter below which we call the gas kinematics
``regular''. These regularity criteria are:
 ,
,
 and
and
 .
.
| ID |
|
|
k3,5/k1 |
| (1) | (2) | (3) | (4) |
| NGC 0628 | 18 | 9
35 |
0.12
0.04 |
| NGC 2976 (pec) | 6 | 3
17 |
0.08
0.03 |
| NGC 3031 | 19 | 2
19 |
0.14
0.08 |
| NGC 3049 | 20 | 18
20 |
0.11
0.07 |
| NGC 3184 | 7 | 21
57 |
0.12
0.06 |
| NGC 3521 | 2 | 3
3 |
0.05
0.03 |
| NGC 3621 | 2 | 5
20 |
0.05
0.02 |
| NGC 3938 | 4 | 11
25 |
0.09
0.04 |
| NGC 4236 | 5 | 11
5 |
0.07
0.02 |
| NGC 4536 | 5 | 4
13 |
0.07
0.03 |
| NGC 4569 (Virgo) | 10 | 19
11 |
0.06
0.02 |
| NGC 4579 (Virgo) | 10 | 36
16 |
0.17
0.10 |
| NGC 4625 (pec) | 6 | 57
52 |
0.12
0.06 |
| NGC 4725 (pec) | 12 | 30
28 |
0.11
0.06 |
| NGC 5055 | 3 | 4
4 |
0.03
0.02 |
| NGC 5194 (pec) | 5 | 49
43 |
0.05
0.02 |
| NGC 5713 (pec) | 8 | 54
54 |
0.06
0.02 |
| NGC 7331 | 6 | 9
11 |
0.10
0.04 |
|
Column (1): object ID; Col. (2): standard deviation of the kinematic position angle (
); Col. (3): mean misalignment between the kinematic and photometric position angles (
); Col. (4): mean
k3,5/k1 of the analysis done
while fixing the position angle and the ellipticity to their global values. Peculiar galaxies and members of Virgo Cluster are indicated on the first column with ``(pec)/(Virgo)'' next to their name.
of the galaxies that have
(NGC 628,
NGC 3184, NGC 3938, NGC 5713) have large errors as explained
in Sect. 4.1, and are therefore excluded from the analysis.
|
![\begin{figure}
\par\includegraphics[width=8cm,clip]{9782fg11} \end{figure}](/articles/aa/full/2008/34/aa09782-08/img88.gif) |
Figure 11:
The same plots as in Fig. 10, now together with the local sample.
The boundaries inside which we call the gas kinematics regular are indicated with dashed lines
for each parameter. The galaxies that are indicated
with # symbol are the galaxies for which the
is doubtful as
explained in Sect. 4.1. Their
measurements are excluded form the analysis. |
To check whether the 3 parameters
k3,5/k1,
and
are indicators of the same phenomena, and correlate with each other, we calculated
the uncertainty weighted linear Pearson correlations separately for the two
samples. The correlation coefficients for each relation are given in the first two
rows of Table 4.
and
k3,5/k1 seem to correlate with
each other while the correlation between
and
holds only
for the higher redshift sample and the correlation between
and
k3,5/k1 holds only for the local sample. We will discuss this result in
more detail in Sect. 5.
We compared the distributions of
k3,5/k1,
and
for the local and higher redshift galaxies (Fig. 12). While some galaxies
in our sample have
k3,5/k1 values that are far above the region where the
local galaxies are distributed, this is not the case for the
and
parameters. Galaxies in both samples are distributed within similar
ranges.
of galaxy F6 in our sample is  above the highest
value among the local galaxies. This galaxy has a kinematically decoupled core and
that causes the
to be large. All local galaxies that have a large
value are either peculiar or a member of the Virgo Cluster.
above the highest
value among the local galaxies. This galaxy has a kinematically decoupled core and
that causes the
to be large. All local galaxies that have a large
value are either peculiar or a member of the Virgo Cluster.
Using the distributions for the cluster and field galaxies in our sample
(Fig. 12), we investigate the effect of the environment on the gas kinematics.
All 4 cluster galaxies are distributed in a similar range as the field galaxies. The
fraction of galaxies that have irregular gas kinematics in the whole sample, among the
field and cluster galaxies separately, is given in Table 5. Without
distinguishing between different criteria we find that 75
22% of the cluster
members, 50
18% of the field galaxies and 58
14% of the whole sample have
irregular gas kinematics. These numbers are underestimates because the spatial resolution
of the
observations is low. In Appendix A we show that the fractions
given above are lower limits to the real number of irregular galaxies.
We now checked whether there is a correlation between the irregularity in the gas kinematics
and some other parameters derived from the photometry: the absolute B magnitude, disk scale
length, asymmetry and concentration index (see Sect. 3.2). We did this for our sample and
the local sample separately. For the local sample, we do not have all these parameters, so we
give the correlations only for the absolute magnitude in the B band (MB) and the disk
scale length. We calculated their disk scale length assuming  0.25 R25(R25 values are taken from Daigle et al. 2006). We find a correlation between MBand
k3,5/k1 only for our sample (Fig. 13). The distribution of the local
sample galaxies in the plot is showing that galaxies with very different MB values can
have very similar
k3,5/k1 parameters. This correlation is therefore most probably
spurious.
0.25 R25(R25 values are taken from Daigle et al. 2006). We find a correlation between MBand
k3,5/k1 only for our sample (Fig. 13). The distribution of the local
sample galaxies in the plot is showing that galaxies with very different MB values can
have very similar
k3,5/k1 parameters. This correlation is therefore most probably
spurious.
We do not find a correlation between the irregularity in the gas kinematics and either the concentration index C, which is an indicator of the morphological type of the galaxy, or the photometric asymmetry (Table 4).
We have investigated whether the irregularity in the gas kinematics of the galaxy
correlates with its ionized gas contents. This is calculated by measuring the
integrated emission line flux and correcting it for the distance of the galaxy
(multiplying it by d2). Since the redshift interval of the sample is large
(
)
we do not have the same lines for every galaxy. The strongest
emission line that we have for all cluster galaxies is [OII]3727. Using the mean
emission line flux ratios derived from our spectra (H
![$\alpha / [{\rm OII}]3727=6.60$](/articles/aa/full/2008/34/aa09782-08/img92.gif) ,
H
,
H
![$\beta / [{\rm OII}]3727=0.82$](/articles/aa/full/2008/34/aa09782-08/img93.gif) ,
,
![$[{\rm OIII}]5007 / [{\rm OII}]3727=1.77$](/articles/aa/full/2008/34/aa09782-08/img94.gif) ), we calibrated the flux
from other lines to the [OII]3727 flux. The emission line that was used for each
galaxy is given in Table 6. We then normalized the ionized gas fluxes
to the value of galaxy F7, which has the highest flux (Table 6). The
correlation coefficients of the relations between the amount of gas (
), we calibrated the flux
from other lines to the [OII]3727 flux. The emission line that was used for each
galaxy is given in Table 6. We then normalized the ionized gas fluxes
to the value of galaxy F7, which has the highest flux (Table 6). The
correlation coefficients of the relations between the amount of gas (
 )
and the
irregularity in the gas kinematics are given in Table 4.
and
k3,5/k1 have an anti-correlation with
.
These parameters are
plotted against each other in Fig. 13.
)
and the
irregularity in the gas kinematics are given in Table 4.
and
k3,5/k1 have an anti-correlation with
.
These parameters are
plotted against each other in Fig. 13.
Using the concentration index, we find no correlation between the galaxy type and
the irregularity in the gas kinematics. The amount of gas per unit luminosity is
also an indicator of the galaxy type such that later type spirals have more gas and
they are less luminous. We find an anti-correlation between this parameter and
both
and
(Table 4, Fig. 13). In all correlations
with
and
 ,
one sees that the galaxies with large emission line fluxes
generally have very regular velocity fields (Fig. 13).
Since the number of objects that have large
and
values is very small, the correlations we find
for these two parameters are most probably spurious.
,
one sees that the galaxies with large emission line fluxes
generally have very regular velocity fields (Fig. 13).
Since the number of objects that have large
and
values is very small, the correlations we find
for these two parameters are most probably spurious.
Galaxies in our sample have redshifts between 0.1 and 0.9. Using both our sample and the local sample together, we checked whether the regularity of the gas kinematics is a function of redshift. In order not to have the bias of the environment on this analysis, we used only the field galaxies. No correlation was found. Including the cluster galaxies in the correlation does not change the result. Since the number of galaxies in our sample is small, this issue should be revisited in the future.
In our sample, some galaxies need some special mention: galaxies F2, F5 and F10.
Galaxy F2 has a large
,
even though it has regular kinematics
according to the other criteria. It is nearly face-on
 (Fig. B.9a), which causes the photometric position angle
measurements to be unreliable. Therefore,
is not meaningful
in this case.
(Fig. B.9a), which causes the photometric position angle
measurements to be unreliable. Therefore,
is not meaningful
in this case.
 |
 |
 |
|
| this sample | 0.5 | 0.7 | 0.2 |
| local sample | 0.7 | 0.1 | 0.7 |
 |
 |
 |
|
| this sample | -0.3 | -0.4 | -0.3 |
| local sample | 0.0 | 0.1 | 0.0 |
| MB-k3,5/k1 |
 |
 |
|
| this sample | 0.5 | 0.4 | 0.4 |
| local sample | 0.1 | -0.2 | 0.1 |
| A-k3,5/k1 |
 |
 |
|
| this sample | 0.0 | -0.3 | 0.0 |
| C-k3,5/k1 |
 |
 |
|
| this sample | 0.1 | 0.2 | 0.1 |
 |
 |
 |
|
| this sample | -0.5 | -0.4 | -0.7 |
 |
 |
 |
|
| this sample | -0.4 | -0.5 | -0.7 |
| z-k3,5/k1 |
 |
 |
|
| both samples | -0.1 | -0.2 | 0.4 |
|
of the galaxies that have
(galaxy F2 in
``this sample'', NGC 628, NGC 3184, NGC 3938 and NGC 5713 in the local sample),
k3,5/k1 of galaxy F5 (this sample) and all parameters for galaxy F10
(this sample) are doubtful as explained in Sect. 4.1. Therefore they are
excluded while calculating the correlation coefficients. For the calculation
of the correlations with the redshift, only field galaxies were used. So the
results do not have the bias of the environment. Including the cluster
galaxies does not change the result.
|
 |
 |
 |
|
| (1) | (2) | (3) | |
| field & cluster | 27
 |
50
 |
40
 |
| only field | 29
 |
50
 |
33
 |
| only cluster | 25
 |
50
 |
50
|
|
Column (1): fraction of irregular velocity fields according to
criterion and its Poisson error; Col. (2): fraction of irregular velocity fields according to
criterion and its Poisson error; Col. (3): fraction of irregular velocity fields according to
k3,5/k1 criterion and its Poisson error. Note: k3,5/k1 of galaxy F5,
of the galaxies that have
(galaxy F2) and all parameters for galaxy F10 have been excluded
from the calculations as explained in Sect. 4.1.
|
For galaxy F5, only the inner part of the galaxy is included (Appendix, Fig. A.12i) for the parameter
k3,5/k1 due to the large misalignment of the
kinematic and photometric axis, so that the range for which it is determined is
much smaller than for
and
.
There are a few more
galaxies that have large misalignments (e.g. galaxy F3 and galaxy C9). In those
cases, however, the redshifts are much higher and the radial extent of the
observed velocity fields is rather small, so that the measurements of all
parameters is limited to the same region.
The data of galaxy F10 are very noisy, so the high order Fourier terms are
strongly affected (Fig. B.17e). In our sample we exclude
k3,5/k1 of galaxy F5,
of the galaxies that have
(which is the case only for galaxy F2) and all parameters for galaxy F10 from the analysis.
In the local sample, we excluded the
of the galaxies that have
(NGC 628, NGC 3184, NGC 3938, NGC 5713).
Field spirals that have an unbarred morphology and no nearby neighbors are expected to have regular velocity fields (Rubin et al. 1999). However, about 70 percent of the spiral galaxies are expected to have bars (Eskridge et al. 2000; Knapen et al. 2000). A bar and spiral arms may cause large scale deviations from circular rotation. This is discussed in Fridman et al. (2005) together with different possible reasons for small scale anomalies (e.g. nuclear activity, gas outflow from a star formation burst region, a shock excitation mechanism, etc.). See also Wong et al. (2004) and Fathi et al. (2005) where noncircular motions such as bar streaming, inflow and a warp are distinguished from one another using a harmonic decomposition of the velocity fields. However, in the case of distant galaxies, such small scale perturbations would be smeared out in observations, mainly due to seeing (Kronberger et al. 2007).
| Name |
|
/LB |
Line |
| (1) | (2) | (3) | (4) |
| C7 | 0.42 | 0.20 | [OII]3727 |
| C8 | 0.45 | 0.43 | [OII]3727 |
| C9 | 0.18 | 0.17 | [OII]3727 |
| C10 | 0.16 | 0.69 | [OII]3727 |
| F2 | 0.20 | 0.15 | [OII]3727 |
| F3 | 0.17 | 0.42 | H |
| F4 | 0.02 | 0.33 | H |
| F5 | 0.07 | 0.33 | H |
| F6 | 0.01 | 0.18 | H |
| F7 | 1.00 | 1.00 | [OII]3727 |
| F10 | 0.04 | 0.22 | [OIII]5007 |
| Column (1): galaxy ID; Col. (2): relative [OII]3727 flux; Col. (3): relative value of [OII]3727 flux per unit B-band luminosity; Col. (4): emission line used to calculate the [OII]3727 flux for each galaxy. |
Interactions between galaxies may cause big deviations from circular rotation (Rampazzo et al. 2005). In clusters of galaxies, several interaction mechanisms can take place in addition to the galaxy-galaxy interactions (Poggianti 2004) such as ram pressure stripping (Abadi et al. 1999; Roediger & Brüggen 2007; Gunn & Gott III 1972; Kronberger et al. 2008; Quilis et al. 2000), gas starvation (Bekki et al. 2002; Larson et al. 1980), harassment (Moore et al. 1996,1998) and viscous stripping (Nulsen 1982). Moran et al. (2007a) give an estimate of where in MS 0451 different interaction processes are expected to be effective. These phenomena may produce large scale perturbations in the velocity field, similar to the effect of galaxy-galaxy interactions (Rubin et al. 1999). Therefore the fraction of irregular velocity fields is expected to be higher for cluster galaxies than for field galaxies.
We use three indicators of irregular gas kinematics:
,
and
k3,5/k1 (see Sect. 4).
and
k3,5/k1 seem to correlate with
each other, while this is not the case for all parameters. It is also not expected
that all phenomena that may cause kinematical irregularities would increase each
parameter. In case of interaction processes, the disturbance in the velocity field
might cause all parameters to increase. A secondary component in the velocity field
would increase the
k3,5/k1 term while the components do not have to be
kinematically misaligned. The information from all parameters together could be used
to interpret what kind of a phenomenon might be responsible from the irregularities in
the gas kinematics. However, the resolution effects should be taken into account
while doing that (see Appendix A).
We have measured these parameters for the galaxies in our sample and in the SINGS
local sample. All local galaxies apart from one cluster member have regular gas
kinematics according to the
k3,5/k1 criterion while all galaxies are regular
according to the
criterion. There are four galaxies that do not meet
the
criterion (excluding the face-on cases as mentioned in Sect. 4.1).
Each galaxy in the local sample that has a large
value is either
peculiar or is a cluster member. While some galaxies in our high z sample have
k3,5/k1 values that are far above the region where the local galaxies are
distributed, this is not the case for the
and
parameters
(the highest
value in our sample belongs to galaxy F6 which has a
kinematically decoupled core). Galaxies in both samples are distributed within
similar
and
ranges. Garrido et al. (2005) reported for their
local sample that, on average, the misalignment between the kinematic and the
photometric position angle is 
 and the maximum value they
measured is
and the maximum value they
measured is  .
Also in our sample, the fraction of galaxies that are
irregular according to the
criterion is the highest. This kind of
information might give clues to the dominant phenomena that are responsible for the
irregularities or the disturbances that take longer to recover in the gas kinematics.
That would only be reliable, however, in case of high resolution data. At
low spatial resolution, some combinations of a large
k3,5/k1 parameter and
sampling can cause the measured values of
and
to be
boosted (see Appendix A).
.
Also in our sample, the fraction of galaxies that are
irregular according to the
criterion is the highest. This kind of
information might give clues to the dominant phenomena that are responsible for the
irregularities or the disturbances that take longer to recover in the gas kinematics.
That would only be reliable, however, in case of high resolution data. At
low spatial resolution, some combinations of a large
k3,5/k1 parameter and
sampling can cause the measured values of
and
to be
boosted (see Appendix A).
The percentage of galaxies in our sample that have irregular gas kinematics are: 27
13% (according to
criterion), 50
16% (
criterion), 40
15% (
k3,5 / k1 criterion) and 58
14% (any
criterion). Among these galaxies, there are 4 cluster members and they all are
closer than 1 Mpc to the center. Since this is well inside the virial radius of the
cluster, we expect the ICM density to be rather high and, therefore, able to distort
the ISM of the galaxy disks. On the other hand, relative velocities are quite high so
that direct encounters would have rather negligible effects. When we analyze the
distributions of each of the three parameters (Fig. 12), we see that cluster
and field galaxies have similar behaviour.
Flores et al. (2006) made a kinematical classification based on the alignment of the
photometric and kinematic axes and the agreement between the peak of their  map and the kinematic center. They found that
  of the disks are rotating and
as such regular, for a sample of 35 galaxies at
0.4<z<0.75. For the galaxies in
our sample that are in the same redshift interval as Flores et al.'s sample, (7 galaxies, but we excluded the special cases mentioned in Sect. 4.1 from the analysis)
the fraction of objects that have regular gas kinematics is: 40
22% (according
to
criterion), 83
15% (
criterion) and 67
19% (
k3,5/k1 criterion). So, using the
criterion, our result
is comparable with their result. Förster Schreiber et al. (2006) investigated galaxy kinematics
at a much higher redshift. They obtained H maps of 14 massive star forming
galaxies at
of the disks are rotating and
as such regular, for a sample of 35 galaxies at
0.4<z<0.75. For the galaxies in
our sample that are in the same redshift interval as Flores et al.'s sample, (7 galaxies, but we excluded the special cases mentioned in Sect. 4.1 from the analysis)
the fraction of objects that have regular gas kinematics is: 40
22% (according
to
criterion), 83
15% (
criterion) and 67
19% (
k3,5/k1 criterion). So, using the
criterion, our result
is comparable with their result. Förster Schreiber et al. (2006) investigated galaxy kinematics
at a much higher redshift. They obtained H maps of 14 massive star forming
galaxies at
 .
Four of the six best spatially resolved cases match the
expectations for a simple rotating disk. Shapiro et al. (2008) introduce a method to
distinguish merging and non-merging systems. Using kinemetry, they measure the
deviation from the ideal case for both the gas velocity field and the stellar
continuum intensity map of the galaxies. They use these parameters of 29 merging and
regular template galaxies to define a criterion that discerns between the two. They
then apply this method to 11
.
Four of the six best spatially resolved cases match the
expectations for a simple rotating disk. Shapiro et al. (2008) introduce a method to
distinguish merging and non-merging systems. Using kinemetry, they measure the
deviation from the ideal case for both the gas velocity field and the stellar
continuum intensity map of the galaxies. They use these parameters of 29 merging and
regular template galaxies to define a criterion that discerns between the two. They
then apply this method to 11  galaxies and find that >50% of these
systems are consistent with a single rotating disk interpretation. Considering this
result together with high (up to
galaxies and find that >50% of these
systems are consistent with a single rotating disk interpretation. Considering this
result together with high (up to
 )
star formation rates of these
systems, they argue that the smooth accretion mechanism can play an important role in
the early stages of the massive-galaxy evolution.
)
star formation rates of these
systems, they argue that the smooth accretion mechanism can play an important role in
the early stages of the massive-galaxy evolution.
Using H
velocity fields of local galaxies, Garrido et al. (2005) found that
the asymmetry of the rotation curves (or lopsidedness) is correlated with the
morphological type, the luminosity, the (B-V) colour and the maximal rotational
velocity of galaxies. They find that brighter, more massive and redder galaxies
have smaller deviations from regular kinematics. Here we do not use a parameter
that corresponds to kinematic lopsidedness. Although we know that lopsidedness
would cause
k3,5/k1 to increase, large
k3,5/k1 values are not
necessarily due to lopsidedness (e.g. secondary kinematical component can also
do the job). Garrido et al. (2005) also measured the misalignment between the
kinematic and photometric position angles of their galaxies and found no
correlation with morphological type. We investigated this effect using two
indicators of galaxy type: the concentration index and the amount of gas per
unit luminosity. We do not find a correlation with the concentration index
while we do find a negative correlation using
/ LB which means
that later type galaxies have smaller misalignments. This correlation could be
spurious as explained in Sect. 4.1.
We do not find a correlation between the photometric asymmetry and irregularity in
the gas kinematics. The asymmetry index indicates the inhomogenity in the I-band
light distribution. This parameter is a function of the galaxy type. For the
E/S0s it is the smallest, it becomes higher for spirals and it is the highest for
irregular galaxies. Apart from the intrinsic asymmetry of a galaxy, interaction
processes or mergers can also cause the asymmetry index to increase. In case of
an interaction process that is strong enough to affect the distribution of the
stars, it is expected that the gas component is also disturbed. On the other
hand, the phenomena that cause irregularities in the gas kinematics do not
necessarily affect the stellar component since it is gravitationally more
stable. There is one case in our sample for which both the photometry and the
kinematics are irregular (galaxy C9). It has
 20, and it is
regular according to the other criteria (
and
k3,5/k1).
20, and it is
regular according to the other criteria (
and
k3,5/k1).
In this paper we present the kinematic and photometric analysis of 22 galaxies, 11 of which are members of MS 0451 at z=0.54. All cluster members are within 2 Mpc from the center and most of them are closer than 1 Mpc. Among the cluster objects, there are two in interaction with each other and 5 with weak or no emission. For 8 field and 6 cluster galaxies we were able to obtain the gas velocity fields. We used kinemetry to characterise these velocity fields using Fourier coefficients. The maximum radius for which we could measure the kinematic parameters (position angle, ellipticity, etc.) of each galaxy is given in Table 2.
We use 3 parameters to quantify the regularity of the velocity fields:
k3,5/k1,
and
(Sect. 4) and introduce a
criterion for each parameter to distinguish between regular and irregular gas
kinematics. To do that, we also measured each parameter for nearby galaxies in the
SINGS survey and investigated the distribution of these galaxies in the parameter
space. The regularity criteria we define are:
,
 and
.
and
.
We calculated the fraction of galaxies in our sample that have irregular gas
kinematics according to each criterion (without subdividing as field galaxies
and cluster members). 27
(according to
criterion), 50
(
criterion), 40
(
k3,5 / k1 criterion) and 58
 (any criterion). Among these objects, there are four cluster galaxies for which we
were able to measure these parameters. We find that field and cluster galaxies
span similar range of parameter values (Fig. 12). In particular, we find
irregular cases in both environmental classes: 29
/25
(according to
criterion), 50
/50
(
criterion), 33
/50
(
k3,5 / k1 criterion) and 50
(any criterion). Among these objects, there are four cluster galaxies for which we
were able to measure these parameters. We find that field and cluster galaxies
span similar range of parameter values (Fig. 12). In particular, we find
irregular cases in both environmental classes: 29
/25
(according to
criterion), 50
/50
(
criterion), 33
/50
(
k3,5 / k1 criterion) and 50
 /75
(any criterion). However, we note that the number of galaxies we have analyzed is not statistically sufficient to give robust results. In a future paper we will
analyse a much larger sample in the same way, increasing the statistics
considerably.
/75
(any criterion). However, we note that the number of galaxies we have analyzed is not statistically sufficient to give robust results. In a future paper we will
analyse a much larger sample in the same way, increasing the statistics
considerably.
We investigated the spatial resolution effects on our kinematic analysis and
found that the fraction of irregular velocity fields in a sample determined from low
spatial resolution data is an underestimate of the real fraction. We also found out
that for some combinations of a large
k3,5/k1 and sampling, the measured
values of
and
will be boosted, so that the different types
of irregularity become degenerate in the rebinned data. Hence, identifying irregular
galaxies without distinguishing between the three types of irregularity gives more
reliable results in case of low spatial resolution.
6 galaxies (5 of them are cluster members) have strong absorption lines (mainly CaII H, K and Balmer lines) which enabled us to derive their stellar rotation curves. For three of them (C5, C7 and C9), stellar and gas curves show different behaviour. These are galaxies that are classified to have irregular gas kinematics (C5 is interacting with its companion). C7 and C9 also have relatively large photometric asymmetries.
We have performed a surface photometry analysis of each galaxy (Table C.2), and calculated their rest-frame absolute B band magnitude (Table C.1). We also measured some other photometric properties (e.g. asymmetry and concentration index) and investigated the existence of a correlation of these parameters with the kinematic regularity. Although we do not find any significant correlation, these should be re-investigated with a larger sample.
Acknowledgements
We are thankful to the authors of Daigle et al. (2006) for kindly providing us with the H
More than half of our galaxies are at redshifts above 0.5 and were observed with pixels
of
 and a seeing of
 (FWHM). Here we test how much
our kinematical analysis depends on these observing conditions. For that, we
simulate the combined effect of seeing and spatial resolution on the observed velocity
field, as a function of distance to the observed galaxy. We start with the velocity
field of a galaxy at distance d with a pixel size of m
4m. To represent the
observed velocity field of this galaxy when it is N times further away, we first
convolve it with a Gaussian psf:
(FWHM). Here we test how much
our kinematical analysis depends on these observing conditions. For that, we
simulate the combined effect of seeing and spatial resolution on the observed velocity
field, as a function of distance to the observed galaxy. We start with the velocity
field of a galaxy at distance d with a pixel size of m
4m. To represent the
observed velocity field of this galaxy when it is N times further away, we first
convolve it with a Gaussian psf:
 is the FWHM of the point spread function of the
velocity field at the distance d. After the convolution process, we rebin the
velocity field to have a pixel size of Nm
4Nm. To calculate the velocity
corresponding to the new pixel, we measure the intensity weighted velocity within its
borders. We applied this method to several velocity fields that have different types
and levels of irregularity. These include a regular H velocity field
(Fig. A.1a), simulated velocity fields of interacting galaxies
(Kronberger et al. 2007) (Figs. A.1b-d), warped models that have simple rotation along each
orbit (Figs. A.1e-g) and some models made by adding 3rd and 5th order Fourier
terms with different amplitudes to the velocity field of a simple rotating disk
(Figs. A.1h-m). The warped velocity fields were made to measure the resolution
effects on the
and
parameters while the last group of
models were made to evaluate the resolution effects on the
k3,5/k1 term.
is the FWHM of the point spread function of the
velocity field at the distance d. After the convolution process, we rebin the
velocity field to have a pixel size of Nm
4Nm. To calculate the velocity
corresponding to the new pixel, we measure the intensity weighted velocity within its
borders. We applied this method to several velocity fields that have different types
and levels of irregularity. These include a regular H velocity field
(Fig. A.1a), simulated velocity fields of interacting galaxies
(Kronberger et al. 2007) (Figs. A.1b-d), warped models that have simple rotation along each
orbit (Figs. A.1e-g) and some models made by adding 3rd and 5th order Fourier
terms with different amplitudes to the velocity field of a simple rotating disk
(Figs. A.1h-m). The warped velocity fields were made to measure the resolution
effects on the
and
parameters while the last group of
models were made to evaluate the resolution effects on the
k3,5/k1 term.
For the intensity weighting of galaxy 1, we used its H image. For galaxies 2-4, we used their stellar mass density maps assuming that they have constant mass
to light ratios. For the rest of the models, we used an intensity map that has the
same orientation and ellipticity as the corresponding velocity field and is in the
form of
intensity profile of galaxy 1. r is the distance to the
center of the map. The velocity field of galaxy 1 calculated at several distances is
shown in Fig. A.2. For the other galaxies, we show only the velocity field
at the largest simulated distance, in Fig. A.1. The velocity maps in these
figures show the velocity corresponding to each pixel at its center. The values in
between the pixel centers were visualized using linear interpolation.
![\begin{figure}
\par\includegraphics[width=16.6cm,clip]{9782fg15} \end{figure}](/articles/aa/full/2008/34/aa09782-08/img145.gif) |
Figure A.2:
Galaxy 1 a) at distance d with m
4m pixel size.
b)- f) At distance 1.6d, 3.2d, 6.4d, 12.8d and 25.6d with pixel
sizes of m
4m, 2m
8m, 4m
16m, 8m
32m, 16m
64m respectively. |
The velocity fields that are used for this exercise do not all have the same initial
distance and resolution. However, they all have similar grid sizes with our observations
at their largest simulated distance. This better indicates how comparable the simulations
are with our observations than the actual resolution. Because our sample is not homogenius
in size and redshift, but all galaxies were observed with 3 pixels along their minor axis.
For the redshift of our cluster galaxies (z=0.54), the physical size of our pixels is
1.6
6.4 kpc. For a magnification of 25.6, the range of our simulations,
the pixel size in the local universe would be 63
250 pc. This would correspond to
an angular resolution of

 at the distance of Virgo,
somewhat larger than can be obtained with current ground-based telescopes in the optical.
For the velocity fields of galaxies 2-4, the intrinsic resolution was so low, that we could
only degrade them by a factor 8. For the rest the maximum factor was 25.
at the distance of Virgo,
somewhat larger than can be obtained with current ground-based telescopes in the optical.
For the velocity fields of galaxies 2-4, the intrinsic resolution was so low, that we could
only degrade them by a factor 8. For the rest the maximum factor was 25.
For each velocity field simulated at several resolutions, we measured the
(ir)regularity parameters (
,
and
k3,5/k1). In
Fig. A.3 we plot
k3,5/k1 as a function of distance for galaxies that
have
k3,5/k1 greater and less than 0.15, to avoid overcrowding of the plots.
For galaxies that have a large intrinsic value of
k3,5/k1, the value that is
recovered at low resolution is always smaller except in a few cases. For some
galaxies, a decrease in the resolution causes an increase in this parameter as a result
of a different gradient pattern introduced by intensity weighted average velocities
within larger pixels. This is the case for galaxies 8 and 13. For a few galaxies,
k3,5/k1 decreases substantially with decreasing resolution, e.g. galaxy 4.
Regular velocity fields show a regular, slow decrease, which is accompanied by a small
deviation in some cases. Overall, small values of
k3,5/k1 measured for
galaxies at large distances do not provide information about their intrinsic values,
while large measured values indicate large intrinsic values. There are three cases
where the measured
k3,5/k1 at the largest distance of simulations is above the
irregularity treshold (galaxies 2, 8 and 13) and they all have intrinsic values that are
higher than the treshold. However, only 43
of the velocity fields that have
intrinsic values of
k3,5/k1 above the irregularity threshold would be
identified as such at the lowest resolution. This means that using
k3,5/k1 as
an indicator, a lower limit is found to the number of irregular galaxies.
In Fig. A.4, we plot
and
as a function of distance for
the same groups of galaxies as in Fig. A.3 separately. We also give the
position angle as a function of radius for both the original velocity field and the
velocity field at the largest distance in Fig. A.5. While most galaxies show a
continuous decrease of these two parameters with increasing distance, some of the
galaxies that have a large
k3,5/k1 parameter show a strongly varying behavior.
The reason for this is the same fact causing the deviation in
k3,5/k1 parameter
itself as explained above. The increase in the
and
terms at
lower resolution does not only depend on the
k3,5/k1 parameter, but also on the
gradient structure of the velocity field and how the pixels are positioned on it. At
low resolution,
values of galaxy 12 and 13 are measured to be larger than
the irregularity treshold although their intrinsic values are around zero.
of galaxies 9 and 10 also go above the irregularity treshold at low
resolution although their intrinsic values are below 10. Among these galaxies, all but
galaxy 10 have large
k3,5/k1 parameters (for galaxy 10,
k3,5/k1= 0.08).
This means that in the case of low spatial resolution, the combined effect of a large
k3,5/k1 and the pixel positions will cause
and
to be
larger than their intrinsic values. For galaxies that have a large intrinsic value of
and
,
the fraction of information that is lost with
decreasing resolution is generally higher. In case of galaxies that do not have large
k3,5/k1 values,
does not change much with resolution.
 of the velocity fields that are irregular according to the
criterion could be identified at the lowest resolution case. There are
7 velocity fields that are irregular according to the
criterion and
of the velocity fields that are irregular according to the
criterion could be identified at the lowest resolution case. There are
7 velocity fields that are irregular according to the
criterion and
 of them could be identified at the lowest resolution case.
The results of this test show that the fraction of irregular galaxies in a sample
determined from low spatial resolution data will be underestimated. A combination of a
high
k3,5/k1 and pixel positioning can cause the measured values of
and
to be boosted, so that the different types of
irregularity become degenerate in the rebinned data. Hence, identifying irregular
galaxies without distinguishing between the three types of irregularity gives more
reliable results in case of low spatial resolution. At the lowest resolution,
 of all irregular galaxies is classified as such according to at least one
of our irregularity criteria, while all three regular cases were correctly
identified.
of all irregular galaxies is classified as such according to at least one
of our irregularity criteria, while all three regular cases were correctly
identified. 
 of the cases that are identified to be irregular at the
lowest resolution were intrinsically irregular.
of the cases that are identified to be irregular at the
lowest resolution were intrinsically irregular.
We also checked how the global kinematic position angle and flattening change as a function of the distance. This is given in Fig. A.6. The global position angle is very robust while this is much less the case for the ellipticity.
![\begin{figure}
\par\includegraphics[width=16.7cm,clip]{9782fg19} \end{figure}](/articles/aa/full/2008/34/aa09782-08/img156.gif) |
Figure A.6: Left: the global kinematic position angle as a function of the distance. Right: the global kinematic flattening as a function of the distance. |
Galaxy C5 is an example of the fact that a galaxy with very complex kinematics can have a very regular surface brightness profile. Using its asymmetry and concentration indexes, it is classified as an E/S0 galaxy (Sect. 3.2, Fig. 9).

 )
and the standard deviation of its kinematic position angle is big (
)
and the standard deviation of its kinematic position angle is big (
 ). So this galaxy has irregular gas kinematics (Fig. B.4). It is classified as an irregular galaxy according to its photometric asymmetry and concentration measurements (Sect. 3.2, Fig. 9). The stellar and gas velocity
fields of this galaxy have some discrepancies.
). So this galaxy has irregular gas kinematics (Fig. B.4). It is classified as an irregular galaxy according to its photometric asymmetry and concentration measurements (Sect. 3.2, Fig. 9). The stellar and gas velocity
fields of this galaxy have some discrepancies.
,
and
k3,5 / k1) (Fig. B.5).

 ). There is also
a big discrepancy between its stellar and gas rotation curves.
). There is also
a big discrepancy between its stellar and gas rotation curves.
![\begin{figure}
\par\includegraphics[angle=270,width=8.2cm,clip]{9782fg20} \end{figure}](/articles/aa/full/2008/34/aa09782-08/img162.gif) |
Figure B.1: a) HST-ACS image of the galaxy in the I band. b) Rotation curves of the [OII]3727 emission line and several absorption lines extracted along the central slit. |
![\begin{figure}
\par\includegraphics[angle=270,width=8.2cm,clip]{9782fg21} \end{figure}](/articles/aa/full/2008/34/aa09782-08/img163.gif) |
Figure B.2: I band HST-ACS images of galaxies that do not have emission. The corresponding galaxy name (C2-C4) is indicated on each image. |
and
k3,5 / k1 criteria. Since
it is nearly face-on, its
was excluded from the analysis.
criterion

 .
Classified as an irregular galaxy according to its photometric asymmetry and concentration measurements (Sect. 3.2, Fig. 9).
.
Classified as an irregular galaxy according to its photometric asymmetry and concentration measurements (Sect. 3.2, Fig. 9).
and
k3,5 / k1 criteria. After R
1
3, there is a substantial change in its kinematic position angle
and ellipticity which may be the indicator of a secondary component.
criterion. The
k3,5 /
k1 is not meaningful since the measurements cover only the inner part of the
velocity field in this particular case (see Fig. A.12i). The reason is that
k3,5 / k1 is calculated while fixing the position angle to its global
value and the misalignment between this angle and the slit position angle is very
large. Therefore
k3,5 /k1 of this galaxy is excluded from
our analysis.
velocity field (Fig. B.13e), it has a counter rotating core. Related
to this is the fact that it has irregular gas kinematics according to all the criteria we
defined:

 ,
,
 ,
k3,5 /
k1=0.27 0.18.
,
k3,5 /
k1=0.27 0.18.
,
k3,5 / k1 and
)
(Fig. B.14). Using its photometry (asymmetry and concentration
indexes), it is classified as an irregular/peculiar galaxy (Fig. 9).
![\begin{figure}
\par\includegraphics[angle=270,width=8.2cm,clip]{9782fg27} \end{figure}](/articles/aa/full/2008/34/aa09782-08/img174.gif) |
Figure B.8: a) HST-ACS image of the galaxy in the I band. b) [OII]3727 rotation curve (this galaxy was observed with only one slit position). |
Here we give information on the galaxies that were excluded from the analysis because of the problems explained below for individual cases. This section also includes the galaxies for which the redshift is uncertain, since only one line is visible in the spectrum. In these cases, different possibilities for identification of the line rule out that these galaxies are cluster members.
![$\rm [OIII]5007$](/articles/aa/full/2008/34/aa09782-08/img16.gif) )
is quite noisy as well,
so this galaxy is excluded from our analysis.
)
is quite noisy as well,
so this galaxy is excluded from our analysis.
,
k3,5 / k1 and
).
| ID | RA | Dec | z | V | R | I | MB | A | C |
| (1) | (2) | (3) | (4) | (5) | (6) | (7) | (8) | (9) | (10) |
| C1 | 04:54:2.2 | -02:57:10 | 0.5421 | 21.94 | 20.85 | 19.95 | -21.06 | 0.25219 | 0.32179 |
| C2 | 04:54:17.2 | -03:01:56 | 0.5486 | 22.02 | 21.00 | 20.07 | -20.91 | 0.15682 | 0.34844 |
| C3 | 04:54:18.6 | -03:01:03 | 0.5465 | 22.16 | 21.20 | 20.49 | -20.68 | 0.07922 | 0.27806 |
| C4 | 04:54:17.6 | -02:59:23 | 0.5324 | 22.34 | 21.41 | 20.72 | -20.37 | 0.36244 | 0.33291 |
| C5 | 04:54:1.5 | -02:59:24 | 0.5312 | 22.42 | 21.01 | 19.81 | -20.82 | 0.15670 | 0.52285 |
| C6 | 04:54:1.3 | -02:59:22 | 0.5305 | 21.83 | 21.15 | 20.59 | -20.59 | 0.32947 | 0.40650 |
| C7 | 04:54:5.0 | -02:59:40 | 0.5277 | 19.75 | 19.23 | 18.86 | -22.45 | 0.32994 | 0.20636 |
| C8 | 04:54:4.4 | -03:00:14 | 0.5325 | 20.80 | 20.10 | 19.46 | -21.68 | 0.27380 | 0.27789 |
| C9 | 04:54:15.0 | -03:00:22 | 0.5246 | 20.56 | 19.89 | 19.46 | -21.76 | 0.33459 | 0.26970 |
| C10 | 04:54:17.7 | -03:02:29 | 0.5312 | 21.92 | 21.61 | 21.21 | -20.05 | 0.19672 | 0.21096 |
| C11 | 04:54:10.3 | -03:00:46 | - | - | - | - | - | - | - |
| F1 | 04:54:2.7 | -02:58:41 | 0.9009 | 23.27 | 22.75 | 21.46 | -20.97 | 0.18516 | 0.18578 |
| F2 | 04:54:3.8 | -02:59:19 | 0.5795 | 20.88 | 20.11 | 19.42 | -21.96 | 0.27311 | 0.22909 |
| F3 | 04:54:14.9 | -02:58:17 | 0.5667 | 21.88 | 21.24 | 20.64 | -20.66 | 0.33834 | 0.20427 |
| F4 | 04:54:7.8 | -03:00:33 | 0.1867 | 20.54 | 20.37 | 20.00 | -18.78 | 0.17365 | 0.32308 |
| F5 | 04:54:10.0 | -03:00:28 | 0.1573 | 19.05 | 18.72 | 18.26 | -19.95 | 0.19844 | 0.30783 |
| F6 | 04:54:18.9 | -03:00:05 | 0.0982 | 19.23 | 18.93 | 18.55 | -18.56 | 0.14823 | 0.27114 |
| F7 | 04:54:2.3 | -02:58:10 | 0.9125 | 22.22 | 21.91 | 20.73 | -21.64 | 0.42715 | 0.16334 |
| F8 | 04:54:10.4 | -03:00:47 | 0.4443 | - | - | - | - | - | - |
| F9 | 04:54:10.2 | -03:01:57 | 0.3259 | 20.83 | 20.03 | 19.08 | -20.15 | 0.29565 | 0.53731 |
| F10 | 04:54:0.5 | -02:58:15 | 0.4947 | 22.47 | 21.86 | 21.38 | -19.67 | 0.20119 | 0.23420 |
| F11 | 04:54:20.6 | -03:00:16 | - | 21.25 | 20.67 | 20.04 | - | 0.18512 | 0.27344 |
|
Column (1): object ID; Cols. (2, 3): RA and Dec (J2000);
Col. (4): object redshift; Cols. (5-7): V, R, I extinction corrected total magnitudes from
the FORS2/VLT images;
Col. (8): rest frame Johnson-B magnitudes k-corrected with kcorrect (Blanton & Roweis 2007);
Col. (9): asymmetry index;
Col. (10): concentration index. For F11, the redshift is uncertain as explained in Sect. 2.3. Redshift of galaxy F7 and C11 are taken from Moran (2008). Galaxy C11 and F8 are so close together on the FORS images that their magnitudes could not be measured separately. |
| ID | comp | F814W |
 |
n | q | PA |  |
B/D |
| (1) | (2) | (3) | (4) | (5) | (6) | (7) | (8) | (9) |
| C1 | exp disk | 20.04
0.01 |
3.182
0.016 |
- | 0.31
0.00 |
6.68
0.16 |
1.95 | - |
| C2 | exp disk | 20.35
0.01 |
4.057
0.029 |
- | 0.68
0.00 |
130.45
0.56 |
1.62 | 0.20 |
| Sérsic bulge | 22.08
0.07 |
0.840
0.071 |
2.37
0.20 |
0.99
0.02 |
- | - | ||
| C3 | exp disk | 20.44
0.00 |
3.643
0.016 |
- | 0.23
0.00 |
107.48
0.10 |
1.89 | - |
| C4 | exp disk | 20.67
0.00 |
2.334
0.013 |
- | 0.16
0.00 |
351.81
0.08 |
2 | - |
| C5 | exp disk | 21.33
0.03 |
2.646
0.044 |
- | 0.19
0.00 |
133.62
0.16 |
1.93 | 2.05 |
| Sérsic bulge | 20.55
0.02 |
1.619
0.035 |
3.73
0.09 |
0.47
0.01 |
- | - | ||
| C6 | exp disk | 21.08
0.00 |
1.070
0.006 |
- | 0.90
0.01 |
91.42
2.85 |
2.56 | - |
| C7 | exp disk | 18.87
0.00 |
5.086
0.019 |
- | 0.78
0.00 |
104.2
0.51 |
2.72 | - |
| C8 | exp disk | 19.62
0.00 |
4.983
0.025 |
- | 0.64
0.00 |
116.19
0.40 |
2.24 | 0.05 |
| Sérsic bulge | 22.86
0.02 |
0.419
0.016 |
1.43
0.19 |
0.74
0.03 |
- | - | ||
| C9 | exp disk | 19.48
0.00 |
3.693
0.016 |
- | 0.50
0.00 |
110.27
0.23 |
3.56 | - |
| C10 | exp disk | 21.62
0.01 |
1.071
0.009 |
- | 0.80
0.01 |
30.22
2.13 |
2.65 | - |
| F1 | exp disk | 21.43
0.01 |
3.351
0.039 |
- | 0.51
0.00 |
19.77
0.58 |
1.54 | - |
| F2 | exp disk | 19.41
0.00 |
3.880
0.016 |
- | 0.90
0.00 |
137.13
1.32 |
2.06 | - |
| F3 | exp disk | 20.66
0.01 |
4.489
0.026 |
- | 0.22
0.00 |
123.95
0.12 |
1.61 | - |
| F4 | exp disk | 20.08
0.00 |
2.062
0.011 |
- | 0.33
0.00 |
96.37
0.15 |
2.13 | - |
| F5 | exp disk | 18.28
0.00 |
3.453
0.007 |
- | 0.36
0.00 |
129.11
0.07 |
2.41 | 0.05 |
| Sérsic bulge | 21.64
0.03 |
0.400
0.018 |
1.84
0.11 |
0.89
0.02 |
- | - | ||
| F6 | exp disk | 18.47
0.00 |
2.432
0.012 |
- | 0.65
0.00 |
179.96
0.24 |
2.19 | 0.04 |
| Sérsic bulge | 21.88
0.07 |
0.500
0.039 |
1.62
0.12 |
1.00
0.03 |
- | - | ||
| F7 | exp disk | 20.96
0.01 |
3.175
0.031 |
- | 0.71
0.01 |
47.28
0.93 |
1.73 | - |
| F9 | exp disk | 20.36
0.02 |
2.451
0.021 |
- | 0.29
0.00 |
9.36
0.18 |
2.05 | 1.51 |
| Sérsic bulge | 19.91
0.02 |
1.602
0.033 |
3.09
0.05 |
0.60
0.00 |
- | - | ||
| F10 | exp disk | 21.33
0.01 |
3.581
0.039 |
- | 0.28
0.00 |
61.08
0.26 |
1.81 | - |
| F11 | exp disk | 20.14
0.01 |
0
7
0
007 |
- | 0.37
0.00 |
134.39
0.18 |
1.92 | 0.12 |
| Sérsic bulge | 22.44
0.12 |
0
245
0
025 |
1.33
0.10 |
0.85
0.03 |
- | - |
|
Column (1): object ID;
Col. (2): component;
Col. (3): total magnitude;
Col. (4): effective radius of the bulge/scale length of the disk;
Col. (5): sérsic index of the bulge profile;
Col. (6): flattening;
Col. (7): position angle of the disk measured from North through East;
Col. (8):
of the fit;
Col. (9): bulge to disk ratio. The photometric zero point of the magnitude measurements is  (Bedin et al. 2005). The redshift of galaxy F11 is uncertain as explained in Sect. 2.3. As a result, for this galaxy, Col. (4) is given in arcseconds. For galaxy F7, we used the redshift from Moran (2008). The surface brightness profile of Galaxy C10 is much more extended on one side of the galaxy than on the other side. Therefore the scale length and total magnitude of the disk given in the table are not reliable.
This galaxy was excluded while calculating the correlations between the disk scale length and the
irregularity in the gas kinematics. (Bedin et al. 2005). The redshift of galaxy F11 is uncertain as explained in Sect. 2.3. As a result, for this galaxy, Col. (4) is given in arcseconds. For galaxy F7, we used the redshift from Moran (2008). The surface brightness profile of Galaxy C10 is much more extended on one side of the galaxy than on the other side. Therefore the scale length and total magnitude of the disk given in the table are not reliable.
This galaxy was excluded while calculating the correlations between the disk scale length and the
irregularity in the gas kinematics.
|
![\begin{figure}
\par\includegraphics[width=8.3cm,clip]{9782fg01} \end{figure}](/articles/aa/full/2008/34/aa09782-08/img37.gif)
![\begin{figure}
\par\includegraphics[width=8.3cm,clip]{9782fg02} \end{figure}](/articles/aa/full/2008/34/aa09782-08/img39.gif)
![\begin{figure}
\par\includegraphics[width=7.6cm,clip]{9782fg03} \end{figure}](/articles/aa/full/2008/34/aa09782-08/img53.gif)
![\begin{figure}
\par\includegraphics[width=7.6cm,clip]{9782fg04} \end{figure}](/articles/aa/full/2008/34/aa09782-08/img54.gif)
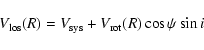
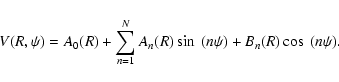
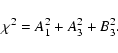

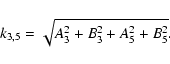
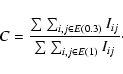
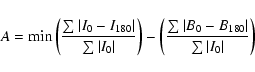
![\begin{figure}
\par\includegraphics[width=8cm,clip]{9782fg10} \end{figure}](/articles/aa/full/2008/34/aa09782-08/img87.gif)
![\begin{figure}
\par\includegraphics[width=8.3cm,clip]{9782fg12} \end{figure}](/articles/aa/full/2008/34/aa09782-08/img89.gif)
 ), our sample (the column
on the right): field galaxies in red (coarse-shaded at
), our sample (the column
on the right): field galaxies in red (coarse-shaded at
 )
and cluster
galaxies in light yellow (not shaded).
)
and cluster
galaxies in light yellow (not shaded).
![\begin{figure}
\par\includegraphics[width=16.7cm,clip]{9782fg13} \end{figure}](/articles/aa/full/2008/34/aa09782-08/img95.gif)


![\begin{figure}
\par\includegraphics[width=16.6cm,clip]{9782fg14} \end{figure}](/articles/aa/full/2008/34/aa09782-08/img144.gif)
![\begin{figure}
\par\includegraphics[width=16.7cm,clip]{9782fg16} \end{figure}](/articles/aa/full/2008/34/aa09782-08/img153.gif)
![\begin{figure}
\par\includegraphics[width=16.5cm,clip]{9782fg17} \end{figure}](/articles/aa/full/2008/34/aa09782-08/img154.gif)
![\begin{figure}
\par\includegraphics[width=16.7cm,clip]{9782fg18} \end{figure}](/articles/aa/full/2008/34/aa09782-08/img155.gif)
![\begin{figure}
\par\includegraphics[angle=270,width=16cm,clip]{9782fg22} \end{figure}](/articles/aa/full/2008/34/aa09782-08/img164.gif)
![\begin{figure}
\par\includegraphics[angle=270,width=16.6cm,clip]{9782fg23} \end{figure}](/articles/aa/full/2008/34/aa09782-08/img165.gif)
![\begin{figure}
\par\includegraphics[angle=270,width=16.7cm,clip]{9782fg24} \end{figure}](/articles/aa/full/2008/34/aa09782-08/img166.gif)
![\begin{figure}
\par\includegraphics[angle=270,width=16.7cm,clip]{9782fg25}\end{figure}](/articles/aa/full/2008/34/aa09782-08/img167.gif)
![\begin{figure}
\par\includegraphics[angle=270,width=16.7cm,clip]{9782fg26} \end{figure}](/articles/aa/full/2008/34/aa09782-08/img168.gif)
![\begin{figure}
\par\includegraphics[angle=270,width=16.7cm,clip]{9782fg28} \end{figure}](/articles/aa/full/2008/34/aa09782-08/img175.gif)
![\begin{figure}
\par\includegraphics[angle=270,width=16.7cm,clip]{9782fg29} \end{figure}](/articles/aa/full/2008/34/aa09782-08/img176.gif)
![\begin{figure}
\par\includegraphics[angle=270,width=16.7cm,clip]{9782fg30} \end{figure}](/articles/aa/full/2008/34/aa09782-08/img177.gif)
![\begin{figure}
\par\includegraphics[angle=270,width=16.7cm,clip]{9782fg31} \end{figure}](/articles/aa/full/2008/34/aa09782-08/img178.gif)
![\begin{figure}
\par\includegraphics[angle=270,width=16.7cm,clip]{9782fg32} \end{figure}](/articles/aa/full/2008/34/aa09782-08/img179.gif)
![\begin{figure}
\par\includegraphics[angle=270,width=16.7cm,clip]{9782fg33} \end{figure}](/articles/aa/full/2008/34/aa09782-08/img180.gif)
![\begin{figure}
\par\includegraphics[angle=270,width=7.6cm,clip]{9782fg34} \end{figure}](/articles/aa/full/2008/34/aa09782-08/img181.gif)
![\begin{figure}
\par\includegraphics[angle=270,width=5.5cm,clip]{9782fg35} \end{figure}](/articles/aa/full/2008/34/aa09782-08/img182.gif)
![\begin{figure}
\par\includegraphics[angle=270,width=16.7cm,clip]{9782fg36} \end{figure}](/articles/aa/full/2008/34/aa09782-08/img183.gif)
![\begin{figure}
\par\includegraphics[angle=270,width=16.7cm,clip]{9782fg37} \end{figure}](/articles/aa/full/2008/34/aa09782-08/img184.gif)