A&A 488, 235-244 (2008)
DOI: 10.1051/0004-6361:200809770
M. Gustafsson1 - L. Labadie1 - T. M. Herbst1 - M. Kasper2
1 - Max-Planck-Institute for Astronomy, Königstuhl 17, 69117 Heidelberg, Germany
2 - European Southern Observatory, Karl-Schwarzschild-Str. 2, 85748
Garching, Germany
Received 12 March 2008 / Accepted 18 June 2008
Abstract
Context. Molecular hydrogen is the main constituent of circumstellar disks and could be an important tracer for the evolution and structure of such disks. So far, H2 has only been detected in a few disks and only through spectroscopic observations, resulting in a limited knowledge of the spatial distribution of the H2 emitting gas.
Aims. We report the detection of quiescent H2 emission in a spatially resolved ring-like structure within 100 AU of T Tau N. We present evidence to show that the emission most likely arises from shocks in the atmosphere of a nearly face-on disk around T Tau N.
Methods. Using high spatial resolution 3D spectroscopic K-band data, we trace the spatial distribution of several H2 NIR rovibrational lines in the vicinity of T Tau N. We examine the structure of the circumstellar material around the star through SED modeling. Then, we use models of shocks and UV+X-ray irradiation to reproduce the H2 line flux and line ratios in order to test how the H2 is excited.
Results. We detect weak H2 emission from the v=1-0 S(0), S(1), Q(1) lines and the v=2-1 S(1) line in a ring-like structure around T Tau N between 0
![]() 1 (
1 (![]() 15 AU) and 0
15 AU) and 0
![]() 7 (
7 (![]() 100 AU) from the star. The v=1-0 S(0) and v=2-1 S(1) lines are detected only in the outer parts of the ring structure. Closer to the star, the strong continuum limits our sensitivity to these lines. The total flux of the v=1-0 S(1) line is 1.8
100 AU) from the star. The v=1-0 S(0) and v=2-1 S(1) lines are detected only in the outer parts of the ring structure. Closer to the star, the strong continuum limits our sensitivity to these lines. The total flux of the v=1-0 S(1) line is 1.8 ![]() 10-14 erg s-1 cm-2, similar to previous measurements of H2 in circumstellar disks. The velocity of the H2 emitting gas around T Tau N is consistent with the rest velocity of the star, and the H2 does not seem to be part of a collimated outflow. Both shocks impinging on the surface of a disk and irradiation of a disk by UV-photons and X-rays from the central star are plausible candidates for the H2 excitation mechanism. However, irradiation should not create a large degree of excitation at radii larger than 20 AU. Most likely the H2 emission arises in the atmosphere of a flared disk with radius 85-100 AU and mass 0.005-0.5
10-14 erg s-1 cm-2, similar to previous measurements of H2 in circumstellar disks. The velocity of the H2 emitting gas around T Tau N is consistent with the rest velocity of the star, and the H2 does not seem to be part of a collimated outflow. Both shocks impinging on the surface of a disk and irradiation of a disk by UV-photons and X-rays from the central star are plausible candidates for the H2 excitation mechanism. However, irradiation should not create a large degree of excitation at radii larger than 20 AU. Most likely the H2 emission arises in the atmosphere of a flared disk with radius 85-100 AU and mass 0.005-0.5 ![]() ,
where the gas is excited by shocks created when a wide-angle wind impinges on the disk. The H2 emission could also originate from shock excitation in the cavity walls of an envelope, but this requires an unusually high velocity of the wide-angle wind from T Tau N.
,
where the gas is excited by shocks created when a wide-angle wind impinges on the disk. The H2 emission could also originate from shock excitation in the cavity walls of an envelope, but this requires an unusually high velocity of the wide-angle wind from T Tau N.
Key words: stars: winds, outflows - stars: circumstellar matter - stars: emission-line, Be - stars: pre-main sequence - infrared: stars
The study of circumstellar disks around young stars is essential to understanding their evolution from gaseous disks to planetary systems. In this paper, we examine the spatial distribution of molecular hydrogen, the main constituent of disks around young stars. Disks have been observed in a wide range of wavelengths ranging from optical to millimeter, although only a few studies have concentrated on the H2 component. Many investigations have focused on the broad band spectral energy distribution, which reflects the disk geometry and the structure of the dust content. Disks have also been observed more directly via optically thick dust lanes blocking the scattered light from young stars, and as near-infrared images of the scattered light of the disk itself (e.g. McCabe et al. 2002; Weinberger et al. 2002). Molecular line emission from species such as CO or HCO+ is also used as a tracer for disks. The use of such tracers is, however, subject to some uncertainty. Heavy element molecules may freeze out on dust grains, which likely settle to the midplane of the disk and/or get bound in larger rocks or planetesimals. Thus, molecules such as CO can become undetectable even if the disk still exists.
Examining the H2 content in disks has many advantages. Hydrogen and helium are the last parts of the gas to be bound up when planets form, and will therefore remain in the disk after CO and dust have become undetectable. Observations of molecular hydrogen directly trace the gas mass of the disk without making assumptions about the dust-to-gas or CO-to-H2 ratios. Furthermore, molecular hydrogen will remain in the surface layers of the disk when the dust settles to the midplane and is more directly accessible to incoming light than the dust and heavier elements. As a result, H2 may prove to be a better tracer for exploring the evolution and structure of circumstellar disks, since it may be observable for a longer period of time.
Direct observations of H2 in disks have been undertaken by several
groups. We focus here on the observations of the IR rovibrational lines,
although some studies have concentrated on pure rotational lines in the MIR
(e.g. Lahuis et al. 2007) as
well as fluorescent H2 in the UV (e.g. Walter et al. 2003; Herczeg et al. 2006).
Emission from the H2 v=1-0 S(1) line at 2.1218 ![]() m has been detected in
the disks of several T Tauri stars, classical as well as weak-line
(Itoh et al. 2003; Bary et al. 2008; Ramsay Howat & Greaves 2007; Carmona et al. 2008; Bary et al. 2003; Weintraub et al. 2005).
These detections are made through longslit spectroscopic observations, and they do not
reveal much about the spatial distribution of the molecular hydrogen, beyond
indicating that the emitting gas is located within 50 AU of the central
star. Chen et al. (1998) presented images of H2 v=1-0 S(1) emission from
photoevaporating disks in Orion and showed that the emission arises on the disk surface. In
this case, the disks were externally irradiated, and the H2 emission was
found from a region
m has been detected in
the disks of several T Tauri stars, classical as well as weak-line
(Itoh et al. 2003; Bary et al. 2008; Ramsay Howat & Greaves 2007; Carmona et al. 2008; Bary et al. 2003; Weintraub et al. 2005).
These detections are made through longslit spectroscopic observations, and they do not
reveal much about the spatial distribution of the molecular hydrogen, beyond
indicating that the emitting gas is located within 50 AU of the central
star. Chen et al. (1998) presented images of H2 v=1-0 S(1) emission from
photoevaporating disks in Orion and showed that the emission arises on the disk surface. In
this case, the disks were externally irradiated, and the H2 emission was
found from a region ![]() 200 AU in size.
200 AU in size.
In this paper, we present spatially resolved images of H2 emission from a ring around T Tau N obtained with the integral field spectrograph SINFONI on the ESO-VLT. The presence of H2 emission in the T Tau system has been known for decades, but this is the first time that the weak emission within 100 AU of T Tau N has been resolved and analyzed.
T Tau is a triple star system with an age of ![]() 1 Myr (White & Ghez 2001). The binary component T Tau S, consisting of T Tau Sa and T Tau Sb (separation
1 Myr (White & Ghez 2001). The binary component T Tau S, consisting of T Tau Sa and T Tau Sb (separation ![]() 0
0
![]() 1), is currently
1), is currently ![]() 0
0
![]() 7 south of T Tau N. All three stars are actively accreting and believed to host disks
(Duchêne et al. 2005). T Tau S shows heavy extinction (
7 south of T Tau N. All three stars are actively accreting and believed to host disks
(Duchêne et al. 2005). T Tau S shows heavy extinction (
![]() ), which is
attributed to a circumbinary structure (Duchêne et al. 2005). Another
possibility is that T Tau S is obscured
by the disk around T Tau N (Beck et al. 2001; Hogerheijde et al. 1997).
), which is
attributed to a circumbinary structure (Duchêne et al. 2005). Another
possibility is that T Tau S is obscured
by the disk around T Tau N (Beck et al. 2001; Hogerheijde et al. 1997).
T Tau N is a ![]() 2
2 ![]() star (White & Ghez 2001) and is believed to have a disk that is seen nearly face-on (Akeson et al. 1998). Based on photometric periodicity and assumed stellar radius, Herbst et al. (1997) derive an inclination of 19
star (White & Ghez 2001) and is believed to have a disk that is seen nearly face-on (Akeson et al. 1998). Based on photometric periodicity and assumed stellar radius, Herbst et al. (1997) derive an inclination of 19![]() .
Stapelfeldt et al. (1998) suggest an outflow and disk with the axis
at position angle 300
.
Stapelfeldt et al. (1998) suggest an outflow and disk with the axis
at position angle 300![]() and with inclination of
and with inclination of ![]()
![]() in
order to explain the morphology of scattered optical light. Akeson et al. (2002)
find the inclination to be
in
order to explain the morphology of scattered optical light. Akeson et al. (2002)
find the inclination to be
![]() from SED fitting.
from SED fitting.
This paper is organized as follows. In Sect. 2, we describe the observations and data reduction. In Sect. 3, we present the spatial distribution of molecular hydrogen around T Tau N and the velocity distribution of the gas. Section 4 discusses the geometry of the star-disk-envelope system and Sect. 5 examines the H2 excitation mechanism. In Sect. 6, we consider the possible implications for T Tau S, and finally, we draw conclusions in Sect. 7.
T Tau was observed with the ESO-VLT as part of the SINFONI science
verification program on the nights of 2004 October 30th and November 2nd. SINFONI is a near-infrared
(NIR) integral field spectrograph working in combination with adaptive optics
(Eisenhauer et al. 2003). Observations of the
region around the T Tau triple star system were obtained in the K-band using
the 3
![]() 2 field of view optics (100 mas pixel
scale) centered on the northern component. T Tau N (mV = 9.6) itself was used
as the guide star, producing diffraction limited spatial resolution.
The 2D image on the sky was sliced into 32 slitlets which were then dispersed
onto a 2k
2 field of view optics (100 mas pixel
scale) centered on the northern component. T Tau N (mV = 9.6) itself was used
as the guide star, producing diffraction limited spatial resolution.
The 2D image on the sky was sliced into 32 slitlets which were then dispersed
onto a 2k ![]() 2k detector. The spectrograph provides a spectral resolution of 4000 in the K-band. The observations were carried out using a five-point nodding pattern with
individual exposure times of 3 s and 20 co-adds and a total integration
time on source of 30 min. The nodding pattern was that of a box with one arcsecond width
centered on T Tau N. The resulting mosaic has a field of view of
approximately 4
2k detector. The spectrograph provides a spectral resolution of 4000 in the K-band. The observations were carried out using a five-point nodding pattern with
individual exposure times of 3 s and 20 co-adds and a total integration
time on source of 30 min. The nodding pattern was that of a box with one arcsecond width
centered on T Tau N. The resulting mosaic has a field of view of
approximately 4
![]() .
Sky frames with the same exposure times were obtained
within the nodding cycle.
.
Sky frames with the same exposure times were obtained
within the nodding cycle.
Data reduction and reconstruction of the 3D cubes were carried out using the SINFONI pipeline (version 1.3.0) provided by ESO. The 2D raw frames were corrected for sky background, flat field effects and optical distortions. Bad pixels and cosmic rays were identified and the frames were calibrated in wavelength. Then, the 3D cubes were constructed using calibration data of the positions and distances of the slitlets on the detector. The cubes within the nodding cycle were aligned spatially and coadded plane by plane to create the final mosaic. Since the total exposure time is less at the outer regions of the mosaic than in the centre we scaled the flux at all spatial points to an exposure time of 3 s. The final 3D cube stores the spatial information in the x- and y-directions and the spectral information along the z-direction. To improve the signal-to-noise ratio, each spectral plane was smoothed with a 3 by 3 boxcar in the spatial domain.
The B9 standard star Hip025657 was observed under the same conditions and
similar airmass as T Tau and with the same instrumental setup, in order to correct for atmospheric
absorption. The spectrum was extracted after the
data had been reduced following the same recipe as for T Tau. The spectrum of
Hip025657 is featureless except for Br![]() in absorption. We removed this
feature and replaced it by a linear fit to the surrounding
continuum. Subsequently, the spectrum was divided by a blackbody function of
T=11 000 K and normalized. Dividing each spectrum of the science cube by the
corrected standard star spectrum removed
telluric absorption features in the T Tau spectra very effectively.
in absorption. We removed this
feature and replaced it by a linear fit to the surrounding
continuum. Subsequently, the spectrum was divided by a blackbody function of
T=11 000 K and normalized. Dividing each spectrum of the science cube by the
corrected standard star spectrum removed
telluric absorption features in the T Tau spectra very effectively.
Flux calibration was also performed using Hip025657 (mK = 7.443). The
conversion factor between counts s-1 and erg s-1 cm-2 ![]() m-1 sr-1 was found by dividing the K-band flux of the star (4.1
m-1 sr-1 was found by dividing the K-band flux of the star (4.1 ![]() 10-7 erg s-1 cm-2
10-7 erg s-1 cm-2 ![]() m-1
m-1 ![]() 10-mK/2.5, Campins et al. 1985) by the mean counts per second of the standard star spectrum within
10-mK/2.5, Campins et al. 1985) by the mean counts per second of the standard star spectrum within
![]() m and
dividing by the pixel area in steradians.
m and
dividing by the pixel area in steradians.
![\begin{figure}
\par\includegraphics[width=8.5cm,clip]{9770fig1.ps}\end{figure}](/articles/aa/full/2008/34/aa09770-08/img16.gif) |
Figure 1: H2 v=1-0 S(1) emission in the T Tauri system. The color scheme indicate the flux level in erg s-1 cm-2 sr-1. The positions of T Tau N and T Tau S are marked with white circles. The white box outlines the close-up view of the ring-like structure around T Tau N shown in Fig. 2. |
| Open with DEXTER | |
We show the spatial distribution of emission in the H2 v=1-0 S(1) rovibrational line at 2.12 ![]() m in Fig. 1. The image is dominated by strong H2 emission south of T Tau N, close to T Tau S. This emission feature was also detected by Herbst et al. (2007) and Beck et al. (2008).
The origin of the strong emission south of T Tau N is believed to be outflows
from one or more of the stellar components (Herbst et al. 2007) and will be the
subject of a subsequent paper (Gustafsson et al., in preparation).
In this paper, we focus on the weaker H2 emission found very close to T Tau N. The weak feature is seen to extend all around the star in a ring-like structure. The morphology of the H2 emission in our data is fully consistent with the map recently published by Beck et al. (2008). They also
detected the weak ring-like structure although they
did not mention it. Their data were obtained October 2005, which indicates that the emission feature is stable on at least a 1-year timescale.
m in Fig. 1. The image is dominated by strong H2 emission south of T Tau N, close to T Tau S. This emission feature was also detected by Herbst et al. (2007) and Beck et al. (2008).
The origin of the strong emission south of T Tau N is believed to be outflows
from one or more of the stellar components (Herbst et al. 2007) and will be the
subject of a subsequent paper (Gustafsson et al., in preparation).
In this paper, we focus on the weaker H2 emission found very close to T Tau N. The weak feature is seen to extend all around the star in a ring-like structure. The morphology of the H2 emission in our data is fully consistent with the map recently published by Beck et al. (2008). They also
detected the weak ring-like structure although they
did not mention it. Their data were obtained October 2005, which indicates that the emission feature is stable on at least a 1-year timescale.
A close-up of the immediate surroundings of T Tau N appears in
Fig. 2. H2 emission is found as close as 0
![]() 1 arcsec (
1 arcsec (![]() 15 AU, assuming a
distance of 140 pc) and is seen to extend out to
15 AU, assuming a
distance of 140 pc) and is seen to extend out to ![]() 0
0
![]() 7 (100 AU) from the star. We do not
detect H2 emission above the noise closer to the star than
0
7 (100 AU) from the star. We do not
detect H2 emission above the noise closer to the star than
0
![]() 1. Molecular hydrogen does not appear in the spectrum of T Tau N (Fig. 3) and is an exclusively extended phenomenon.
1. Molecular hydrogen does not appear in the spectrum of T Tau N (Fig. 3) and is an exclusively extended phenomenon.
Emission from other H2 lines than the 1-0 S(1) transition has also been
detected (Fig. 3). The 1-0 Q(1) line at 2.406 ![]() m is found to have
roughly the same spatial distribution as the S(1) line. Other Q-branch lines are present as
well, but the correction for atmospheric absorption is challenging
in this spectral and spatial region and may introduce errors. The 1-0 S(0) line (2.2223
m is found to have
roughly the same spatial distribution as the S(1) line. Other Q-branch lines are present as
well, but the correction for atmospheric absorption is challenging
in this spectral and spatial region and may introduce errors. The 1-0 S(0) line (2.2223 ![]() m) also
appears in the spectrum. This line is, however, weak and
the powerful continuum emission from T Tau N limits the line
detection at a level of 3
m) also
appears in the spectrum. This line is, however, weak and
the powerful continuum emission from T Tau N limits the line
detection at a level of 3![]() above the noise level to pixels located in
the outer ring structure at r>70 AU. At larger radii, the S(0) emission
shows a similar spatial distribution to the S(1) line. The v=2-1 S(1) line
(2.2447
above the noise level to pixels located in
the outer ring structure at r>70 AU. At larger radii, the S(0) emission
shows a similar spatial distribution to the S(1) line. The v=2-1 S(1) line
(2.2447 ![]() m) is tentatively detected at a 2
m) is tentatively detected at a 2![]() level at a few locations in the outer region of the ring structure at r>80 AU.
level at a few locations in the outer region of the ring structure at r>80 AU.
![\begin{figure}
\par\includegraphics[width=10.3cm,clip]{9770fig2.ps}\end{figure}](/articles/aa/full/2008/34/aa09770-08/img17.gif) |
Figure 2: Top: H2 v=1-0 S(1) emission surrounding T Tau N. The color scheme indicate the flux level in erg s-1 cm-2 sr-1. Positions where no H2 emission is detected are shown in black and the position of T Tau N is marked by a white circle. The mask outlining the region used for further analysis is indicated by the black line. The strong emission region south-west of T Tau N is excluded because it is most likely related to outflows from T Tau S (see text). Centre: the derived heliocentric radial velocity of the H2 emission relative to the rest velocity of T Tau N. Bottom: uncertainties in the radial velocities. |
| Open with DEXTER | |
The total flux of the H2 v=1-0 S(1) in the structure is found by summing
all light within a mask, the extent of which is shown in Fig. 2.
We have chosen a rather conservative mask in order to avoid confusion with
emission features that may have a different origin. Thus,
the mask excludes regions where the emission is weaker than 4 ![]() 10-4 erg s-1 cm-2 sr-1 as well as the strong emission region south-west of T Tau N which is most likely caused by an outflow from one of the T Tau S stars
(Herbst et al. 2007). The total flux within the mask is 1.8
10-4 erg s-1 cm-2 sr-1 as well as the strong emission region south-west of T Tau N which is most likely caused by an outflow from one of the T Tau S stars
(Herbst et al. 2007). The total flux within the mask is 1.8 ![]() 0.3
0.3 ![]() 10-14 erg s-1 cm-2. The uncertainty is the formal uncertainty on the total flux calculated using the flux uncertainty in the pixels included in the sum.
This uncertainty does not take into account
that the estimated flux depends on the chosen mask and that the exact shape
and extent of the ring-like structure is difficult to quantify because of
other H2 features nearby. We estimate that the uncertainty due to the
mask may amount to 30%. The flux of the v=1-0 Q(1) line and the upper
limits to the flux of other H2 lines appear in Table 1.
10-14 erg s-1 cm-2. The uncertainty is the formal uncertainty on the total flux calculated using the flux uncertainty in the pixels included in the sum.
This uncertainty does not take into account
that the estimated flux depends on the chosen mask and that the exact shape
and extent of the ring-like structure is difficult to quantify because of
other H2 features nearby. We estimate that the uncertainty due to the
mask may amount to 30%. The flux of the v=1-0 Q(1) line and the upper
limits to the flux of other H2 lines appear in Table 1.
The total flux in the v=1-0 S(1) line is similar to the amount of
H2 emission at the same radial velocity as the star
detected in the circumstellar environment of other T Tauri stars, where it is
believed to originate from disks within 100 AU (Ramsay Howat & Greaves 2007; Bary et al. 2008,2003; Weintraub et al. 2005). The H2 line flux previously measured in disks ranges from 7 ![]() 10-16-1.5
10-16-1.5 ![]() 10-14 erg s-1 cm-2.
10-14 erg s-1 cm-2.
In our data, we have full access to the spectral distribution of the emitting
gas. Although SINFONI only has a spectral resolution of ![]() 75 km s-1 in the K-band, it is possible to determine the peak position of the lines
with much higher accuracy through line fitting. We have derived the radial
velocity corresponding to every H2 emitting position (see Fig. 2) by
fitting a Gaussian profile to the unresolved line profiles on a pixel by pixel
basis. The velocities in Fig. 2 have been corrected for the Earth's motion
toward T Tau at the time of observation and are quoted with respect to the heliocentric
velocity of T Tau N of 19.1
75 km s-1 in the K-band, it is possible to determine the peak position of the lines
with much higher accuracy through line fitting. We have derived the radial
velocity corresponding to every H2 emitting position (see Fig. 2) by
fitting a Gaussian profile to the unresolved line profiles on a pixel by pixel
basis. The velocities in Fig. 2 have been corrected for the Earth's motion
toward T Tau at the time of observation and are quoted with respect to the heliocentric
velocity of T Tau N of 19.1 ![]() 1.2 km s-1 (Hartmann et al. 1986). The
velocity map in Fig. 2 shows small velocity variations between
-10 km s-1 and +10 km s-1 with respect to the intrinsic velocity of T Tau N within the ring structure. These velocities are consistent with the data from Beck et al. (2008) who also measure velocities close to the systemic velocity at this location (see their Fig. 11).
There is a tendency for a radial gradient with the velocities being positive (5-10 km s-1) close to the star and negative (-5 km s-1) further out. However, the uncertainty in the derived velocities are larger close to the star than further out due to the increased continuum
emission in the inner region (Fig. 2). This makes any conclusion on
the radial variation of velocities rather uncertain.
There is no evidence of Keplerian rotation of the disk. However, if the
inclination of the disk is the same as the star itself,
1.2 km s-1 (Hartmann et al. 1986). The
velocity map in Fig. 2 shows small velocity variations between
-10 km s-1 and +10 km s-1 with respect to the intrinsic velocity of T Tau N within the ring structure. These velocities are consistent with the data from Beck et al. (2008) who also measure velocities close to the systemic velocity at this location (see their Fig. 11).
There is a tendency for a radial gradient with the velocities being positive (5-10 km s-1) close to the star and negative (-5 km s-1) further out. However, the uncertainty in the derived velocities are larger close to the star than further out due to the increased continuum
emission in the inner region (Fig. 2). This makes any conclusion on
the radial variation of velocities rather uncertain.
There is no evidence of Keplerian rotation of the disk. However, if the
inclination of the disk is the same as the star itself, ![]()
![]() ,
the
radial velocity component of Keplerian rotation around a
2
,
the
radial velocity component of Keplerian rotation around a
2 ![]() star is only
star is only ![]() 5 km s-1 at 10 AU and
5 km s-1 at 10 AU and ![]() 2 km s-1 at 100 AU. Such small velocity differences within the disk would be difficult to detect with
the present data.
2 km s-1 at 100 AU. Such small velocity differences within the disk would be difficult to detect with
the present data.
In order to improve the signal-to-noise ratio, we constructed a global H2 profile of the ring-like structure by adding all spectral profiles of H2 v=1-0 S(1) emitting positions within the mask in Fig. 2. This also allows a direct comparison with previous
spatially unresolved measurements of H2 in the circumstellar environment of
T Tauri stars. The global line profile appears in Fig. 4
together with a Lorentzian fit. The Lorentzian fitting function provides the
best match to the instrumental profile of SINFONI which
dominates the unresolved H2 profile. The profile is seen to peak
close to the rest velocity of T Tau N. From the Lorentzian fit we find the peak
velocity to be -2.5 ![]() 2.1 km s-1 (
2.1 km s-1 (![]() uncertainty). Considering the
uncertainty in the rest velocity of T Tau N of 1.2 km s-1 (Hartmann et al. 1986),
the velocity of the H2 emission is consistent with the rest velocity of the star within the errors. The same was found to be true of the H2 emission from disks around other stars
(Bary et al. 2008; Ramsay Howat & Greaves 2007; Carmona et al. 2008; Bary et al. 2003).
uncertainty). Considering the
uncertainty in the rest velocity of T Tau N of 1.2 km s-1 (Hartmann et al. 1986),
the velocity of the H2 emission is consistent with the rest velocity of the star within the errors. The same was found to be true of the H2 emission from disks around other stars
(Bary et al. 2008; Ramsay Howat & Greaves 2007; Carmona et al. 2008; Bary et al. 2003).
We now examine the origin of the H2 emission around T Tau N. The ring-like shape of the emission can be created by several scenarios. We consider the following possibilities: 1) an outflow, 2) shocks created by a wide-angled wind hitting a disk or cavity walls, 3) a photo-evaporating wind from a disk viewed almost face-on (Font et al. 2004; Hollenbach et al. 1994), 4) a photodissociation region, or 5) UV/X-ray heating of a disk (Nomura et al. 2007). In this section, we consider the geometry of the system and in Sect. 5, we examine what excitation mechanisms can reproduce the H2 line flux and ratios.
Outflows from T Tauri stars are known to be complex, often showing two velocity components with different spatial characteristics. Observations of both forbidden emission lines (Bacciotti et al. 2000) and molecular hydrogen (Takami et al. 2006) have shown that outflows typically consist of a collimated high velocity (60-200 km s-1) jet and a less collimated low velocity (0-30 km s-1) component, i.e. a wide-angled wind. At first glance, the small line-of-sight velocities measured in the ring argue against a collimated jet. Although a jet viewed almost pole-on could create a circular emission feature, the velocities associated with such a jet are much higher than observed here. It is, however, possible that we see shocks from a wide-angle wind interacting with either the outer walls of a bi-conical cavity cleared out by the outflow or a flared disk (Figs. 5a or b). The existence of a cavity in an envelope around T Tau N was suggested by Momose et al. (1996) and the reflected light images of Stapelfeldt et al. (1998). In this picture, a wide-angle wind creates oblique shocks when interacting with the molecular environment. Oblique shocks result in low shock velocities, since it is only the normal component of the velocity with respect to the gas that is thermalized. Furthermore, the measured velocities will be even lower, since only the line-of-sight velocity is detected here.
![\begin{figure}
\par\includegraphics[width=8.6cm,clip]{9770fig3.ps}\end{figure}](/articles/aa/full/2008/34/aa09770-08/img21.gif) |
Figure 3:
K-band spectrum of T Tau N and of a pixel within the mask in
Fig. 2 located (0
|
| Open with DEXTER | |
Table 1: Total flux of H2 lines within mask.
![\begin{figure}
\par\includegraphics[width=8.1cm,clip]{9770fig4.ps} \end{figure}](/articles/aa/full/2008/34/aa09770-08/img24.gif) |
Figure 4:
H2 v=1-0 S(1) line profile integrated over the ring structure
(diamonds with 1 |
| Open with DEXTER | |
![\begin{figure}
\par\includegraphics[width=5.4cm,clip]{9770fig5.ps}\end{figure}](/articles/aa/full/2008/34/aa09770-08/img25.gif) |
Figure 5: Excitation scenarios in the T Tau N-disk-envelope system. a) A wide-angle outflow hits the walls of a cleared out cavity in the surrounding envelope, b) a wide-angle outflow impinges on a flared disk and creates shocks, c) UV + X-ray irradiation from T Tau N heats a flared disk. |
| Open with DEXTER | |
Another possibility is that the emission is linked to irradiation of a nearly face-on disk around T Tau N (Fig. 5c). We proceed by investigating the circumstellar environment of T Tau N through spectral energy distribution (SED) modeling to find evidence of the size of the disk and envelope. We use the precomputed grid of radiative transfer models of Robitaille et al. (2007). Their models include contributions from a circumstellar accretion disk, an infalling envelope and an outflow cavity. The models span a wide range of parameter space. The SED is calculated for each set of model parameters for comparison with observational data. Using fluxes of T Tau N from the literature, we fit the optical and infrared data with the models in order to find the range of physical parameters that fit the SED best.
![\begin{figure}
\par\includegraphics[width=9cm,clip]{9770fig6.ps}\end{figure}](/articles/aa/full/2008/34/aa09770-08/img27.gif) |
Figure 6:
Spectral energy distribution of T Tau N and model curves. The
data points include those of this work and Herbst et al. (1997); Weaver & Jones (1992); Beckwith & Sargent (1991); Kenyon & Hartmann (1995); Hogerheijde et al. (1997); Andrews & Williams (2005); Herbst et al. (2007).
Plus-signs indicate resolved data of T Tau N, diamonds indicate
where T Tau S and T Tau N are unresolved and the flux of T Tau S dominates. The K-band flux from this work is marked with a triangle. The model is found from fitting to data at
|
| Open with DEXTER | |
The SED appears in Fig. 6. The observations include those of
Herbst et al. (1997); Weaver & Jones (1992); Beckwith & Sargent (1991); Kenyon & Hartmann (1995); Hogerheijde et al. (1997); Andrews & Williams (2005); Herbst et al. (2007).
T Tau N shows brightness varitations of 0.2 mag in the K and L bands
(Beck et al. 2004), which can explain the spread in flux values that the
various authors find. We have included measurements from different epochs at
optical and infrared wavelengths, in order to average out the effect of this
variability. In the model fit, we have only used data points at
![]() m, for
which the T Tau N component is resolved. At longer wavelengths, the north and south
components of the T Tau triple system are unresolved and T Tau S
dominates (Ghez et al. 1991). We assume that
m, for
which the T Tau N component is resolved. At longer wavelengths, the north and south
components of the T Tau triple system are unresolved and T Tau S
dominates (Ghez et al. 1991). We assume that
![]() (White & Ghez 2001).
(White & Ghez 2001).
The Robitaille grid resulted in a wide range of parameters that produced a reasonable fit to the SED. In order to further constrain the parameter space, we used the spectral information on T Tau N, a ![]() 1 Myr old K0 star with
1 Myr old K0 star with
![]() ,
,
![]() K (White & Ghez 2001). Thus, we chose to consider only those
models in which the stellar parameters fall within the following ranges,
1.5<
K (White & Ghez 2001). Thus, we chose to consider only those
models in which the stellar parameters fall within the following ranges,
1.5<
![]() 2.5, 4000 K <
2.5, 4000 K <
![]() 6000 K, 0.1 Myr < age < 2 Myr. The
best fit model which satisfies these criteria appears in Fig. 6.
For the 50 models that best fit the data, only four models satisfy
the stellar restrictions of T Tau N. These four models have the same values
for all parameters except the
inclination angle of the disk. The model parameters are listed in
Table 2. The inclination is poorly determined, but is found to
be less than 65
6000 K, 0.1 Myr < age < 2 Myr. The
best fit model which satisfies these criteria appears in Fig. 6.
For the 50 models that best fit the data, only four models satisfy
the stellar restrictions of T Tau N. These four models have the same values
for all parameters except the
inclination angle of the disk. The model parameters are listed in
Table 2. The inclination is poorly determined, but is found to
be less than 65![]() .
.
SEDs only contain a limited amount of information about the distribution of
circumstellar material, and it is easy
to overinterpret the results of model fitting. Nevertheless, our
results show that the T Tau N system is consistent with an accreting star surrounded by a
disk and torus-like envelope with an opening angle of ![]()
![]() .
The
disk is likely to have an outer radius of 85 AU consistent with the detection
of H2 at a radius of
.
The
disk is likely to have an outer radius of 85 AU consistent with the detection
of H2 at a radius of ![]() 100 AU. It also shows a large degree of flaring.
The inclination of the disk cannot be well constrained by the SED-modeling
but is consistent with a low inclination of
100 AU. It also shows a large degree of flaring.
The inclination of the disk cannot be well constrained by the SED-modeling
but is consistent with a low inclination of ![]()
![]() ,
as found by
Herbst et al. (1997). The model is also consistent with the suggestion of
Stapelfeldt et al. (1998) that an outflow at PA = 300
,
as found by
Herbst et al. (1997). The model is also consistent with the suggestion of
Stapelfeldt et al. (1998) that an outflow at PA = 300![]() and inclination of
45
and inclination of
45![]() has blown out a cavity. Note that the disk accretion rate is
higher than the observed accretion rate of
(1.4-5.9)
has blown out a cavity. Note that the disk accretion rate is
higher than the observed accretion rate of
(1.4-5.9) ![]()
![]() yr-1
based on the Br
yr-1
based on the Br![]() line strength (Beck et al. 2004).
This is most likely due to inconsistencies in the radiative transfer models
used in the Robitaille models, which systematically overestimate the accretion rate. This effect was already noted in Robitaille et al. (2007). Thus, the accretion rate inferred from the
SED modeling should be considered with some caution.
line strength (Beck et al. 2004).
This is most likely due to inconsistencies in the radiative transfer models
used in the Robitaille models, which systematically overestimate the accretion rate. This effect was already noted in Robitaille et al. (2007). Thus, the accretion rate inferred from the
SED modeling should be considered with some caution.
Table 2: SED model parameters.
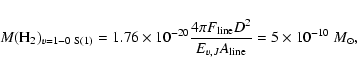
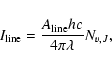
Assuming optically thin emission, the mass of H2 v=1-0 S(1) emitting gas is (Bary et al. 2003)
These arguments suggest that T Tau N has a flared disk with radius 85-100 AU and mass
![]() .
We propose that the observed H2 emission comes from the gaseous disk atmosphere or alternatively from the torus-like envelope that is also present around T Tau N according to the SED. The reason that T Tau N is not at the centre of the H2 emission (Fig. 2) could be due to the fact that we do not see the disk-envelope system exactly
face-on. An inclination of 20-40
.
We propose that the observed H2 emission comes from the gaseous disk atmosphere or alternatively from the torus-like envelope that is also present around T Tau N according to the SED. The reason that T Tau N is not at the centre of the H2 emission (Fig. 2) could be due to the fact that we do not see the disk-envelope system exactly
face-on. An inclination of 20-40![]() would cause emission from a
circular structure to appear elliptical. Assuming that we only see emission
from the surface facing toward us projection effects would furthermore make
the nearest side of a disk appear narrower than the farther side. This
would shift the projected position of the central star away from the centre of
emission. A detailed modeling of the spatial
distribution of the emission is, however, outside the scope of this paper.
would cause emission from a
circular structure to appear elliptical. Assuming that we only see emission
from the surface facing toward us projection effects would furthermore make
the nearest side of a disk appear narrower than the farther side. This
would shift the projected position of the central star away from the centre of
emission. A detailed modeling of the spatial
distribution of the emission is, however, outside the scope of this paper.
If the value of 85-100 AU reflects the true size of the disk,
why has the disk not yet been detected in scattered light?
The simplest explanation is that the disk is small (r < 0
![]() 7) and the
flux contrast between the star and disk is large, making detection
difficult. Infrared observations of scattered light from nearly face-on disks (circumstellar and
circumbinary) around other T Tauri stars have shown that the total flux from
a disk is only 1-2 percent of the stellar flux (McCabe et al. 2002; Weinberger et al. 2002). Stapelfeldt et al. (1998) and Mayama et al. (2006) observed reflected light in T Tau
at optical and infrared wavelengths, respectively, but did not find evidence
of the disk around T Tau N. However, Mayama et al. (2006) used a coronographic
mask with a diameter of
7) and the
flux contrast between the star and disk is large, making detection
difficult. Infrared observations of scattered light from nearly face-on disks (circumstellar and
circumbinary) around other T Tauri stars have shown that the total flux from
a disk is only 1-2 percent of the stellar flux (McCabe et al. 2002; Weinberger et al. 2002). Stapelfeldt et al. (1998) and Mayama et al. (2006) observed reflected light in T Tau
at optical and infrared wavelengths, respectively, but did not find evidence
of the disk around T Tau N. However, Mayama et al. (2006) used a coronographic
mask with a diameter of ![]() 0
0
![]() 5-0
5-0
![]() 6, which is only marginally smaller
than the size of the disk found in this paper. The disk would therefore in any
case be difficult to see in their data. The detection of the disk from the
data of Stapelfeldt et al. (1998) could be compromised by artefacts arising from
the PSF subtraction.
6, which is only marginally smaller
than the size of the disk found in this paper. The disk would therefore in any
case be difficult to see in their data. The detection of the disk from the
data of Stapelfeldt et al. (1998) could be compromised by artefacts arising from
the PSF subtraction.
After studying the location of the circumstellar material and the H2 emitting gas, we now turn to the H2 excitation mechanism. The near-infrared rovibrational lines of H2 can be excited through different processes. The two main mechanisms are (i) shocks (Figs. 5a and b) and (ii) UV + X-ray radiation (Fig. 5c). In the former case, the H2 molecules are thermally excited by the passing shock wave and the H2 spectrum is characterized by a
single excitation temperature. In the latter case, the UV and X-ray radiation
may contribute both to the heating of the gas and to electronic excitation of
H2. The near-infrared H2 emission may therefore
contain a contribution from both thermal excitation as well as non-thermal
radiative decay from excited electronic states (fluorescence).
These two excitation mechanisms can be distinguished through both the line
strengths and the line ratios of the
observed H2. Traditionally, the ratios
![]() and
and
![]() are used. These ratios also provide a
diagnostic for whether the thermal or non-thermal contribution dominates,
since higher vibrational bands,
are used. These ratios also provide a
diagnostic for whether the thermal or non-thermal contribution dominates,
since higher vibrational bands, ![]() ,
are more densely populated by fluorescence than by thermal excitation. In the following, we will concentrate on the two excitation processes (i) shocks and (ii) UV + X-ray irradiation.
,
are more densely populated by fluorescence than by thermal excitation. In the following, we will concentrate on the two excitation processes (i) shocks and (ii) UV + X-ray irradiation.
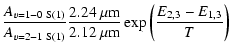
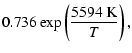
In the first process, shocks, a super-Alfvenic shock wave rapidly heats the gas
to temperatures of ![]() 1000-3000 K. The temperature reached depends on the
velocity of the shock, as well as the pre-shock conditions in the ambient
medium, such as density, magnetic field, chemistry etc. The
1000-3000 K. The temperature reached depends on the
velocity of the shock, as well as the pre-shock conditions in the ambient
medium, such as density, magnetic field, chemistry etc. The
![]() ratio depends on the temperature, since the populations
are assumed to be in local thermodynamic equilibrium (LTE). The higher the
temperature, the larger the relative population in higher vibrational bands.
We estimate the range of the
ratio depends on the temperature, since the populations
are assumed to be in local thermodynamic equilibrium (LTE). The higher the
temperature, the larger the relative population in higher vibrational bands.
We estimate the range of the
![]() ratio that
shocks are able to produce considering the temperature range 1000-3000 K reached during the passing of the shock. For an optically thin transition, the line intensity is
ratio that
shocks are able to produce considering the temperature range 1000-3000 K reached during the passing of the shock. For an optically thin transition, the line intensity is
 |
(2) |
| (3) |
 |
= |  |
|
| = |  |
(4) |
From these estimates, it is clear that a range of shock temperatures can
reproduce the line ratios observed around T Tau N (Table 1). However, since the
observations give us only lower limits to the line ratios, we are not able to
constrain the shock temperature and thus the underlying physical parameters
very well. We therefore turn to the total line flux.
Shock models show that the H2 v=1-0 S(1) surface brightness in
Fig. 2 can be produced in different
density regions of the circumstellar material. The required density is tightly
correlated with the impact velocity of the
shock front. This means that the H2 emission can arise in environments with
pre-shock density of
![]() 104 cm-3 if the shock velocity
is
104 cm-3 if the shock velocity
is ![]() 40-50 km s-1 while a shock front propagating at only
40-50 km s-1 while a shock front propagating at only ![]() 10 km s-1 is
sufficient to excite the H2 if the pre-shock density is
10 km s-1 is
sufficient to excite the H2 if the pre-shock density is
![]() cm-3 (L. E. Kristensen, private communication).
cm-3 (L. E. Kristensen, private communication).
From models of T Tauri stars with disk and envelope masses resembling those of
T Tau N, it is evident that the high density regime of
![]() cm-3 is associated with the upper layers of the disk while
densities of
cm-3 is associated with the upper layers of the disk while
densities of
![]() cm-3 are found in the envelope and in a thin
transition zone between the disk atmosphere and the outflow cavity, i.e. the
cavity walls (Whitney et al. 2003; Crapsi et al. 2008). Independent of where the
excitation takes place, the outflow or wind must impact the gas at a small angle, unless
the disk is highly flared. Thus, the flow velocity
must be much higher than the shock velocity, since it is only the velocity
component perpendicular to the shock surface that contributes to the
shock. Assuming an
impact angle of 10
cm-3 are found in the envelope and in a thin
transition zone between the disk atmosphere and the outflow cavity, i.e. the
cavity walls (Whitney et al. 2003; Crapsi et al. 2008). Independent of where the
excitation takes place, the outflow or wind must impact the gas at a small angle, unless
the disk is highly flared. Thus, the flow velocity
must be much higher than the shock velocity, since it is only the velocity
component perpendicular to the shock surface that contributes to the
shock. Assuming an
impact angle of 10![]() -20
-20![]() ,
a flow velocity of 120-230 km s-1 is
required to create a shock of 40 km s-1. Such velocities are found in the
collimated jets from T Tauri stars. However, the SED indicates that the cavity
opening angle is large (
,
a flow velocity of 120-230 km s-1 is
required to create a shock of 40 km s-1. Such velocities are found in the
collimated jets from T Tauri stars. However, the SED indicates that the cavity
opening angle is large (![]()
![]() ,
Table 2) and thus it
is difficult to see how a collimated jet should be able to hit the cavity walls. On the other hand, a shock velocity of 10 km s-1 can be attained with a flow velocity of 30-60 km s-1 and
an impact angle of 10
,
Table 2) and thus it
is difficult to see how a collimated jet should be able to hit the cavity walls. On the other hand, a shock velocity of 10 km s-1 can be attained with a flow velocity of 30-60 km s-1 and
an impact angle of 10![]() -20
-20![]() .
Such velocities may be found in
a wide-angled low velocity wind characteristic of T Tauri stars
(Bacciotti et al. 2000; Takami et al. 2006).
.
Such velocities may be found in
a wide-angled low velocity wind characteristic of T Tauri stars
(Bacciotti et al. 2000; Takami et al. 2006).
In summary, if shocks are the primary cause of the H2 excitation, it seems more likely that they arise from the interaction of a wide-angled wind with the upper layers of a flared disk than with cavity walls carved in a circumstellar envelope. We cannot exclude that the H2 excitation arises from the cavity walls, but this scenario seems to require that the high velocity jet in T Tau N be less collimated than in other sources.
We now turn to excitation process (ii), irradiation by UV-photons and X-rays
(Fig. 5c). In their models of fluorescent excitation of H2, Black & van Dishoeck (1987) find
![]() and
and
![]() .
This is incompatible with our
data (Table 1) and shows that fluorescence alone cannot explain
the observations. A thermal component is necessary in order to reproduce the
line ratios. Le Petit et al. (2006) have shown that the
ratio
.
This is incompatible with our
data (Table 1) and shows that fluorescence alone cannot explain
the observations. A thermal component is necessary in order to reproduce the
line ratios. Le Petit et al. (2006) have shown that the
ratio
![]() can be much larger than 2 in a
photon-dominated region (PDR) if
can be much larger than 2 in a
photon-dominated region (PDR) if
![]() cm-3 and the incident
far-ultraviolet radiation field is stronger than
cm-3 and the incident
far-ultraviolet radiation field is stronger than ![]() 104 times the average
in the interstellar medium. In such high density regions, collisions of H2in vibrationally excited states resulting from fluorescence with atomic H tend
to thermalize the rovibrational states. These conditions may very well apply to a dense
circumstellar disk irradiated by the central star.
The brightness of the v=1-0 S(1) line in the model is found to be larger than
104 times the average
in the interstellar medium. In such high density regions, collisions of H2in vibrationally excited states resulting from fluorescence with atomic H tend
to thermalize the rovibrational states. These conditions may very well apply to a dense
circumstellar disk irradiated by the central star.
The brightness of the v=1-0 S(1) line in the model is found to be larger than
![]() 5
5 ![]() 10-4 erg s-1 cm-2 sr-1 in a PDR viewed face on (Le Petit et al. 2006), which is consistent with our
data. The H2 brightness around T Tau N is larger than this
value out to distances of
10-4 erg s-1 cm-2 sr-1 in a PDR viewed face on (Le Petit et al. 2006), which is consistent with our
data. The H2 brightness around T Tau N is larger than this
value out to distances of ![]() 80 AU (Fig. 2). The H2 emission
may thus be caused by UV-irradiation from T Tau N creating a PDR at the dense
surface of the disk. Such a PDR would create fluorescent H2 lines in the UV and
infrared H2 lines composed of contributions from both fluorescence and
thermal excitation. Walter et al. (2003) found extended fluorescent H2 emission in
the UV around T Tau N. This seems to support our
conclusion. Herczeg et al. (2006), however, did not find fluorescent H2 emission
in the UV extending more than 0
80 AU (Fig. 2). The H2 emission
may thus be caused by UV-irradiation from T Tau N creating a PDR at the dense
surface of the disk. Such a PDR would create fluorescent H2 lines in the UV and
infrared H2 lines composed of contributions from both fluorescence and
thermal excitation. Walter et al. (2003) found extended fluorescent H2 emission in
the UV around T Tau N. This seems to support our
conclusion. Herczeg et al. (2006), however, did not find fluorescent H2 emission
in the UV extending more than 0
![]() 1 from T Tau N.
Saucedo et al. (2003) reported fluorescent H2 emission North-East and
South-West of T Tau N at a distance of
1 from T Tau N.
Saucedo et al. (2003) reported fluorescent H2 emission North-East and
South-West of T Tau N at a distance of ![]() 50 AU, which is consistent with
pumping by stellar Ly
50 AU, which is consistent with
pumping by stellar Ly![]() emission. They do, however, find that the
fluorescent line needs to be heated before being pumped and suggest that an
outflow must be the heating mechanism.
emission. They do, however, find that the
fluorescent line needs to be heated before being pumped and suggest that an
outflow must be the heating mechanism.
Nomura et al. (2007) constructed models of H2 emission from a disk irradiated by
both X-rays and UV photons from a central T Tauri star. For a model with a 0.5 ![]() ,
,
![]() K central star with X-ray luminosity of
K central star with X-ray luminosity of
![]() erg s-1 and UV excess like TW Hydrae, they find v=1-0 S(1) line
fluxes of 0.1-20
erg s-1 and UV excess like TW Hydrae, they find v=1-0 S(1) line
fluxes of 0.1-20 ![]() 10-15 erg s-1 cm-2, depending on the size of the dust
grains. When the grain size increases the high-temperature region in the disk
shrinks and the line flux decreases.
The
10-15 erg s-1 cm-2, depending on the size of the dust
grains. When the grain size increases the high-temperature region in the disk
shrinks and the line flux decreases.
The
![]() ratio is always larger than 4 and
can be as high as 50 if UV radiation dominates.
In units of 10-14 erg s-1 cm-2, the estimated flux in the v=1-0 S(1) line for
a model using small dust grains is found to be
ratio is always larger than 4 and
can be as high as 50 if UV radiation dominates.
In units of 10-14 erg s-1 cm-2, the estimated flux in the v=1-0 S(1) line for
a model using small dust grains is found to be ![]() 0.1
when only X-ray irradiation is considered,
0.1
when only X-ray irradiation is considered, ![]() 1.3 with only
UV-irradiation and
1.3 with only
UV-irradiation and ![]() 2.1 when both X-rays and UV-irradiation are included
(Nomura et al. 2007). The estimated total flux from the disk around T Tau N is 1.8 on this scale,
suggesting that X-rays alone are not sufficient to produce
the observed H2 emission. UV-photons seem to dominate the excitation but a
combination of X-rays and UV-photons may be necessary in order to explain the
H2 flux as emission from a disk around T Tau N.
Note that T Tau has an X-ray luminosity of
2.1 when both X-rays and UV-irradiation are included
(Nomura et al. 2007). The estimated total flux from the disk around T Tau N is 1.8 on this scale,
suggesting that X-rays alone are not sufficient to produce
the observed H2 emission. UV-photons seem to dominate the excitation but a
combination of X-rays and UV-photons may be necessary in order to explain the
H2 flux as emission from a disk around T Tau N.
Note that T Tau has an X-ray luminosity of
![]()
![]() 1031 erg s-1
(Güdel et al. 2007) and UV-luminosity of
1031 erg s-1
(Güdel et al. 2007) and UV-luminosity of
![]()
![]() 1033 erg s-1,
corresponding to a large UV-excess of 0.7
1033 erg s-1,
corresponding to a large UV-excess of 0.7 ![]() (Calvet et al. 2004).
(Calvet et al. 2004).
It seems likely, then, that the UV-irradiation from T Tau N itself, with a possible X-ray contribution, is strong enough to produce the total H2 flux we see
around T Tau N. However, in their models, Nomura et al. (2007) find that most H2 emission in the v=1-0 S(1) line is emitted at a radius of 20 AU and that the emissivity decreases
with increasing distance from the star. The presence of H2 emission
extending to ![]() 100 AU around T Tau may be difficult to explain with models
of irradiation. A possible way to solve this is if
the disk is strongly flared. A large degree of flaring will allow more
UV-photons to reach the outer parts of the disk, thus increasing the excitation
in the outer regions.
100 AU around T Tau may be difficult to explain with models
of irradiation. A possible way to solve this is if
the disk is strongly flared. A large degree of flaring will allow more
UV-photons to reach the outer parts of the disk, thus increasing the excitation
in the outer regions.
If the disk is irradiated by UV photons and X-rays, a disk-wind may
be powered by photoevaporation of the disk
(Font et al. 2004; Johnstone et al. 1998; Störzer & Hollenbach 1999; Hollenbach et al. 1994). The high-energy
radiation (EUV + X-rays) ionizes hydrogen at the disk surface and heats the gas to
104 K. EUV photons cannot penetrate the ionization front and X-rays
heat only the inner disk and the surface layer (Nomura et al. 2007).
FUV photons, which are not absorbed by atomic hydrogen but mainly by dust,
penetrate much deeper and reach the disk surface. Here, they dissociate
molecular hydrogen and heat the neutral gas to about 400-4000 K. If the
thermal velocity of the neutral gas exceeds the escape velocity of the disk
surface, the gas flows outward. The flow is initially cylindrical but is
reoriented into a spherical flow by pressure gradients
(Font et al. 2004). Deeper in this photon-dominated region,
there is an H/H2 transition layer below which the gas is molecular. The
H2 v=1-0 S(1) line is emitted from the H/H2 transition layer, which is
close to the disk surface (Störzer & Hollenbach 1999). See Fig. 13 in
Dullemond et al. (2007) for an illustration of the structure of a
photoevaporative disk. Störzer & Hollenbach (1999) pointed out
that the ionization structure in a PDR with photoevaporation may differ from a
classical PDR because the material is not at rest. They also found that the H2 v=1-0 S(1) and v=2-1 S(1) lines are mainly collisionally excited, and that
fluorescence contributes only a small amount to the line intensities. The
![]() ratio is typically 5-10.
ratio is typically 5-10.
If the molecular hydrogen in the H/H2 transition layer gets hot enough to overcome the escape velocity it may contribute to the gas flow away from the disk. This could explain the small blueshift of the line profile in Fig. 4.
It is interesting to consider the scale of the mass loss due to
photoevaporation. A characteristic radius for thermal evaporation is (Dullemond et al. 2007):
 |
(5) |
Hollenbach et al. (1994) derived an estimate for the hydrogen mass loss rate due
to photoevaporation,
 |
(6) |
Two scenarios seem likely to explain the H2 emission: shocks from a
stellar wide-angle wind interacting with a flared disk, or irradiation from the
central star onto the disk. The latter may or may not be accompanied by
photoevaporative mass loss. The simplest way to distinguish between shock and PDR excitation is that the latter will create an atomic ionized layer giving rise
to hydrogen recombination lines. Furthermore, a PDR will display strong
emission from [OI] 63 ![]() m, 145
m, 145 ![]() m and [CII] 158
m and [CII] 158 ![]() m as well as
[FeII] 1.26
m as well as
[FeII] 1.26 ![]() m, 1.64
m, 1.64 ![]() m and [OI] 6300
m and [OI] 6300 ![]() and [SII]
6730
and [SII]
6730 ![]() in high density regions. We
examined the spatial distribution of the continuum-subtracted Br
in high density regions. We
examined the spatial distribution of the continuum-subtracted Br![]() line
to search for extended Br
line
to search for extended Br![]() emission in comparison to the presumably
pointlike PSF of the adjacent continuum. We did not find any
conclusive evidence for any spatial extension of the Br
emission in comparison to the presumably
pointlike PSF of the adjacent continuum. We did not find any
conclusive evidence for any spatial extension of the Br![]() line.
This is consistent with Kasper et al. (2002), who found that extended
Br
line.
This is consistent with Kasper et al. (2002), who found that extended
Br![]() emission, if any, is confined to
within 6 AU of the star. This argues against the existence of an extended PDR.
emission, if any, is confined to
within 6 AU of the star. This argues against the existence of an extended PDR.
On the other hand, van den Ancker et al. (1999) found strong
[OI], [CII] and [FeII] lines which they were unable to fit with shock
models. Although these data suffer from low spatial resolution (>20
![]() ),
these findings suggest the presence of a PDR component.
With 2
),
these findings suggest the presence of a PDR component.
With 2
![]() resolution Solf & Böhm (1999) found a compact emission region in
the optical [OI] and [SII] lines which is centered close to T Tau N and is characterized by near-zero radial velocities. Our SINFONI observations of the T Tau system included J-band data which are not presented here (see Gustafsson et al., in prep.). These measurements are
centered on T Tau S and do not cover T Tau N. Nevertheless, the
data show indirect evidence of strong [FeII] 1.26
resolution Solf & Böhm (1999) found a compact emission region in
the optical [OI] and [SII] lines which is centered close to T Tau N and is characterized by near-zero radial velocities. Our SINFONI observations of the T Tau system included J-band data which are not presented here (see Gustafsson et al., in prep.). These measurements are
centered on T Tau S and do not cover T Tau N. Nevertheless, the
data show indirect evidence of strong [FeII] 1.26 ![]() m
and [OI] 1.13
m
and [OI] 1.13 ![]() m emission close to or originating from T Tau N itself.
In the J-band data, continuum emission from T Tau N is scattered into the
field of view and we find [OI] and [FeII] emission with the same spatial distribution as the scattered light. We therefore believe that the emission originates in T Tau N. The
[OI] line traces the ionization front (Marconi et al. 1998) and the presence of
these lines indicates that a
PDR contribution may be present after all.
m emission close to or originating from T Tau N itself.
In the J-band data, continuum emission from T Tau N is scattered into the
field of view and we find [OI] and [FeII] emission with the same spatial distribution as the scattered light. We therefore believe that the emission originates in T Tau N. The
[OI] line traces the ionization front (Marconi et al. 1998) and the presence of
these lines indicates that a
PDR contribution may be present after all.
One possible solution to reconcile these apparently contradictory observations
is that a PDR exists but is confined to within ![]() 6 AU from T Tau N. The
infrared H2 emission analysed here extends to much larger radii and would
then be due to shocks. In any case, the emission seems to be linked to a nearly
face-on disk. Future observations with high spectral and spatial resolution
will be needed to confirm or disprove these suggestions. Such measurements
should include deeper observations of the infrared H2 lines to constrain the
line ratios, spectrally resolved measurements of the velocity, a search for
extended hydrogen recombination lines, and observations
to spatially constrain the [OI], [FeII], [SII] and [CII] lines.
6 AU from T Tau N. The
infrared H2 emission analysed here extends to much larger radii and would
then be due to shocks. In any case, the emission seems to be linked to a nearly
face-on disk. Future observations with high spectral and spatial resolution
will be needed to confirm or disprove these suggestions. Such measurements
should include deeper observations of the infrared H2 lines to constrain the
line ratios, spectrally resolved measurements of the velocity, a search for
extended hydrogen recombination lines, and observations
to spatially constrain the [OI], [FeII], [SII] and [CII] lines.
T Tau S is located at a projected distance of 0
![]() 7 (
7 (![]() 100 AU) south
of T Tau N. The extent of the H2 emission, as well as the SED modeling, indicate that the outer radius of the disk around T Tau N is 85-100 AU. Disks around stars in binary or
multiple stellar systems will be truncated by their mutual gravitational
influence. The size of the disk depends on the mass ratio of the stars and their
separation. The disk size
typically ranges from 0.3-0.4 times the separation for mass ratios of 1-0.3,
even when the disk and orbital plane are not coplanar (Artymowicz & Lubow 1994; Larwood et al. 1996). If the true size of the disk around T Tau N is
100 AU) south
of T Tau N. The extent of the H2 emission, as well as the SED modeling, indicate that the outer radius of the disk around T Tau N is 85-100 AU. Disks around stars in binary or
multiple stellar systems will be truncated by their mutual gravitational
influence. The size of the disk depends on the mass ratio of the stars and their
separation. The disk size
typically ranges from 0.3-0.4 times the separation for mass ratios of 1-0.3,
even when the disk and orbital plane are not coplanar (Artymowicz & Lubow 1994; Larwood et al. 1996). If the true size of the disk around T Tau N is ![]() 100 AU,
the argumentation above implies that the orbital distance to T Tau S is
100 AU,
the argumentation above implies that the orbital distance to T Tau S is ![]() 300 AU and that the
inclination of the orbit to the line-of-sight is
300 AU and that the
inclination of the orbit to the line-of-sight is ![]()
![]() .
.
If, on the one hand, T Tau S is located in front of T Tau N, UV irradiation from the 2.7 ![]() star T Tau Sa (Duchêne et al. 2006) could in principle contribute significantly to the H2 excitation on the side of the T Tau N disk facing toward us.
However, in that case the H2 emission would be accompanied by
extended Br
star T Tau Sa (Duchêne et al. 2006) could in principle contribute significantly to the H2 excitation on the side of the T Tau N disk facing toward us.
However, in that case the H2 emission would be accompanied by
extended Br![]() emission as discussed in Sect. 5.3. This is not seen.
On the other hand, if T Tau S is located behind T Tau N, the size of the disk
indicates that it may very well contribute to the extinction of T Tau S.
Given the small angular separation of T Tau Sa-Sb of
emission as discussed in Sect. 5.3. This is not seen.
On the other hand, if T Tau S is located behind T Tau N, the size of the disk
indicates that it may very well contribute to the extinction of T Tau S.
Given the small angular separation of T Tau Sa-Sb of ![]() 0
0
![]() 1 the disk
around T Tau N would most likely obscure both Sa and Sb by an equal amount of
material. Therefore, it does not help to explain why Sb is a normal T Tauri
star and Sa shows the characteristics of an infrared companion
(Dyck et al. 1982). The relative position of T Tau N and S and
their outflows are the subjects of a subsequent paper (Gustafsson et al., in prep.).
1 the disk
around T Tau N would most likely obscure both Sa and Sb by an equal amount of
material. Therefore, it does not help to explain why Sb is a normal T Tauri
star and Sa shows the characteristics of an infrared companion
(Dyck et al. 1982). The relative position of T Tau N and S and
their outflows are the subjects of a subsequent paper (Gustafsson et al., in prep.).
We detect emission from the H2 v=1-0 S(1) rovibrational line at 2.12 ![]() m
in a ring-like structure very close to T Tau N.
We find that the weak H2 emission is most likely linked
to a nearly face-on flared disk. Another possible solution is that the H2 emission originates from shocks impacting on the lower density walls of an
envelope cavity. This scenario, however, requires that the high velocity jet
in T Tau N be less collimated than in other T Tauri stars.
The radius of the disk is
m
in a ring-like structure very close to T Tau N.
We find that the weak H2 emission is most likely linked
to a nearly face-on flared disk. Another possible solution is that the H2 emission originates from shocks impacting on the lower density walls of an
envelope cavity. This scenario, however, requires that the high velocity jet
in T Tau N be less collimated than in other T Tauri stars.
The radius of the disk is
![]() 85-100 AU, based on SED modeling and the extent of the H2 emission.
The velocity in the vicinity of T Tau N is consistent with the rest velocity
of the star to within the errors.
Both shocks associated with a wide-angle wind
impinging on the disk and UV + X-ray irradiation from the central star onto
the disk are plausible excitation mechanisms which can reproduce the H2 flux.
Both these mechanisms require a substantial disk around T Tau N.
However, models and observations indicate that irradiation from the central
star cannot excite H2at radii much larger than 20 AU. Thus, the most likely excitation mechanism of
H2 is that of a wide-angle wind impinging on a flared disk. A PDR created by
irradiation may exist within
85-100 AU, based on SED modeling and the extent of the H2 emission.
The velocity in the vicinity of T Tau N is consistent with the rest velocity
of the star to within the errors.
Both shocks associated with a wide-angle wind
impinging on the disk and UV + X-ray irradiation from the central star onto
the disk are plausible excitation mechanisms which can reproduce the H2 flux.
Both these mechanisms require a substantial disk around T Tau N.
However, models and observations indicate that irradiation from the central
star cannot excite H2at radii much larger than 20 AU. Thus, the most likely excitation mechanism of
H2 is that of a wide-angle wind impinging on a flared disk. A PDR created by
irradiation may exist within ![]() 6 AU from T Tau N.
6 AU from T Tau N.
Acknowledgements
We would like to thank L.E. Kristensen for providing data from numerical shock models and J. Sauter for modeling disk and envelope densities. We are also grateful to Reinhard Mundt and Cornelis Dullemond for fruitful discussions.