A&A 487, 901-920 (2008)
DOI: 10.1051/0004-6361:20077617
I. Saviane1 - V. D. Ivanov1 - E. V. Held2 - D. Alloin3 - R. M. Rich4 - F. Bresolin5 - L. Rizzi6
1 - European Southern Observatory, Alonso de Cordova, 3107 Santiago, Chile
2 - OAPD, vicolo Osservatorio 5, 35122 Padova, Italy
3 - AIM, CEA/DSM/IRFU-Université Paris 7, Service d'Astrophysique, CEA/Saclay, 91191 Gif-sur-Yvette Cedex, France
4 - Department of Physics and Astronomy, 430 Portola Plaza, UCLA, Los Angeles, CA 90095-1547, USA
5 - Institute for Astronomy, University of Hawaii at Manoa, 2680 Woodlawn Drive, Honolulu, HI 96822, USA
6 - Joint Astronomy Centre, 660 N. Aohoku Place, University Park, Hilo, HI 96720,
USA
Received 5 April 2007 / Accepted 22 May 2008
Abstract
Context. The luminosity-metallicity relation is one of the fundamental constraints in the study of galaxy evolution; yet none of the relations available today has been universally accepted by the community.
Aims. The present work is a first step to collect homogeneous abundances and near-infrared (NIR) luminosities for a sample of dwarf irregular (dIrr) galaxies, located in nearby groups. The use of NIR luminosities is intended to provide a better proxy to mass than the blue luminosities commonly used in the literature; in addition, selecting group members reduces the impact of uncertain distances. Accurate abundances are derived to assess the galaxy metallicity.
Methods. Optical spectra are collected for H II regions in the dIrrs, allowing the determination of oxygen abundances by means of the temperature-sensitive method. For each dIrr galaxy H-band imaging is performed and the total magnitudes are measured via surface photometry.
Results. This high-quality database allows us to build a well-defined luminosity-metallicity relation in the range
![]() .
The scatter around its linear fit is reduced to 0.11 dex, the lowest of all relations currently available. There might exist a difference between the relation for dIrrs and the relation for giant galaxies, although a firm conclusion should await direct abundance determinations for a significant sample of massive galaxies.
.
The scatter around its linear fit is reduced to 0.11 dex, the lowest of all relations currently available. There might exist a difference between the relation for dIrrs and the relation for giant galaxies, although a firm conclusion should await direct abundance determinations for a significant sample of massive galaxies.
Conclusions. This new dataset provides an improved luminosity-metallicity relation, based on a standard NIR band, for dwarf star-forming galaxies. The relation can now be compared with some confidence to the predictions of models of galaxy evolution. Exciting follow-ups of this work are (a) exploring groups with higher densities, (b) exploring nearby galaxy clusters to probe environmental effects on the luminosity-metallicity relation, and (c) deriving direct oxygen abundances in the central regions of star-forming giant galaxies, to settle the question of a possible dichotomy between the chemical evolution of dwarfs and that of massive galaxies.
Key words: galaxies: fundamental parameters - infrared: galaxies - galaxies: dwarf - galaxies: irregular - galaxies: ISM
According to standard scenarios of galactic chemical evolution, a luminosity-metallicity (L-Z) relation is established through galactic winds - induced by supernova explosions - removing the interstellar medium (ISM) before it has been totally converted into stars (see the seminal work of Larson 1974; and also Tinsley & Larson 1979; Dekel & Silk 1986; Lynden-Bell 1992, among others). As this process is more efficient in low-mass (low escape velocity) galaxies, less metals should be trapped in dwarf galaxies. Indeed, a well-defined L-Z relation is observed in spheroidal galaxies (e.g. Caldwell et al. 1992), mostly field galaxies, in which old stellar populations dominate, and for which the chemical evolution has stopped. Do we expect a similar behaviour in the case of dwarf irregular galaxies (dIrr)? The situation is more complex. First, dIrrs are still active (in the sense of star formation), exhibiting substantial gas fractions and a broad range of star-formation rates (SFR). So, one would expect to encounter in Irrs, ISMs of different chemical maturities and rapidly evolving luminosities: all factors which would loosen any established relation between mass and metallicity. Second, the available sample of dIrrs is made of galaxies belonging to groups rather than distributed in the field. It is well known that the evolution of a galaxy gas content depends on its environment, and that gas stripping is boosted through galaxy interactions in dense groups and cluster sub-clumps. So, while one can see reasons why the terminal chemical evolution in dIrrs might depend on the galactic mass - similarly to the sample of gas-free spheroidal galaxies, there are a number of extra processes blurring the situation. Hence, it is unclear whether dIrr galaxies should exhibit a luminosity-metallicity relation.
Under such a scenario dwarf galaxies lose substantial fractions of their
mass in the course of their evolution, and should be major contributors
to the chemical evolution of the inter-galactic medium (IGM). In
particular, mass loss through galactic winds should occur in dIrr galaxies: their study contributes to probe the fraction of the IGM enrichment which is due to dwarf galaxies in general (e.g.,
Garnett 2002). Losses of enriched gas in dwarf galaxies
have indeed been observed: Martin et al. (2002) detected
a galactic wind of ![]() 6
6 ![]()
![]() from
NGC 1569, and for the first time, they could measure its
metallicity. The authors concluded at 3
from
NGC 1569, and for the first time, they could measure its
metallicity. The authors concluded at 3 ![]()
![]() of oxygen in the wind, almost as much as in the disk of the dwarf
itself. Hence, the cosmic chemical evolution and the existence of an
L-Z relation appear to be closely inter-related: this was an additional
motivation to pursue the study presented here.
of oxygen in the wind, almost as much as in the disk of the dwarf
itself. Hence, the cosmic chemical evolution and the existence of an
L-Z relation appear to be closely inter-related: this was an additional
motivation to pursue the study presented here.
The case of another dIrr, SagDIG, further illustrates this point.
In one of our previous studies (Saviane et al. 2002) we
measured a very low oxygen content (
![]() ),
a result which is not compatible with a closed-box evolution. According
to the model, such a low abundance would imply a large gas mass fraction
),
a result which is not compatible with a closed-box evolution. According
to the model, such a low abundance would imply a large gas mass fraction
![]() ,
whereas
the observed gas mass fraction is only
,
whereas
the observed gas mass fraction is only
![]() .
It is easy
to compute that
.
It is easy
to compute that ![]() 1.5
1.5 ![]()
![]() of gas
are missing, and, since this mass is smaller than that of the NGC 1569
galactic wind, it is plausible to conclude that SagDIG lost some of
its gas into the IGM.
of gas
are missing, and, since this mass is smaller than that of the NGC 1569
galactic wind, it is plausible to conclude that SagDIG lost some of
its gas into the IGM.
On the other hand, a cautionary remark should be added, since a general consensus on the role of galactic winds in the evolution of dwarf galaxies and the IGM has not been reached yet. For example, by means of chemo-photometric models Calura & Matteucci (2006) conclude that dIrr galaxies play a negligible role in the enrichment of the IGM, and the numerical models of Silich & Tenorio-Tagle (1998) show that galactic winds never reach the escape velocity of these dwarfs. And in the case of dwarf spheroidal (dSph) galaxies, the 3D hydrodynamic simulations of Marcolini et al. (2006) show that no galactic winds develop in these objects.
In our attempt to place SagDIG on previously established L-Z relations
for dIrr galaxies, we realized that the existence of such a relation
was controversial. Some studies had concluded at very well-defined
correlations (Skillman et al. 1989; Richer & McCall 1995;
Pilyugin 2001), others have found only mild relations
with substantial scatter (e.g. Skillman et al. 2003b),
or no correlation at al (Hidalgo-Gámez & Olofsson 1998;
Hunter & Hoffman 1999). Perhaps the major source
of confusion in these investigations comes from the ill-defined samples
used in the analysis. Abundance data are taken from different sources
(with spectra of variable quality and processed through different
reduction and analysis techniques); apparent luminosities and distances
are taken from catalogs, meaning that they are largely approximate.
Moreover, although the L-Z relation is expected to depend on the
environment, this is rarely taken into account in the analysis. Another
main source of uncertainty is the common use of the blue absolute
magnitude as a tracer of the mass. Optical luminosities can in fact
be extremely misleading in Irr galaxies, because of their star-bursting
activity (e.g. Tosi et al. 1992; or Schmidt et al. 1995).
Already, Bruzual & Charlot (1983) showed that
at
![]() a 1 Myr old burst is
a 1 Myr old burst is ![]() three orders
of magnitude brighter than an underlying old (15 Gyr) stellar
population of comparable mass. In other words, a dwarf galaxy hosting
a recent starburst could be as luminous, in the blue, as a galaxy
orders of magnitudes more massive but lacking a recent star formation
episode. In comparison, a recent starburst is at most 10 times
brighter in the near-infrared (NIR) than its underlying old population
of same mass. Therefore, the NIR window being more stable with regard
to star formation episodes is more appropriate for probing the galaxy
basic properties, such as its mass.
three orders
of magnitude brighter than an underlying old (15 Gyr) stellar
population of comparable mass. In other words, a dwarf galaxy hosting
a recent starburst could be as luminous, in the blue, as a galaxy
orders of magnitudes more massive but lacking a recent star formation
episode. In comparison, a recent starburst is at most 10 times
brighter in the near-infrared (NIR) than its underlying old population
of same mass. Therefore, the NIR window being more stable with regard
to star formation episodes is more appropriate for probing the galaxy
basic properties, such as its mass.
In order to address these issues, we embarked on a medium-term project aimed at gathering nebular oxygen abundances and NIR luminosities for a sample of dIrrs belonging to the three nearest groups of galaxies. In this way we can test the existence of an L-Z relation in well-defined environments (characterized by the group density), for which the scatter in apparent distance modulus is low, and for which an homogeneous set of abundances can be obtained.
Since we started the project, a few investigations have been published,
in relation with the context presented above. The first L-Z relation
using NIR luminosities (aside the work by Saviane et al. 2004)
is that by Salzer et al. (2005, hereafter S05). Their
sample is dominated by massive galaxies, and their relation was derived
using 2MASS data for the luminosities, and proprietary spectra from
the KPNO International Spectroscopic Survey (KISS) for the metallicities.
The 2MASS survey having a relatively shallow limiting magnitude, for
a few additional dwarf galaxies NIR photometry was supplemented by
the authors. At the other extreme, the sample assembled by Mendes de Oliveira et al. (2006) is entirely
made of dwarf galaxies. They gathered K-band luminosities and metallicities - obtained through the direct method - for 29 dIrrs. The NIR data are from 2MASS or from Vaduvescu et al. (2005), and metallicities have been picked up from a variety of sources. Finally
Lee et al. (2006) have used the Spitzer Infrared
Array Camera to compute 4.5 ![]() m luminosities for
m luminosities for ![]() 30 nearby dIrrs, the distance of which have been derived using standard candles. With oxygen abundances collected from the literature, they constructed a 4.5
30 nearby dIrrs, the distance of which have been derived using standard candles. With oxygen abundances collected from the literature, they constructed a 4.5 ![]() m L-Z relation.
m L-Z relation.
Although these studies have certainly improved the situation, they do not represent the ideal case yet. S05 abundances are derived through a new but indirect method, and the sample is very scarce in dwarf galaxies. Yet, S05 is the only study which includes H-band photometry, so a comparison with their L-Z relation is carried out later in this paper, in Sect. 5.3. As extensively discussed in Sect. 5.2, the use of heterogeneous data from the literature may produce a different L-Z relation than the one obtained with an homogeneous dataset, a likely consequence of distance uncertainties. Therefore, we anticipate that the relation by Mendes de Oliveira et al. (2006) will need to be revised once a better controlled sample, with K-band photometry, becomes available. Finally, the use of a non-standard passband does not allow an easy comparison of the L-Z relation by Lee et al. (2006) to other L-Z relations. For example they need to make several successive assumptions in order to convert their luminosities into masses, and then compare the mass-metallicity relation to the SDSS one. For all these reasons, we believe that so far our approach stands as the one with the smallest number of uncertainties and the broadest applicability.
The paper is structured as described below. In Sect. 2 we explain how the targets were selected, and give a brief account of the data reduction techniques - described in more detail in the appendices. The computation of chemical abundances is described in Sect. 3, where we also compare our results with previous abundance determinations. The resulting NIR luminosity-metallicity relation for dIrr galaxies is presented in Sect. 4. It is discussed in Sect. 5, with a possible explanation of its origin presented in Sect. 5.1 and its comparison with a relation based on literature data in Sect. 5.2. In Sect. 5.3 we discuss the possible dwarf vs. giant galaxy dichotomy, through a comparison of our results to those by Salzer et al. (2005). Finally a summary and the conclusions of this study are provided in Sect. 6.
Table 1: Target list.
The next two sections describe how the targets were selected in each of the two groups. The most popular galaxy names are listed in Table 1, together with other aliases.
Table 2:
Observations of Sculptor group targets. Additional data are the radial
velocity from Côté et al. (1997), and the radial velocity
from the NASA extragalactic database. No emission was detected in
the H![]() pre-imaging for ESO 294-G010.
pre-imaging for ESO 294-G010.
Sculptor group Irr galaxies were selected from the list of Côté et al. (1997, hereafter C97). The seven galaxies with H![]() detection and radial velocities
detection and radial velocities
![]() km s
km s![]() ,
were included in our target list shown in Table 2. Note that the C97 catalog contains another set of galaxies with velocities between 1000 and 2000 km s
,
were included in our target list shown in Table 2. Note that the C97 catalog contains another set of galaxies with velocities between 1000 and 2000 km s![]() ,
as well as sources with velocities
up to
,
as well as sources with velocities
up to ![]() 17 000 km s
17 000 km s![]() .
In addition to our main list, we included
ESO 294-G010, which has been classified as intermediate dS0/Im by
Jerjen et al. (1998, hereafter J98) and, although
C97 measured an H
.
In addition to our main list, we included
ESO 294-G010, which has been classified as intermediate dS0/Im by
Jerjen et al. (1998, hereafter J98) and, although
C97 measured an H![]() velocity
velocity
![]() km s
km s![]() ,
a
much smaller velocity is quoted in NED. Moreover, J98 have detected
[O III] and H
,
a
much smaller velocity is quoted in NED. Moreover, J98 have detected
[O III] and H![]() emission, albeit very weak. Yet,
as no emission was detected during our H
emission, albeit very weak. Yet,
as no emission was detected during our H![]() pre-imaging, we
did not carry over further observations: it is possible that J98 detected
a PN with H
pre-imaging, we
did not carry over further observations: it is possible that J98 detected
a PN with H![]() emission below our detection threshold. Bouchard
et al. (2005) re-classified this galaxy as dSph/dIrr.
emission below our detection threshold. Bouchard
et al. (2005) re-classified this galaxy as dSph/dIrr.
The main observational campaign was carried out in October 2002: NIR
imaging of the seven targets was collected, while bad weather undermined
the spectroscopic observing run and spectra could be collected for
five targets only. A few months after the completion of our observations,
Skillman et al. (2003a, hereafter S03a) identified
other dwarfs showing H![]() emission despite a null detection
by C97, bringing the total number of actively star-forming dIrrs in
the Sculptor group up to twelve. In a companion paper, Skillman et al. (2003b, hereafter S03b) derived oxygen abundances
for five of these galaxies (reported in Table 7),
two of them being in common with our original sample. So, to improve
the comparison with S03b, in August 2003 we complemented our data
set with NIR imaging and long-slit spectroscopy for ESO 473-G024.
Finally, ESO 245-G005 was re-observed in October 2003, in order to
measure an H II region closer to the center of the galaxy.
emission despite a null detection
by C97, bringing the total number of actively star-forming dIrrs in
the Sculptor group up to twelve. In a companion paper, Skillman et al. (2003b, hereafter S03b) derived oxygen abundances
for five of these galaxies (reported in Table 7),
two of them being in common with our original sample. So, to improve
the comparison with S03b, in August 2003 we complemented our data
set with NIR imaging and long-slit spectroscopy for ESO 473-G024.
Finally, ESO 245-G005 was re-observed in October 2003, in order to
measure an H II region closer to the center of the galaxy.
In summary, with the observations presented here there are now eight Sculptor group dwarfs with measured abundances, of which three are in common between our study and S03b. NIR data are available for all eight objects.
A first list of M 81 group members has been compiled by Karachentseva et al. (1985, hereafter K85), by inspecting photographic plates taken at the 6-m telescope. It includes 14 probable and 11 questionable members (on the basis of radial velocity and visual appearance), all of them of dIrr type. Later, Karachentseva & Karachentsev (1998) added six new possible members in the dE class, by searching POSS-II and ESO/SERC films. A search based on CCD imaging was carried out by Caldwell et al. (1998), who, however, did not publish their catalog. Finally, Froebrich & Meusinger (2000, hereafter FM00) discovered six more candidates in a survey that employed digitally stacked Schmidt plates. The candidates are equally divided into dE and dIrr types. A new version of the catalog of M 81 member candidates was recently published by Karachentsev et al. (2002, hereafter K02), showing a few additions and a few deletions when compared to the previous catalog.
Ten M 81 group dwarfs have been observed from 2001 to 2002 (Table 3).
Our first run was with the Kast spectrograph at Lick: the instrument
offers limited imaging capabilities, so we selected the target H II regions with the following strategy. The slit was first placed on
the brightest nebulosity within a target dwarf and a short-exposure
spectrum was taken. If it showed a conspicuous H![]() line, then
the integration was continued, otherwise we moved to another candidate
region and tried again. If no emission was detected in two to three
regions (depending on the galaxy luminosity), we moved to the next
dwarf target. With this procedure, emission was detected in only half
of the galaxies, namely DDO 42, DDO 53, UGC 4483, DDO 82, and
KDG 54 (which turned out to be a background, higher redshift object).
No emission was detected in KDG 52, BK 3N, DDO 66, DDO 165, nor
in the candidate 5 of Froebrich & Meusinger (2000). For
objects which did show emission lines, the spectroscopic observations
were followed-up by NIR imaging performed with the INGRID camera at
the ING/WHT telescope on La Palma.
line, then
the integration was continued, otherwise we moved to another candidate
region and tried again. If no emission was detected in two to three
regions (depending on the galaxy luminosity), we moved to the next
dwarf target. With this procedure, emission was detected in only half
of the galaxies, namely DDO 42, DDO 53, UGC 4483, DDO 82, and
KDG 54 (which turned out to be a background, higher redshift object).
No emission was detected in KDG 52, BK 3N, DDO 66, DDO 165, nor
in the candidate 5 of Froebrich & Meusinger (2000). For
objects which did show emission lines, the spectroscopic observations
were followed-up by NIR imaging performed with the INGRID camera at
the ING/WHT telescope on La Palma.
After the completion of the spectroscopic observations, three H![]() surveys including M 81 group galaxies were published by Hunter & Elmegreen (2004), Gil de Paz et al. (2003), and James et al. (2004). These surveys have detected
emission-line regions in, among others, DDO 42, DDO 53, UGC 4483,
DDO 66, DDO 82, and DDO 165. So they confirm our detections, but
they also unveil emission-line regions in DDO 66 and DDO 165, for
which our trial-and-error technique gave a null result.
surveys including M 81 group galaxies were published by Hunter & Elmegreen (2004), Gil de Paz et al. (2003), and James et al. (2004). These surveys have detected
emission-line regions in, among others, DDO 42, DDO 53, UGC 4483,
DDO 66, DDO 82, and DDO 165. So they confirm our detections, but
they also unveil emission-line regions in DDO 66 and DDO 165, for
which our trial-and-error technique gave a null result.
![\begin{figure}
\par\begin{tabular}{\vert c\vert c\vert c\vert}
\hline
DSS & $H$...
...graphics[width=0.1\textheight]{7617fig14.ps}\\
\hline
\end{tabular}\end{figure}](/articles/aa/full/2008/33/aa7617-07/img38.gif) |
Figure 1:
From left to right, we show the morphology of the Sculptor group targets
in the optical (DSS), infrared H (SOFI), and a false-color montage
of H |
| Open with DEXTER | |
![\begin{figure}
\par\begin{tabular}{\vert c\vert c\vert c\vert}
\hline
DSS & $H$...
...graphics[width=0.1\textheight]{7617fig24.ps}\\
\hline
\end{tabular}\end{figure}](/articles/aa/full/2008/33/aa7617-07/img39.gif) |
Figure 1: continued. |
| Open with DEXTER | |
![\begin{figure}
\par\begin{tabular}{\vert c\vert c\vert}
\hline
DSS & $H$\\
\hl...
...graphics[width=0.1\textheight]{7617fig32.ps}\\
\hline
\end{tabular}\end{figure}](/articles/aa/full/2008/33/aa7617-07/img40.gif) |
Figure 2:
The NIR, H-band, morphology of the M 81 group dIrrs observed at
WHT with INGRID ( right column) is compared to their optical
appearance as seen in DSS images ( left column). The galaxy luminosity
decreases from top to bottom panels. In all images, North is up and
East to the left, and the field of view is |
| Open with DEXTER | |
![\begin{figure}
\par\includegraphics[width=8cm,clip]{7617fig33.ps}\end{figure}](/articles/aa/full/2008/33/aa7617-07/img41.gif) |
Figure 3:
For each dIrr in the Sculptor group sample we show the spectrum of
one of the H II regions that enter the L-Z relation.
The spectra are masked near the strong night sky line [O I]
|
| Open with DEXTER | |
Table 3:
Observations of M 81 group targets. The group membership has been established
in K85, except for the candidate 5 which comes from Froebrich & Meusinger
(2000). Additional data are the radial velocity from the NASA
extragalactic database. Exposure times for the Kast spectrograph
observations are flagged with a code indicating the instrument setup:
B = blue arm with grism 830/3460; R = red arm with grating 300/4230; BR = both
arms with dichroic D46; F = red arm without dichroic; HR = red arm with
grating 1200/5000 centered around H![]() .
A ``n.e.'' in the INGRID
observation means that no emission was detected and so, no NIR imaging
had been performed.
.
A ``n.e.'' in the INGRID
observation means that no emission was detected and so, no NIR imaging
had been performed.
The observations summarized in Table 2 were carried out using
EFOSC2 (ESO Faint Object Spectrograph and Camera, 2; Buzzoni et al. 1984) at La Silla. Most spectra were taken on October 13 and 14, 2002, an additional spectrum of ESO245-G005 was collected on October 14, 2003, and finally ESO473-G024 was observed in
August 2003. EFOSC2 is a multi-mode instrument working at the Cassegrain
focus of the ESO/3.6 m telescope, allowing both imaging and long-slit,
low-resolution spectroscopy. A camera images the aperture onto a
2048 ![]() 2048 px Loral/Lesser, thinned, and UV-flooded CCD. Its pixel
size is
2048 px Loral/Lesser, thinned, and UV-flooded CCD. Its pixel
size is ![]() m, which corresponds to
m, which corresponds to
![]() on the sky, for a
total field of view of 5.4
on the sky, for a
total field of view of 5.4 ![]() 5.4
5.4![]() .
Under normal operation,
the CCD is read out by the left amplifier at a gain of
.
Under normal operation,
the CCD is read out by the left amplifier at a gain of
![]() ADU, and since numerical saturation occurs at 216 ADU, it remains well below the full well capacity of
ADU, and since numerical saturation occurs at 216 ADU, it remains well below the full well capacity of
![]() .
The dark current is
.
The dark current is
![]() ,
comparable to the readout noise of
,
comparable to the readout noise of ![]()
![]() .
The CCD
was binned at 2
.
The CCD
was binned at 2 ![]() 2 both in imaging and spectroscopy mode. Indeed,
rebinning allows the line profile of the calibration arcs to be sampled
with more than four pixels, even with the highest dispersion grisms and
a
2 both in imaging and spectroscopy mode. Indeed,
rebinning allows the line profile of the calibration arcs to be sampled
with more than four pixels, even with the highest dispersion grisms and
a
![]() wide slit, so for spectroscopic observations there is no
real advantage in using the
wide slit, so for spectroscopic observations there is no
real advantage in using the ![]() binning mode.
binning mode.
For each galaxy, the target H II regions were identified by
subtracting a 5 min R image from a 15 min H![]() image,
and the slit was then centered on the brightest region. Maps of the
H II regions are shown in Fig. 1.
During the night, two spectrophotometric standards (Feige 110 and
LTT 3218) from Oke (1990) and Hamuy et al. (1992,1994)
were observed. Other calibration frames were taken in the afternoon
preceding each observing night (bias, darks, HeAr arcs, and dome flatfields).
Grism #11 was used without an order sorting filter, yielding a dispersion
of 4.2 Å px-1 and giving a range from 3400 Å to
7500 Å. The second order spectrum (appearing at wavelengths longer
than
image,
and the slit was then centered on the brightest region. Maps of the
H II regions are shown in Fig. 1.
During the night, two spectrophotometric standards (Feige 110 and
LTT 3218) from Oke (1990) and Hamuy et al. (1992,1994)
were observed. Other calibration frames were taken in the afternoon
preceding each observing night (bias, darks, HeAr arcs, and dome flatfields).
Grism #11 was used without an order sorting filter, yielding a dispersion
of 4.2 Å px-1 and giving a range from 3400 Å to
7500 Å. The second order spectrum (appearing at wavelengths longer
than ![]() 6800 Å) is only a few percent of the first order, so
the contamination is negligible for the target spectra. It is however
important for the determination of the response function. Indeed,
it can be seen in the spectrum of the extremely blue standard Feige 110
(spectral type D0), but it disappears already in the spectrum of LTT 3218,
although its spectral type is DA. The latter standard was then used
to compute the response function. Spectra of the target regions were
obtained with a
6800 Å) is only a few percent of the first order, so
the contamination is negligible for the target spectra. It is however
important for the determination of the response function. Indeed,
it can be seen in the spectrum of the extremely blue standard Feige 110
(spectral type D0), but it disappears already in the spectrum of LTT 3218,
although its spectral type is DA. The latter standard was then used
to compute the response function. Spectra of the target regions were
obtained with a
![]() width slit, while the
width slit, while the
![]() width
slit, aligned along the parallactic angle, was used for observing
the spectrophotometric standards, in order to minimize slit losses.
The resolution with the
width
slit, aligned along the parallactic angle, was used for observing
the spectrophotometric standards, in order to minimize slit losses.
The resolution with the
![]() width slit is
width slit is ![]() 13 Å FWHM
(from the HeAr lines near 5000 Å). All slits cover the entire
EFOSC2 field of view.
13 Å FWHM
(from the HeAr lines near 5000 Å). All slits cover the entire
EFOSC2 field of view.
The reduction and analysis of the spectroscopic data was performed
in a standard way, with the main steps: (a) 2D wavelength and distortion
calibration; (b) extraction of spectra using the wings of H![]() to define a good window; (c) flux calibration; (d) measurement of
line fluxes in the MIDAS/ALICE
to define a good window; (c) flux calibration; (d) measurement of
line fluxes in the MIDAS/ALICE![]() framework; (e) correction of fluxes for underlying absorption; (f) correction for internal reddening of the region using the H
framework; (e) correction of fluxes for underlying absorption; (f) correction for internal reddening of the region using the H![]() /H
/H![]() ratio; (g) computation of
ratio; (g) computation of ![]() using [O III] lines
using [O III] lines
![]() and
and
![]() ;
and finally (h) computation
of nebular abundances using IRAF/IONIC
;
and finally (h) computation
of nebular abundances using IRAF/IONIC![]() . In some cases the H
. In some cases the H![]() line profile showed more than one region:
in this case the two brightest regions were extracted (see Table 4).
The spectra of the brightest H II regions that enter the L-Z relation
for each galaxy are shown in Fig. 3.
line profile showed more than one region:
in this case the two brightest regions were extracted (see Table 4).
The spectra of the brightest H II regions that enter the L-Z relation
for each galaxy are shown in Fig. 3.
Full account of the data reduction is reported in Appendix A.
The reddening corrected fluxes for each useful region are listed in
Table 4; for the regions
where [O III]
![]() has been detected, we list
their physical parameters and abundances in Table 6.
has been detected, we list
their physical parameters and abundances in Table 6.
![\begin{figure}
\par\includegraphics[width=7.8cm,clip]{7617fig34.ps}\end{figure}](/articles/aa/full/2008/33/aa7617-07/img57.gif) |
Figure 4: For three galaxies in the M 81 group sample the spectrum of the target H II region is shown, with a label identifying the host galaxy. The spectra of other galaxies are of poor quality and have not been used for abundance determinations. For display purposes, each flux has been multiplied by 1015 and a constant has been added. |
| Open with DEXTER | |
The spectra of the M 81 group dwarfs were obtained with the Kast
Double Spectrograph at the Cassegrain focus of the Shane 3 m Telescope,
at Lick observatory. The instrument consists of two separate spectrographs - one optimized for the red, and the other for the blue -. Dichroic
beam-splitters and separate CCD detectors allow simultaneous observation.
Both arms use a UV-flooded Reticon 1200 ![]() 400 px device, with
400 px device, with
![]() pixels covering
pixels covering
![]() on the sky; the ADC
sets a maximum ADU count of 32 000, with a gain of 3.8 e-/ADU,
and the read-out noise is 6 e-. The CCDs have a 40% quantum
efficiency at 3200 Å.We used a
on the sky; the ADC
sets a maximum ADU count of 32 000, with a gain of 3.8 e-/ADU,
and the read-out noise is 6 e-. The CCDs have a 40% quantum
efficiency at 3200 Å.We used a
![]() wide slit. The observations
were carried out simultaneously with the blue and the red arms, using
dichroic D46. In one occasion we also obtained a spectrum with the
red arm alone (without dichroic) to check the flux normalization in
the overlap region of the red and blue spectra. Table 3
summarizes the observations, carried out in December 2001 and January 2002. Due to poor weather conditions, and the overheads of the trial-and-error
technique, only six galaxy targets were observed in three nights,
of which one is the higher redshift object KDG 54.
wide slit. The observations
were carried out simultaneously with the blue and the red arms, using
dichroic D46. In one occasion we also obtained a spectrum with the
red arm alone (without dichroic) to check the flux normalization in
the overlap region of the red and blue spectra. Table 3
summarizes the observations, carried out in December 2001 and January 2002. Due to poor weather conditions, and the overheads of the trial-and-error
technique, only six galaxy targets were observed in three nights,
of which one is the higher redshift object KDG 54.
The reduction and analysis of the spectroscopic data is similar to that of EFOSC2 (see Appendix A), although more steps are needed to correct for the large flexures and to ensure a proper normalization of the spectra in the two arms (see Appendix B). Spectra with adequate S/N ratio could be obtained for three galaxies, they are shown in Fig. 4.
The reddening corrected fluxes for each useful region are listed in
Table 5, and for
the regions where [O III]
![]() was detected,
their derived physical parameters and abundances are provided in Table 6.
was detected,
their derived physical parameters and abundances are provided in Table 6.
Table 4: Reddening-corrected fluxes for all H II regions in the Sculptor group dwarfs.
Table 5: Reddening-corrected fluxes for all H II regions in M 81 group galaxies.
The imaging part of the project was carried out with the 4 m William
Herschel Telescope (WHT) and the 3.5 m New Technology Telescope (NTT).
The instrument INGRID (Isaac Newton Group Red Imaging Device) was
used at the former, and SOFI (Morwood et al. 1998)
at the latter. Both instruments make use of 1024 ![]() 1024 HgCdTe Hawaii
arrays, and the chosen scales were respectively of
1024 HgCdTe Hawaii
arrays, and the chosen scales were respectively of
![]() px-1and
px-1and
![]() px-1.
px-1.
The observations were performed with the typical pattern for infrared
imaging: iterating every 1-2 min between the object and a nearby
patch of clear sky, usually 3-5![]() away from the galaxy.
Each image was averaged over a number of short integrations, usually
10-30 s, to avoid saturation of the array from the combination of
the sky background and any bright foreground objects. Small offsets - of order of 5-10
away from the galaxy.
Each image was averaged over a number of short integrations, usually
10-30 s, to avoid saturation of the array from the combination of
the sky background and any bright foreground objects. Small offsets - of order of 5-10
![]() - were introduced between successive object or sky images to ensure that the target was placed on different locations of the array. This helps removing cosmetic defects and improves
the flat-fielding. A log of the observations is presented in Tables 2 and 3.
- were introduced between successive object or sky images to ensure that the target was placed on different locations of the array. This helps removing cosmetic defects and improves
the flat-fielding. A log of the observations is presented in Tables 2 and 3.
Detailed account of the data reduction and calibration is provided
in Appendix C. The main steps of the
NIR surface photometry are: (a) accurate flat-fielding with polynomial
fitting of the background; (b) masking of foreground stars; (c) deriving
the light-profile by integration in elliptical annuli. Errors on the
total magnitudes have been estimated by changing the background level
by ![]()
![]() ,
integrating the two new growth curves, and then
computing the difference with the magnitude obtained from the average
growth curve. In turn, the rms fluctuation of the background was
estimated by measuring the background itself in 10-20 independent
areas. The total magnitudes of all galaxies are listed in Table 7, except for DDO 82, dropped out because no estimate of its abundance could be
obtained; its magnitude is H = 10.83
,
integrating the two new growth curves, and then
computing the difference with the magnitude obtained from the average
growth curve. In turn, the rms fluctuation of the background was
estimated by measuring the background itself in 10-20 independent
areas. The total magnitudes of all galaxies are listed in Table 7, except for DDO 82, dropped out because no estimate of its abundance could be
obtained; its magnitude is H = 10.83 ![]() 0.37 mag.
0.37 mag.
Table 6:
Physical parameters and abundances for H II regions in
the dIrrs of the Sculptor and M 81 groups, for which the electron temperature
could be determined. The
![]() and
and
![]() abundances are the average of the two values obtained from the two
lines of the doublet separately (
abundances are the average of the two values obtained from the two
lines of the doublet separately (
![]() ,
and
,
and
![]() ,
respectively).
,
respectively).
Since the main purpose of this study is to use oxygen abundances in the search for a correlation with the galaxy luminosity, we defer a complete discussion of the elements other than oxygen to a future paper. Yet, the abundances of two other important elements (nitrogen and sulfur) have been derived as described in this section, and are listed in Table 6. The abundances have been computed with the so-called direct method (e.g. Osterbrock 1989).
The O III region electron temperatures
![]() ,
electron densities
,
electron densities
![]() ,
and abundances have been computed
using tasks within the NEBULAR package of IRAF. Since
temperature and density cannot be derived independently, we start
with suitable initial values and iterate the task TEMDEN until
the values stabilize within the errors: the temperature is computed
using the [O III] line ratio
,
and abundances have been computed
using tasks within the NEBULAR package of IRAF. Since
temperature and density cannot be derived independently, we start
with suitable initial values and iterate the task TEMDEN until
the values stabilize within the errors: the temperature is computed
using the [O III] line ratio
![]() ,
and the density is derived from the [S II] line ratio
,
and the density is derived from the [S II] line ratio
![]() .
Using these values for
.
Using these values for
![]() and
and
![]() ,
for every ion the abundance is computed with the
IONIC task, with central wavelengths, line ratios, and errors
listed in Tables 4 and 5 for the Sculptor
and M 81 groups, respectively. The tolerance on the central wavelength
is generally taken as 1 Å, except in cases where the line is
actually an unresolved doublet or blend. This happens for the following
multiplets: [O I]
,
for every ion the abundance is computed with the
IONIC task, with central wavelengths, line ratios, and errors
listed in Tables 4 and 5 for the Sculptor
and M 81 groups, respectively. The tolerance on the central wavelength
is generally taken as 1 Å, except in cases where the line is
actually an unresolved doublet or blend. This happens for the following
multiplets: [O I]
![]() (tolerance = 2 Å),
[O II]
(tolerance = 2 Å),
[O II]
![]() (4 Å), [O II]
(4 Å), [O II]
![]() blend (10 Å), and the [S II]
blend (10 Å), and the [S II]
![]() blend (7 Å).
blend (7 Å).
The total oxygen abundance is computed as
![]()
![]() ,
i.e. neglecting the usually small contribution from
,
i.e. neglecting the usually small contribution from
![]() (Skillman & Kennicutt 1993). On the other
hand, higher ionization stages of sulfur do contribute to the total
abundance (Dufour et al. 1988), so an ionization
correction factor (ICF) has to be computed and taken into account.
This is extensively discussed in Garnett (1989), who
computed a series of photoionization models and compared them with
the relation
(Skillman & Kennicutt 1993). On the other
hand, higher ionization stages of sulfur do contribute to the total
abundance (Dufour et al. 1988), so an ionization
correction factor (ICF) has to be computed and taken into account.
This is extensively discussed in Garnett (1989), who
computed a series of photoionization models and compared them with
the relation
![]() proposed by Stasinska (1978) with
proposed by Stasinska (1978) with ![]() and French
(1981) with
and French
(1981) with ![]() .
Neither choice of
.
Neither choice of ![]() gives
an entirely satisfactory result, however we have found that for
gives
an entirely satisfactory result, however we have found that for
![]() the relation reproduces Garnett's models in the range
the relation reproduces Garnett's models in the range
![]() ,
which corresponds to the case of all our H II regions.
Thus, sulfur abundances are computed as
,
which corresponds to the case of all our H II regions.
Thus, sulfur abundances are computed as
![]() ,
with
,
with
![]() ;
the correction factors
are listed in Table 6. Finally
nitrogen abundances are computed assuming
;
the correction factors
are listed in Table 6. Finally
nitrogen abundances are computed assuming
![]() ,
and then using the nitrogen to oxygen ratio in the equation
,
and then using the nitrogen to oxygen ratio in the equation
![]()
![]()
![]() .
.
Table 7:
Data for the L-Z relation of Sculptor and M 81 dIrrs, taken both
from the literature and from the present work. The abundances, computed
with the method identified in the third column, have been extracted
from the publication identified by its acronym in the fourth column
(see the bibliography); S08 is this paper. The abundance methods are
D = direct, M = McGaugh, P = Pilyugin, and I = indirect. Notes on abundances
are: (a) average of 3 regions; (b) average of two methods; (c) central
region; (d) external region. Distances have been computed with the
method identified in the sixth column, and have been extracted from
the publication identified by its acronym in the seventh column (see
the bibliography). The distance methods are J98, assuming an error
of ![]() and RGBT - red giant branch tip. Total apparent H-band
magnitudes are from this work, and the H-band extinctions are from
Schlegel et al. (1998).
and RGBT - red giant branch tip. Total apparent H-band
magnitudes are from this work, and the H-band extinctions are from
Schlegel et al. (1998).
A summary of our measurements is given in Table 7,
and, for each galaxy, the best literature direct measurement of the
oxygen abundance is reported as well. If no direct measurement exists,
then we list the best indirect measurement (i.e. the temperature cannot
be estimated, so abundance estimates rely upon semi-empirical relations
making use of different line ratios). There are five galaxies in our
sample for which the abundances can be compared to values already
published: this is shown in Fig. 5.
There is a general agreement except for DDO 42, which exhibits an
internal metallicity gradient and is discussed in more detail in Sect. 4.
Excluding this galaxy, the dispersion in the value differences is
only 0.06 dex. However, the median of the literature values is
0.1 dex lower than ours (dotted line in the figure). We tried
to understand this discrepancy by examining NGC 625, which shows
the largest difference. As a first check, we compared our fluxes to
those of S03b for the same nebula in this galaxy: the two studies
are fairly consistent, our fluxes being only ![]() smaller on average
and with a dispersion of
smaller on average
and with a dispersion of ![]() ,
and no trend with wavelength. The
exception is the [S III]
,
and no trend with wavelength. The
exception is the [S III]
![]() line, for which
our flux is
line, for which
our flux is ![]() 2 times larger than that quoted in S03b. With respect
to the oxygen lines, our fluxes are
2 times larger than that quoted in S03b. With respect
to the oxygen lines, our fluxes are ![]() and
and ![]() smaller for
the [O II]
smaller for
the [O II]
![]() and [O III]
and [O III]
![]() lines, respectively, while the [O III]
lines, respectively, while the [O III]
![]() and
and
![]() line fluxes are only
line fluxes are only ![]() and
and ![]() smaller,
respectively. Such flux discrepancies are entirely within the errors
we quote, yet they are responsible for most of the abundance differences.
Indeed, using the fluxes listed in S03b we obtain 12 + log (O/H) = 8.26 dex
for NGC 625 (region 5), so the difference is reduced from 0.18 dex
to 0.07 dex, i.e. it is now within our
smaller,
respectively. Such flux discrepancies are entirely within the errors
we quote, yet they are responsible for most of the abundance differences.
Indeed, using the fluxes listed in S03b we obtain 12 + log (O/H) = 8.26 dex
for NGC 625 (region 5), so the difference is reduced from 0.18 dex
to 0.07 dex, i.e. it is now within our ![]() error on the
abundance.
error on the
abundance.
| |
Figure 5:
Comparison of our abundance determinations to literature values, for
H II regions in galaxies with independent - and direct - determinations of
|
| Open with DEXTER | |
Since the measured green [O III] line fluxes are very
close to those of S03b, we discuss only the blue [O III]
![]() and [O II] lines here. The difference in flux for the
[O II]
and [O II] lines here. The difference in flux for the
[O II]
![]() line could be due to the fact
that for
line could be due to the fact
that for
![]() Å the EFOSC2 response function starts
dropping steadily, and large corrections have to be applied. On the
other hand, comparing the response functions obtained at different
epochs shows that the uncertainty on our response curve is at the
level of a few
Å the EFOSC2 response function starts
dropping steadily, and large corrections have to be applied. On the
other hand, comparing the response functions obtained at different
epochs shows that the uncertainty on our response curve is at the
level of a few ![]() .
S03b do not show their response function,
but since they are using an order sorting filter with
.
S03b do not show their response function,
but since they are using an order sorting filter with ![]() cut
at 3600 Å it is very likely that their correction to the [O II] line is quite large as well (almost a factor of two). In any case, adopting the S03b [O II] line flux leads only to a minor increase in abundance of 0.03 dex. Most of the abundance
dependence is then in the [O III]
cut
at 3600 Å it is very likely that their correction to the [O II] line is quite large as well (almost a factor of two). In any case, adopting the S03b [O II] line flux leads only to a minor increase in abundance of 0.03 dex. Most of the abundance
dependence is then in the [O III]
![]() line,
and indeed changing its flux and adopting the S03b value we get
line,
and indeed changing its flux and adopting the S03b value we get
![]() .
In this case, the flux quoted in S03b might be more reliable than
ours. Indeed, we have to deblend this line from H
.
In this case, the flux quoted in S03b might be more reliable than
ours. Indeed, we have to deblend this line from H![]() ,
while
on the spectra published by S03b the line is well separated from H
,
while
on the spectra published by S03b the line is well separated from H![]() .
Since [O III]
.
Since [O III]
![]() becomes weaker as the
oxygen abundance increases - hence the temperature decreases - this
could explain why the most deviant abundance value is that corresponding
to NGC 625, the most metal-rich galaxy in our sample.
becomes weaker as the
oxygen abundance increases - hence the temperature decreases - this
could explain why the most deviant abundance value is that corresponding
to NGC 625, the most metal-rich galaxy in our sample.
Table 8:
Abundances and NIR luminosities for the fiducial sample of galaxies.
Distances are expressed in Mpc, and Cols. 6 and 7 indicate the method
used to compute the distance, and its reference. Our abundances have
been corrected by -0.1 dex. For comparison we add also
I Zw 18 (H=16.03 ![]() 0.15; Thuan 1983) and SBS 0335-052
(H=16.09
0.15; Thuan 1983) and SBS 0335-052
(H=16.09 ![]() 0.03,
0.03,
![]() aperture; Vanzi et al. 2000).
aperture; Vanzi et al. 2000).
Table 7 summarizes the galaxy parameters
which have been used to create the L-Z relation. Besides oxygen
abundances and NIR luminosities, the table reports on distances and
total extinctions in the H band, taken from Schlegel et al. (1998).
Distances based on standard candles are available for only a fraction
of the targets, so in most cases we have used approximate values.
In particular for the Sculptor group, distances were taken from S03a
(computed with the method of J98). This method relies on the recession
velocity, and is claimed to provide distances within ![]() of the
direct measurement. The three galaxies with distances computed with
the red-giant branch tip (RGBT) luminosity enable a test of this method: they are UGCA 442, NGC 625, and ESO 245-G005, and their distances obtained with the J98 method are respectively
of the
direct measurement. The three galaxies with distances computed with
the red-giant branch tip (RGBT) luminosity enable a test of this method: they are UGCA 442, NGC 625, and ESO 245-G005, and their distances obtained with the J98 method are respectively
![]() smaller,
smaller, ![]() larger, and
larger, and ![]() smaller than the ones
quoted in Table 7. For the M 81 group, all
four galaxies have distances obtained with the RGBT technique, and
the DDO 42 distance has been measured by both Karachentsev et al.
(2002; K02) and Thuan & Izotov (2005a,b;
TI05). Although the TI05 distance (3.42
smaller than the ones
quoted in Table 7. For the M 81 group, all
four galaxies have distances obtained with the RGBT technique, and
the DDO 42 distance has been measured by both Karachentsev et al.
(2002; K02) and Thuan & Izotov (2005a,b;
TI05). Although the TI05 distance (3.42 ![]() 0.15 Mpc) has a smaller
formal error, we adopt the K02 distance, as, doing so, we have consistent
distances for three galaxies in our sample.
0.15 Mpc) has a smaller
formal error, we adopt the K02 distance, as, doing so, we have consistent
distances for three galaxies in our sample.
![\begin{figure}
\par\includegraphics[width=7.2cm,clip]{7617fig36.ps}\end{figure}](/articles/aa/full/2008/33/aa7617-07/img264.gif) |
Figure 6:
Metallicity of H II regions vs. absolute H luminosity
of galaxies in the Sculptor and M 81 groups. The upper panel shows
all direct oxygen measurements listed in Table 7,
while in the lower panel only selected regions are plotted with filled
diamonds (see text). The dashed line is a weighted least-squares fit
to the data, and the dotted lines feature the
|
| Open with DEXTER | |
All galaxies having direct abundance determinations are plotted in
the upper panel of Fig. 6. A correction of -0.1 dex
has been applied to our data, in order to be consistent with Skillman
et al. (2003b). There appears an obvious trend
of increasing metallicity with H luminosity, except for the two
galaxies at
![]() and
and
![]() mag.
These are ESO 245-G005 and DDO 42: the latter has an independent
oxygen abundance from Izotov et al. (1997), which
is higher than our value and consistent with that of ESO 347-G017
at comparable luminosity. Since the work of Roy et al. (1996),
it is known that DDO 42 displays a range of abundances consistent
with a shallow gradient, so our low value probably reflects the external
location of our target H II region. In the following we
will then adopt the Izotov et al. value which corresponds to a central
region, and we note that a key point in the definition of an L-Z relation
is that, for each galaxy, regions close to their centers should
be selected. The case of ESO 245-G005 is similar to that of DDO 42:
in this galaxy, we measured both an external and a central region,
finding an abundance difference of
mag.
These are ESO 245-G005 and DDO 42: the latter has an independent
oxygen abundance from Izotov et al. (1997), which
is higher than our value and consistent with that of ESO 347-G017
at comparable luminosity. Since the work of Roy et al. (1996),
it is known that DDO 42 displays a range of abundances consistent
with a shallow gradient, so our low value probably reflects the external
location of our target H II region. In the following we
will then adopt the Izotov et al. value which corresponds to a central
region, and we note that a key point in the definition of an L-Z relation
is that, for each galaxy, regions close to their centers should
be selected. The case of ESO 245-G005 is similar to that of DDO 42:
in this galaxy, we measured both an external and a central region,
finding an abundance difference of ![]() 0.5 dex. Our direct
abundances (the first ones for this galaxy) confirm the metallicity
gradient found by Miller (1996; M96) with an indirect
method: our range is
0.5 dex. Our direct
abundances (the first ones for this galaxy) confirm the metallicity
gradient found by Miller (1996; M96) with an indirect
method: our range is
![]() to 8.17 while M96
finds a range 7.65 to 8.20. A similar result has been obtained
by Hidalgo-Gámez et al. (2003). Again, we
adopt the central abundance as the reference for this galaxy.
to 8.17 while M96
finds a range 7.65 to 8.20. A similar result has been obtained
by Hidalgo-Gámez et al. (2003). Again, we
adopt the central abundance as the reference for this galaxy.
From the sample plotted in the upper panel of Fig. 6
we extracted the galaxies listed in Table 8,
which are the fiducial objects defining our L-Z relation. Whenever
possible we select abundances from our work, except for two galaxies:
UGCA 442 was not observed spectroscopically, and our observed DDO 42 region was excluded for the reason discussed above. Our fiducial L-Z relation
is plotted in the lower panel of Fig. 6. The obvious
abundance trend with luminosity is confirmed by a correlation coefficient
r=-0.93: a weighted least-squares fit yields the following relation:
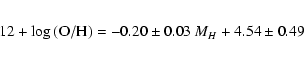
Table 8 includes
also data for the blue-compact dwarf (BCD) galaxies I Zw 18 and
SBS 0335-052. These are possibly the most metal-poor galaxies in the
local Universe, so it is worthwhile to see how they compare with our
sample of dwarf irregular galaxies. This is done in Fig. 6,
where the two objects are plotted with open symbols. They fall outside
the trend defined by dIrr galaxies, in the sense that their oxygen
abundances are too low for their luminosities. There might be several
explanations for this fact: the first possibility is that the gas
enrichment of BCD galaxies is slower than that of dIrr galaxies, either
because they produce less metals per stellar generation, or because
they lose metals into the IGM more easily. So, as the luminosity of
a BCD increases, its oxygen abundance does not increase as much as
that of a dIrr of comparable mass. A second possibility is that we
are not measuring the central abundances of the two BCDs. We have
shown above that gradients as large as 0.5 dex are detected in
dwarf galaxies, so the low abundance of the H II regions
in I Zw 18 and SBS 0335-052 might be explained by their non-central
location. Indeed the H I maps presented in van Zee et al. (1998) and Hirashita et al. (2002), and compared to the optical and H![]() maps, show that the star forming regions are slightly off-center. However a counter-argument
for I Zw 18 is that the galaxy is too small to have appreciable
metallicity gradients. Finally in the case of SBS 0335-052, one might
think that its distance is overestimated: if the distance were
maps, show that the star forming regions are slightly off-center. However a counter-argument
for I Zw 18 is that the galaxy is too small to have appreciable
metallicity gradients. Finally in the case of SBS 0335-052, one might
think that its distance is overestimated: if the distance were ![]() 4 times smaller, then its luminosity would agree with the faintest objects
in our sample. However at the relatively large recession velocity
of the galaxy (
4 times smaller, then its luminosity would agree with the faintest objects
in our sample. However at the relatively large recession velocity
of the galaxy (![]() 4000 km s-1) peculiar motions cannot
induce such a factor of four uncertainty in the distance (e.g., Tonry
2000). The conclusion is then that these two BCD galaxies
must have had different evolutionary paths than dIrr galaxies.
4000 km s-1) peculiar motions cannot
induce such a factor of four uncertainty in the distance (e.g., Tonry
2000). The conclusion is then that these two BCD galaxies
must have had different evolutionary paths than dIrr galaxies.
This remains true even when the two galaxies are compared to the general population of BCDs. Shi et al. (2005) have shown that the L-Z relation of BCD galaxies is similar to that of dIrr galaxies, so at the luminosity of I Zw 18 and SBS 0335-052 a typical BCD has higher oxygen abundances than these two objects. On the other hand the Shi et al. L-Z relation shows a very large scatter: this is not quantified by the authors, but in their Fig. 3 one can see object-to-object abundance differences of up to 1 dex. Shi et al. propose that the scatter might be due to differences in SFH or the evolutionary status of the current starburst, or to different starburst-driven outflows or gas infall rates. The abundances of I Zw 18 and SBS 0335-052 are then particularly low, but still compatible with those of BCDs in general, and could be due to one of these processes.
![\begin{figure}
\par\includegraphics[width=8.4cm,clip]{7617fig37.ps}\end{figure}](/articles/aa/full/2008/33/aa7617-07/img270.gif) |
Figure 7:
Comparison of the luminosities and abundances of our fiducial galaxies
(filled diamonds) with the predictions of a set of closed-box models
of increasing total masses (dotted line curves). For each model the
evolution has been truncated when the remaining gas mass drops below
3 |
| Open with DEXTER | |
As recalled in the introduction, in the case of dE/dSph galaxies the L-Z relation is interpreted in the scenario of mass-loss through galactic winds. The gas escapes more easily from low mass galaxies, so their chemical evolution is truncated before that of more massive galaxies. Some previous studies have proposed that dSphs and dIrrs share the same L-Z relation, thus extending the mass-loss scenario to irregulars (e.g. Skillman et al. 1989). However, recently it has been shown that the abundances of dIrrs are lower than those of dSphs of comparable luminosity, whether we consider their gas content (e.g. Mateo 1998) or their RGB stars (e.g. Grebel 2004). Therefore, if we want to retain the mass-loss scenario for both classes of dwarfs, then we must assume not only that this process leaves behind an L-Z relation after the evolution has stopped (dSph), but also that it induces a (possibly different) relation very early in the history of galaxies (dIrr), and is able to maintain it throughout their lives.
More input on the issue of the chemical evolution of dIrrs has been
provided recently by Skillman et al. (2003b) and
Pilyugin et al. (2004). Both studies conclude
that the chemical evolution of dIrrs can be approximated by a closed-box,
provided that an effective oxygen yield ![]() 1/3 of the theoretical
value (e.g., Maeder 1992) is adopted. A low yield can
be the signature of gas exchange with the environment, and this is
indeed observed in a few cases, as discussed in the introduction.
If this conclusion is valid, then it is hard to imagine how mass-loss
can produce the L-Z relation, because the galaxy mass is not a
parameter of the closed-box model. Conversely, one would expect that
the effective yield does depend on the mass of the galaxy, since the
efficiency of mass-loss via galactic winds should depend on the depth
of the potential well. Note also that Lee et al. (2006)
have found a few dwarf galaxies with large yields, a result difficult
to reconcile with the galactic wind hypothesis. In conclusion, there
does not appear to be any obvious interpretation of the observational
facts and the situation remains confusing.
1/3 of the theoretical
value (e.g., Maeder 1992) is adopted. A low yield can
be the signature of gas exchange with the environment, and this is
indeed observed in a few cases, as discussed in the introduction.
If this conclusion is valid, then it is hard to imagine how mass-loss
can produce the L-Z relation, because the galaxy mass is not a
parameter of the closed-box model. Conversely, one would expect that
the effective yield does depend on the mass of the galaxy, since the
efficiency of mass-loss via galactic winds should depend on the depth
of the potential well. Note also that Lee et al. (2006)
have found a few dwarf galaxies with large yields, a result difficult
to reconcile with the galactic wind hypothesis. In conclusion, there
does not appear to be any obvious interpretation of the observational
facts and the situation remains confusing.
Yet, pushing further the hypothesis of a low and universal yield,
we can gain some insight by looking at the dotted curves in Fig. 7,
which are in fact closed-box models computed with constant yield
![]()
![]() 10-4, and total masses
10-4, and total masses
![]() varying
between 4
varying
between 4 ![]()
![]() and 1.4
and 1.4 ![]()
![]() .
We also assumed
.
We also assumed
![]() (typical of a globular cluster-like
population, e.g. Bruzual & Charlot 2003), and
(typical of a globular cluster-like
population, e.g. Bruzual & Charlot 2003), and
![]() mag
(Astrophysical Quantities); the only parameter varying along
a track is the gas mass fraction
mag
(Astrophysical Quantities); the only parameter varying along
a track is the gas mass fraction
![]() .
If one assumes that all galaxies were born at the same time, then
this plot is telling us that more massive galaxies evolve faster along
their tracks, i.e. d
.
If one assumes that all galaxies were born at the same time, then
this plot is telling us that more massive galaxies evolve faster along
their tracks, i.e. d![]() /dt is larger for more massive galaxies.
If the galaxies were formed at different times, then larger galaxies
had more time to build up their metals. Skillman et al. (2003a)
computed SFRs for the Sculptor group galaxies: if their data are plotted
in the form
/dt is larger for more massive galaxies.
If the galaxies were formed at different times, then larger galaxies
had more time to build up their metals. Skillman et al. (2003a)
computed SFRs for the Sculptor group galaxies: if their data are plotted
in the form
![]() vs.
vs.
![]() ,
then a general trend of d
,
then a general trend of d![]() /dt
increasing with total mass can be seen. This confirms that larger
galaxies are more effective in converting their gas into stars.
/dt
increasing with total mass can be seen. This confirms that larger
galaxies are more effective in converting their gas into stars.
The conclusion is that, while a galaxy is still evolving (such as a dIrr) the L-Z relation could be a combined effect of mass-loss and of more efficient gas processing. A similar conclusion was reached by Pilyugin & Ferrini (2000): according to them, the L-Z relation is a combined effect of smaller gas-loss and higher astration level as the mass increases. Another prediction of this scenario is that the slope of the L-Z relation should increase with time, and the effect would be even larger if the gas is removed at earlier stages in smaller galaxies. The reason why astration becomes more efficient as the galaxy mass increases, remains to be understood. On the other hand, we should recall that one of the most accepted facts about star formation is that it depends on the gas density (Schmidt 1959), a conclusion also suggested by recent simulations (e.g., Chiosi & Carraro 2002). So it might be that as its mass increases, a galaxy becomes more effective at compressing its gas.
The open symbols in Fig. 7 represent again
the two BCD galaxies I Zw 18 and SBS 0335-052. In Sect. 4
we concluded that they do not follow the trend defined by dIrr galaxies
because their chemical evolution must be different. Our simplified
approach would tell us that I Zw 18 is on the track of a ![]() 3
3 ![]()
![]() galaxy, while SBS 0335-052 is on that of a
galaxy, while SBS 0335-052 is on that of a ![]() 2
2 ![]()
![]() object, and that - compared to a dIrr of similar total mass - they
did not convert much of their gas into stars, thus having very low
metallicities. However, it is also possible that their evolutionary
paths are different: for example their compactness might imply higher
densities, hence SFRs, which, in turn, would trigger more powerful stellar
winds and remove metals more easily than in dIrr galaxies. Or they
might be unusually young.
object, and that - compared to a dIrr of similar total mass - they
did not convert much of their gas into stars, thus having very low
metallicities. However, it is also possible that their evolutionary
paths are different: for example their compactness might imply higher
densities, hence SFRs, which, in turn, would trigger more powerful stellar
winds and remove metals more easily than in dIrr galaxies. Or they
might be unusually young.
The closed-box scenario itself does not make any prediction about
the final abundance a galaxy can reach: actually it predicts arbitrarily
large values of Z as the gas mass fraction tends to zero, since
![]() (Searle & Sargent 1972). However, if we
assume that the mass of each new generation of stars,
(Searle & Sargent 1972). However, if we
assume that the mass of each new generation of stars,
![]() ,
is roughly constant, then the maximum metallicity we can measure will
be
,
is roughly constant, then the maximum metallicity we can measure will
be
![]() ,
i.e. it will be proportional to the mass of the galaxy. This is shown
in Fig. 7, where we assumed
,
i.e. it will be proportional to the mass of the galaxy. This is shown
in Fig. 7, where we assumed
![]()
![]()
![]() ,
a mass of stars that can be created in
,
a mass of stars that can be created in ![]()
![]() for a typical SFR
for a typical SFR ![]()
![]() .
This formulation seems to provide a natural upper limit to the measurable
metallicities, and it works even for large galaxy masses. Indeed,
the solid line in the top panel of Fig. 9 represents
the same relation extended to
.
This formulation seems to provide a natural upper limit to the measurable
metallicities, and it works even for large galaxy masses. Indeed,
the solid line in the top panel of Fig. 9 represents
the same relation extended to
![]()
![]()
![]() ,
and with the exception of a couple of objects, the metallicities of
star-forming galaxies are always lower than this limit. It is quite
surprising that an upper limit to the metallicity is provided by such
a simple expression, as it is an oversimplification of galactic chemical
evolution. Still, it might suggest that a characteristic mass is involved
in the star formation process.
,
and with the exception of a couple of objects, the metallicities of
star-forming galaxies are always lower than this limit. It is quite
surprising that an upper limit to the metallicity is provided by such
a simple expression, as it is an oversimplification of galactic chemical
evolution. Still, it might suggest that a characteristic mass is involved
in the star formation process.
Table 9:
A compilation of luminosities and abundances for a sample of nearby
dwarf star-forming galaxies. The abundances listed in Col. 6 have
been taken from the publication the number of which is given in Col. 8 and have been computed with the method identified in Col. 7: 1 = direct method but temperature not computed, assumed
![]() ;
2 = direct method; 3 = unknown. The publication numbers correspond to
the following papers: (1) Hunter & Hoffman 1999;
(2) Hidalgo-Gàmez & Olofsson (2002);
(3) Vigroux et al. (1987); (4) Storchi-Bergmann
et al. (1994); (5) Martin (1997);
(6) Kobulnicky & Skillman (1998); (7) average
;
2 = direct method; 3 = unknown. The publication numbers correspond to
the following papers: (1) Hunter & Hoffman 1999;
(2) Hidalgo-Gàmez & Olofsson (2002);
(3) Vigroux et al. (1987); (4) Storchi-Bergmann
et al. (1994); (5) Martin (1997);
(6) Kobulnicky & Skillman (1998); (7) average
![]() of abundances from the following papers: Izotov &
Thuan (2004), Hunter & Hoffman (1999),
Thuan & Izotov (2005a,b), Alloin et al. (1979),
Shi et al. (2005); (8) Izotov & Thuan (1998);
(9) Shi et al. (2005); (10) Thuan & Izotov (2005a,b);
(11) van Zee et al. (1997); (12) Izotov
& Thuan (1998); (13) Izotov & Thuan (1997).
Most distances were taken from Hunter & Elmegreen (2006;
HE06): in Col. 10 the label ``h'' means that these authors computed
the distance from the recession velocity, while a number identifies
their source publication for the distance. If no distance is given
in HE06, then we derived it using the NED velocity and
of abundances from the following papers: Izotov &
Thuan (2004), Hunter & Hoffman (1999),
Thuan & Izotov (2005a,b), Alloin et al. (1979),
Shi et al. (2005); (8) Izotov & Thuan (1998);
(9) Shi et al. (2005); (10) Thuan & Izotov (2005a,b);
(11) van Zee et al. (1997); (12) Izotov
& Thuan (1998); (13) Izotov & Thuan (1997).
Most distances were taken from Hunter & Elmegreen (2006;
HE06): in Col. 10 the label ``h'' means that these authors computed
the distance from the recession velocity, while a number identifies
their source publication for the distance. If no distance is given
in HE06, then we derived it using the NED velocity and
![]() .
Finally the DDO 43 distance is from Sharina (2004, private communication;
cited in Karachentsev et al. 2004).
.
Finally the DDO 43 distance is from Sharina (2004, private communication;
cited in Karachentsev et al. 2004).
![\begin{figure}
\par\includegraphics[width=8cm,clip]{7617fig38.ps}\end{figure}](/articles/aa/full/2008/33/aa7617-07/img354.gif) |
Figure 8: Abundance vs. absolute H luminosity for galaxies with data taken from the literature (filled triangles) and for our targets (filled circles). In the upper panel, the dashed line is an unweighted fit to the literature data, while our fiducial relation is shown in the lower panel. In both panels dotted lines outline the rms dispersion around the fit. |
| Open with DEXTER | |
The literature offers only a few O/H measurements for galaxies as faint as those in our sample, so a direct consistency check of our results is not possible. However, one can find a few dIrrs with oxygen abundances and total infrared magnitudes allowing us to verify our relation statistically.
![\begin{figure}
\par\includegraphics[width=12cm,clip]{7617fig39.ps}\end{figure}](/articles/aa/full/2008/33/aa7617-07/img355.gif) |
Figure 9: Oxygen abundances vs. H luminosity for the Salzer et al. (2005) emission-line galaxies (KBG calibration), our dIrrs, and data compiled from the literature. In all panels the dashed line is the fit obtained by Salzer et al. to their data points (small open circles). In the top panel, the thin solid line is the same curve as that shown in Fig. 7, while the filled triangles and solid line correspond to our fiducial L-Z relation. In the central panel, the dotted line is a weighted fit to Salzer et al. galaxies fainter than MH=-20, while the filled triangles and solid line relate to our L-Z relation obtained using abundances re-computed by us with the empirical, indirect method. In the bottom panel, we show the L-Z relation from literature data (filled triangles and solid line). |
| Open with DEXTER | |
In order to minimize any systematic errors, we limited ourselves to
using the infrared magnitudes from three sources: the 2MASS Extended
Source Catalog (Jarrett et al. 2000), Cairós et al.
(2003), and Hunter & Elmegreen (2006).
No corrections for the different filter systems were applied. Furthermore,
we used only oxygen abundances derived with the temperature sensitive
method. The only exception is DDO 43, where ![]() = 10 000 K was
assumed instead of being measured. Finally, the distances for galaxies
closer than
= 10 000 K was
assumed instead of being measured. Finally, the distances for galaxies
closer than ![]() 10 Mpc were based on direct measurements rather
than on the Hubble flow. The data used for the comparison are listed
in Table 9. More than one O/H measurement
per galaxy is listed, whenever available. Radial velocities are taken
from the NASA extragalactic database. If the literature sources do
not list the O/H uncertainty, 0.1 dex was adopted. The distances
flagged with ``h'' are based on the Hubble flow (H0 = 72 km s-1 Mpc-1). The H-band extinction AH has been taken from Schlegel et al. (1998). The table data are presented in graphical form in Fig. 8
and compared to our L-Z relation. It appears that the properties
of our targets, dIrrs in the Sculptor and M 81 groups, are generally
similar to those of nearby dIrr galaxies, but the L-Z relations
yielded by the two sets of data are radically different. The slope
of an L-Z relation based on literature data is 2.5 times smaller
than the one we obtain (-0.08
10 Mpc were based on direct measurements rather
than on the Hubble flow. The data used for the comparison are listed
in Table 9. More than one O/H measurement
per galaxy is listed, whenever available. Radial velocities are taken
from the NASA extragalactic database. If the literature sources do
not list the O/H uncertainty, 0.1 dex was adopted. The distances
flagged with ``h'' are based on the Hubble flow (H0 = 72 km s-1 Mpc-1). The H-band extinction AH has been taken from Schlegel et al. (1998). The table data are presented in graphical form in Fig. 8
and compared to our L-Z relation. It appears that the properties
of our targets, dIrrs in the Sculptor and M 81 groups, are generally
similar to those of nearby dIrr galaxies, but the L-Z relations
yielded by the two sets of data are radically different. The slope
of an L-Z relation based on literature data is 2.5 times smaller
than the one we obtain (-0.08 ![]() 0.02 vs. -0.20
0.02 vs. -0.20 ![]() 0.03), and
its dispersion is 0.18 dex, i.e.
0.03), and
its dispersion is 0.18 dex, i.e. ![]() larger than the scatter
around our relation (0.11 dex).
larger than the scatter
around our relation (0.11 dex).
The large scatter in the literature data might be ascribed
to the uncertain distances, and it is also likely related to the random
location of the H II regions considered inside each galaxy.
Moreover, this large scatter seems to affect faint galaxies more than
luminous ones, since all objects brighter than
![]() exhibit
a smaller scatter. Note that the literature compilation includes galaxies
in diverse environments, another factor which might account for the
larger spread in the literature L-Z relation in comparison with our L-Z relation for the group galaxies.
exhibit
a smaller scatter. Note that the literature compilation includes galaxies
in diverse environments, another factor which might account for the
larger spread in the literature L-Z relation in comparison with our L-Z relation for the group galaxies.
Finally, although we tried to use a sample that is as homogeneous as possible, and the method for the abundance calculation is formally the same in all these works, yet systematic differences are still possible (as demonstrated in Sect. 3.1), and they can explain part of the scatter. A detailed discussion of all the single galaxies contained in Table 9 is beyond the scope of this paper, but the conclusion is clear: any quantitative interpretation of the L-Z relation based on literature data should be performed with great caution. However, this conclusion might be revised as more and more large and homogeneous data samples appear in the literature.
The unique study of the L-Z relation for giant galaxies that includes
NIR, H-band magnitudes is that by Salzer et al. (2005;
hereafter S05). They obtained spectra of emission-line galaxies in
fixed apertures of
![]() or
or
![]() ,
and computed oxygen
abundances with a reduced number of emission lines, because of the
limited spectral coverage of their data: using additional spectra,
they first derived metallicities for a subsample of galaxies using
both the direct and the empirical methods, and then calibrated them
against [N II]
,
and computed oxygen
abundances with a reduced number of emission lines, because of the
limited spectral coverage of their data: using additional spectra,
they first derived metallicities for a subsample of galaxies using
both the direct and the empirical methods, and then calibrated them
against [N II]![]() 6583/H
6583/H![]() and [O III]
and [O III]![]() 5007/H
5007/H![]() .
The empirical method they used is the Pilyugin (2000;
P00) calibration for the lower branch of the
.
The empirical method they used is the Pilyugin (2000;
P00) calibration for the lower branch of the
![]() vs. R23 relation, and three calibrations for the upper branch:
Edmunds & Pagel (1984; EP), Kennicutt et al. (2003; KBG), and Tremonti et al. (2004). In Fig. 9 we have plotted our data together with Salzer's et al. data. The figure reveals that the scatter in the L-Z relation
for giant galaxies is very large, compared to that of our dIrrs, perhaps
due to fixed-aperture effects and uncertainties specific to the
empirical methods (see also the discussion in S05). The straight lines
in the upper panel are the fits obtained by S05 and by us: taken at face
value, this plot would suggest a well-defined offset between the L-Z relation of giants and dwarfs. The slope of the S05 L-Z relation is in fact close to what we find for dwarfs alone, namely -0.215
vs. R23 relation, and three calibrations for the upper branch:
Edmunds & Pagel (1984; EP), Kennicutt et al. (2003; KBG), and Tremonti et al. (2004). In Fig. 9 we have plotted our data together with Salzer's et al. data. The figure reveals that the scatter in the L-Z relation
for giant galaxies is very large, compared to that of our dIrrs, perhaps
due to fixed-aperture effects and uncertainties specific to the
empirical methods (see also the discussion in S05). The straight lines
in the upper panel are the fits obtained by S05 and by us: taken at face
value, this plot would suggest a well-defined offset between the L-Z relation of giants and dwarfs. The slope of the S05 L-Z relation is in fact close to what we find for dwarfs alone, namely -0.215 ![]() 0.003 and -0.201
0.003 and -0.201 ![]() 0.004 for abundances obtained with the EP and KBG calibrations, respectively. Finally, to be consistent with S05, in the
central panel we have plotted our abundances computed with the same P00 calibration of the empirical method, allowing two galaxies to be added (see abundances identified by ``P'' in
Table 7). The offset between galaxies in the two
mass ranges seems to disappear: it is replaced by what looks like
different L-Z relations for dwarf and giant galaxies, with a separation
at
0.004 for abundances obtained with the EP and KBG calibrations, respectively. Finally, to be consistent with S05, in the
central panel we have plotted our abundances computed with the same P00 calibration of the empirical method, allowing two galaxies to be added (see abundances identified by ``P'' in
Table 7). The offset between galaxies in the two
mass ranges seems to disappear: it is replaced by what looks like
different L-Z relations for dwarf and giant galaxies, with a separation
at
![]() .
A fit to S05 galaxies fainter than this limit
yields the dotted line shown in the panel, while the solid line is a fit
to our dwarfs. The two relations have a similar slope, and a
.
A fit to S05 galaxies fainter than this limit
yields the dotted line shown in the panel, while the solid line is a fit
to our dwarfs. The two relations have a similar slope, and a
![]() 0.3 dex offset, with the dwarfs of our sample being on average
more metal poor than those of S05. This might result from the two-step
calibration of S05, which introduces additional uncertainties in the
empirical method - a method which, in any case, does not guarantee
abundance precisions better than 0.2 dex. The most important thing
to notice, however, is that extremely different L-Z relations are
obtained for the dwarfs of our sample, if one uses abundances computed
by the two methods, direct or empirical. The solid line in the upper
panel of Fig. 9 (corresponding to direct abundances in
the region of dwarf galaxies) has a slope of -0.05 dex mag-1 and
an rms dispersion around this fit of 0.14 dex. The scatter is
larger, and the slope is four times smaller when empirical abundances
are used for the same sample of dwarfs (central panel). Striving for
abundances obtained with the direct method requires a much larger
observational effort, but the effort is wholly justified by the better
constraints it provides on galaxy evolution.
0.3 dex offset, with the dwarfs of our sample being on average
more metal poor than those of S05. This might result from the two-step
calibration of S05, which introduces additional uncertainties in the
empirical method - a method which, in any case, does not guarantee
abundance precisions better than 0.2 dex. The most important thing
to notice, however, is that extremely different L-Z relations are
obtained for the dwarfs of our sample, if one uses abundances computed
by the two methods, direct or empirical. The solid line in the upper
panel of Fig. 9 (corresponding to direct abundances in
the region of dwarf galaxies) has a slope of -0.05 dex mag-1 and
an rms dispersion around this fit of 0.14 dex. The scatter is
larger, and the slope is four times smaller when empirical abundances
are used for the same sample of dwarfs (central panel). Striving for
abundances obtained with the direct method requires a much larger
observational effort, but the effort is wholly justified by the better
constraints it provides on galaxy evolution.
Interestingly, using direct abundances from the literature yields
an L-Z relation similar to that obtained by fitting the S05 dwarfs.
This can be seen by comparing the solid line in the bottom panel of
Fig. 9, to the dotted line in the central panel.
The zero points are similar, and the two slopes are -0.08 ![]() 0.02 dex mag-1and -0.04
0.02 dex mag-1and -0.04 ![]() 0.02 dex mag-1, respectively. The conclusion
is that the use of direct abundances is not a sufficient condition:
distances must be know with great accuracy as well. In that respect,
let us point out that selecting a sample of dIrr galaxies in groups
has been a winning strategy. Even assuming just an average distance
for all galaxies in a group has allowed us to obtain essentially the
same L-Z relation (Saviane et al. 2004,2005).
0.02 dex mag-1, respectively. The conclusion
is that the use of direct abundances is not a sufficient condition:
distances must be know with great accuracy as well. In that respect,
let us point out that selecting a sample of dIrr galaxies in groups
has been a winning strategy. Even assuming just an average distance
for all galaxies in a group has allowed us to obtain essentially the
same L-Z relation (Saviane et al. 2004,2005).
The question of a dwarf-giant dichotomy is then open: moving from
the empirical to the direct abundances, the L-Z relation for dwarfs
becomes much better defined, parallel to the one obtained for more
massive galaxies, and with a substantial offset. It remains to be
seen what would happen to the L-Z relation of giant galaxies if
one uses direct abundances: an important extension of this project
would be to measure direct abundances for at least some of the S05 galaxies, and check whether the observed offset is confirmed. Since
the S05 sample includes star-forming galaxies, one might suspect that
some of the giant galaxies are shifted in luminosity because of the
presence of a star-burst: however, Lee et al. (2004)
have found that this shift is a few tenths of magnitude in the B-band,
compared to quiescent galaxies (however see also Bica et al. 1990).
We expect that the effect in the IR must be even lower, and certainly
not comparable to the ![]() 2 mag we observe.
2 mag we observe.
A dwarf-giant galaxy dichotomy has been discussed, e.g., in
Garnett (2002, hereafter G02), where the trend of effective
yields
![]() vs. galaxy luminosity or
rotational velocity is studied. It is shown that dwarf galaxies (those
with
vs. galaxy luminosity or
rotational velocity is studied. It is shown that dwarf galaxies (those
with
![]() km s-1) have lower effective yields
than massive spiral galaxies, which is interpreted as due to gas
outflows in dwarfs. A similar conclusion has been reached by Tremonti et al. (2004). In G02 the stellar mass that enters the
gas mass fraction
km s-1) have lower effective yields
than massive spiral galaxies, which is interpreted as due to gas
outflows in dwarfs. A similar conclusion has been reached by Tremonti et al. (2004). In G02 the stellar mass that enters the
gas mass fraction ![]() was computed from blue luminosities, assuming a
color-M/L relation. Since more accurate stellar masses can be
computed with NIR luminosities, the availability for massive spiral
galaxies of abundances obtained with temperature-sensitive methods would
allow more accurate effective yields to be computed as well, and
therefore to update the G02 study. In particular, it would be interesting
to check whether indeed dwarf galaxies can lose up to
was computed from blue luminosities, assuming a
color-M/L relation. Since more accurate stellar masses can be
computed with NIR luminosities, the availability for massive spiral
galaxies of abundances obtained with temperature-sensitive methods would
allow more accurate effective yields to be computed as well, and
therefore to update the G02 study. In particular, it would be interesting
to check whether indeed dwarf galaxies can lose up to ![]() of their
metals and be the main source of enrichment of the inter-galactic
medium.
of their
metals and be the main source of enrichment of the inter-galactic
medium.
We have measured oxygen abundances in H II regions located
inside a number of dIrr galaxies, belonging to the nearby Sculptor
and M 81 groups. The abundances were measured with the temperature-sensitive
(direct) method, based on the ratio of the auroral line [O III]
![]() to the nebular lines [O III]
to the nebular lines [O III]
![]() ,
and were complemented by direct abundances from the literature for
two additional galaxies. The weak [O III]
,
and were complemented by direct abundances from the literature for
two additional galaxies. The weak [O III]
![]() line could be measured in H II regions belonging to five
galaxies of the Sculptor group and two galaxies of the M 81 group.
Metallicity gradients were detected in ESO 245-G005 and DDO 42,
confirming earlier findings, so only the central highest-metallicity
regions were considered for the derivation of the luminosity-metallicity
relation. This forced us to discard our DDO 42 measurement, and adopt
a literature value. Our fiducial sample then includes six dIrr galaxies
of the Sculptor group and two galaxies of the M 81 group.
line could be measured in H II regions belonging to five
galaxies of the Sculptor group and two galaxies of the M 81 group.
Metallicity gradients were detected in ESO 245-G005 and DDO 42,
confirming earlier findings, so only the central highest-metallicity
regions were considered for the derivation of the luminosity-metallicity
relation. This forced us to discard our DDO 42 measurement, and adopt
a literature value. Our fiducial sample then includes six dIrr galaxies
of the Sculptor group and two galaxies of the M 81 group.
For these eight galaxies we have obtained deep NIR, H-band, imaging
which allowed us to perform surface photometry and compute their total
luminosities. Thanks to the availability of distances with ![]()
![]() errors, the galaxies could be placed in the
errors, the galaxies could be placed in the
![]() vs. MH diagram, revealing a clear L-Z relation with a small 0.11 dex scatter around the average trend. The scatter is smaller
than that of relations obtained at optical wavelengths (e.g. 0.161 dex
using B-band data, Lee et al. 2006), and is comparable
to the one obtained by Lee et al. (2006) with their
MIR [4.5
vs. MH diagram, revealing a clear L-Z relation with a small 0.11 dex scatter around the average trend. The scatter is smaller
than that of relations obtained at optical wavelengths (e.g. 0.161 dex
using B-band data, Lee et al. 2006), and is comparable
to the one obtained by Lee et al. (2006) with their
MIR [4.5 ![]() m]-band data (0.12 dex). Assuming the existence
of a fundamental mass-metallicity relation, the improved definition
of the L-Z relation at NIR luminosities must be due to the fact
that it better traces the underlying relation with mass, since the
NIR mass-to-light ratio is more sensitive to the integrated
star formation history of a galaxy. On the contrary, the blue mass-to-light
ratio is more sensitive to the instantaneous SFR, which has a large
galaxy-to-galaxy scatter (Saviane et al. 2004; Salzer et al. 2005).
m]-band data (0.12 dex). Assuming the existence
of a fundamental mass-metallicity relation, the improved definition
of the L-Z relation at NIR luminosities must be due to the fact
that it better traces the underlying relation with mass, since the
NIR mass-to-light ratio is more sensitive to the integrated
star formation history of a galaxy. On the contrary, the blue mass-to-light
ratio is more sensitive to the instantaneous SFR, which has a large
galaxy-to-galaxy scatter (Saviane et al. 2004; Salzer et al. 2005).
Our work and that of Lee et al. (2006) are the ones
that managed to obtain the best defined L-Z relation, and as an
additional advantage, our standard NIR band allows an easy comparison
to other relations obtained in independent studies. Indeed we compared
our relation to that of Salzer et al. (2005), who are
the only authors providing an H-band relation, at the same time
extending it to giant galaxies. Unfortunately a direct comparison
with our accurate abundances is not possible, since the abundances
of S05 are obtained with the so-called strong-line method (indirect
or empirical method). To be consistent with S05 the abundances of
our dwarf sample were also computed with the empirical method, and
although the new L-Z relation has more scatter than the one using
direct abundances, in this way our dwarf galaxies can be placed in
a same graph together with the galaxies analyzed by S05. The slope
and zero-point of the relation for our dwarfs, using indirect abundances,
are different than those of the relation obtained with direct abundances,
and, when compared to S05 giants, a possible break-point appears at
![]() .
While this could suggest a different gas-consumption
mechanism for dwarf and giant galaxies, a solid conclusion cannot
be established at this stage. Indeed, the version of the empirical
method employed by S05 is different from that classically used, and
so a slight inconsistency between our abundances and those of S05
may still exist. The best way for giving the final word on this possible
giant-dwarf dichotomy would be to obtain direct abundances for a good
number of the KISS galaxies. And precisely, such a project has been
started recently by some of us (see Saviane et al. 2007).
.
While this could suggest a different gas-consumption
mechanism for dwarf and giant galaxies, a solid conclusion cannot
be established at this stage. Indeed, the version of the empirical
method employed by S05 is different from that classically used, and
so a slight inconsistency between our abundances and those of S05
may still exist. The best way for giving the final word on this possible
giant-dwarf dichotomy would be to obtain direct abundances for a good
number of the KISS galaxies. And precisely, such a project has been
started recently by some of us (see Saviane et al. 2007).
One of the motivations for the current study was to remedy the lack of homogeneous abundances and luminosities in the literature, but still it was interesting to make the experiment of assembling an L-Z relation based on literature data, and see whether our approach really turned out to be superior. We concluded that indeed mixing data from a variety of sources builds an L-Z relation affected by large uncertainties, and very different from the one obtained with a controlled sample and controlled methods. Inferences based on literature data are thus to be taken as qualitative at best, and should be discarded, if possible.
Limiting ourselves to our sample of dIrrs, we attempted to explain the L-Z relation assuming that the chemical evolution of these objects is similar to that of a closed-box model with an effective yield which is 1/3 its value in the solar vicinity (Skillman et al. 2003b; Pilyugin et al. 2004). If this approximation holds true, and if we assume that the chemical evolution has started at the same time irrespective of mass, then the conclusion is that more massive galaxies have faster chemical evolutions (gas-consumption rates). Alternatively, more massive galaxies had more time to build up their metal content.
Due to a number of reasons (mainly adverse weather conditions) we could assemble a large database only for the Sculptor group of galaxies, while only two galaxies of the M 81 group enter our L-Z relation. Although these two dwarfs seem to follow the same relation as that defined by the Sculptor group galaxies, more M 81 dIrrs need to be measured, before one can understand whether the higher density in that group is influencing the chemical evolution of its members.
Indeed, in general terms our L-Z relation is based on a
small number of galaxies, therefore more objects need to be added
to Fig. 6 in order to confirm our L-Z relation with
a larger sample. For example, looking at the number of dIrr presented
in Lee et al. (2006), we might be able to add ![]() 20 galaxies to our database. And 10 m-class facilities will have to be used to reach this goal in a reasonable time. In the short term we plan to keep collecting data for the M 81 group, and start a similar
study for the Centaurus A group. A natural extension of the project
would be to investigate clusters of galaxies, but this is a difficult
task from the observational point of view, since the two nearest galaxy
clusters are Virgo and Fornax, at 22 and 24 Mpc respectively
(Ferguson & Sandage 1990, hereafter FS90).
A more viable alternative would be to observe the Leo group of galaxies.
At a distance of 18.2 Mpc (FS90), this group is the fourth nearest
one, and has a relatively high velocity dispersion of
20 galaxies to our database. And 10 m-class facilities will have to be used to reach this goal in a reasonable time. In the short term we plan to keep collecting data for the M 81 group, and start a similar
study for the Centaurus A group. A natural extension of the project
would be to investigate clusters of galaxies, but this is a difficult
task from the observational point of view, since the two nearest galaxy
clusters are Virgo and Fornax, at 22 and 24 Mpc respectively
(Ferguson & Sandage 1990, hereafter FS90).
A more viable alternative would be to observe the Leo group of galaxies.
At a distance of 18.2 Mpc (FS90), this group is the fourth nearest
one, and has a relatively high velocity dispersion of
![]() .
Its properties (density, number of galaxies, dwarf-to-giant galaxy
ratio, etc.) are intermediate between those of nearby groups and those
of clusters of galaxies (see e.g. Fig. 1 and following in Ferguson
& Sandage 1991). It would then allow us to
begin the exploration of a cluster-like environment, with NIR cameras
at 10 m-class telescopes.
.
Its properties (density, number of galaxies, dwarf-to-giant galaxy
ratio, etc.) are intermediate between those of nearby groups and those
of clusters of galaxies (see e.g. Fig. 1 and following in Ferguson
& Sandage 1991). It would then allow us to
begin the exploration of a cluster-like environment, with NIR cameras
at 10 m-class telescopes.
Acknowledgements
This research has made use of the NASA/IPAC Extragalactic Database (NED) which is operated by the Jet Propulsion Laboratory, California Institute of Technology, under contract with the National Aeronautics and Space Administration. We thank John Salzer for providing the data of KISS galaxies in tabular form, and the referee for providing useful comments that improved the presentation of our work. Regina Riegerbauer, Nadia Millot, and Richard Whitaker helped with the data reductions at different stages of this project. This paper is dedicated to the memory of Maria Saviane.
All nights were treated separately, and reductions were carried out using a customized version of the EFOSC2 quick-look tool (http://www.ls.eso.org/), which is based on the ESO-MIDAS data reduction system. The main reduction steps are summarized as follows.
All bias frames were inspected to ensure that their level was the
same, and an average bias was then computed and subtracted from the
rest of the frames. The master flatfield was computed by taking the
median of five normalized frames and then subtracting the spectral
signature of the quartz lamp. The latter was computed by first averaging
the flux along the spatial direction, then fitting a polynomial of
degree 6 along the dispersion, and finally expanding it back into
a bidimensional frame. The wavelength calibration was computed based
on the spectrum of the internal Helium-Argon lamp, taken with the
![]() wide slit. Since the projection of the
wide slit. Since the projection of the
![]() wide
slit on the CCD is in the same position, the calibration was used
both for the spectra of the H II regions and the spectrophotometric
standards. A transformation of the form
wide
slit on the CCD is in the same position, the calibration was used
both for the spectra of the H II regions and the spectrophotometric
standards. A transformation of the form
![]() was found, thus correcting also for the distortion of the spectra
introduced by the optical system. The transformation was modeled with
polynomials of degree 3 and 2 along the dispersion and the spatial
direction, respectively. After applying the calibration, the spectra
were linearly rebinned with a constant step of
was found, thus correcting also for the distortion of the spectra
introduced by the optical system. The transformation was modeled with
polynomials of degree 3 and 2 along the dispersion and the spatial
direction, respectively. After applying the calibration, the spectra
were linearly rebinned with a constant step of
![]() Å.
The bidimensional sky frame was created by first sampling the sky
spectrum in two windows flanking the target spectrum, and then fitting
the spatial gradient with a polynomial of degree 1. After subtracting
the sky frame, the extraction window of the emission-line spectra
was decided by looking at the spatial profile of the H
Å.
The bidimensional sky frame was created by first sampling the sky
spectrum in two windows flanking the target spectrum, and then fitting
the spatial gradient with a polynomial of degree 1. After subtracting
the sky frame, the extraction window of the emission-line spectra
was decided by looking at the spatial profile of the H![]() line
and making some experiments until the best S/N was found. On the other
hand, the flux of the spectrophotometric standard stars was summed
over almost the entire spatial profile, leaving out just the two sky
windows. As it was recalled above, the response function for the flux
calibration was computed using the star LTT 3218. To do this, the
instrumental spectrum was corrected for atmospheric extinction, divided
by the exposure time, and then divided by the published spectrum,
and the ratio was fitted with a polynomial of degree 12. The spectrophotometric
standard was observed at several airmasses, and we checked that the
extinction-corrected and normalized spectra are almost identical,
thus confirming the extinction curve for La Silla provided by MIDAS.
The response function was then computed as the median of the five
functions found for the two nights. The pre-processed, wavelength-calibrated,
sky-subtracted and extracted spectra were thus finally flux-calibrated
using this response function.
line
and making some experiments until the best S/N was found. On the other
hand, the flux of the spectrophotometric standard stars was summed
over almost the entire spatial profile, leaving out just the two sky
windows. As it was recalled above, the response function for the flux
calibration was computed using the star LTT 3218. To do this, the
instrumental spectrum was corrected for atmospheric extinction, divided
by the exposure time, and then divided by the published spectrum,
and the ratio was fitted with a polynomial of degree 12. The spectrophotometric
standard was observed at several airmasses, and we checked that the
extinction-corrected and normalized spectra are almost identical,
thus confirming the extinction curve for La Silla provided by MIDAS.
The response function was then computed as the median of the five
functions found for the two nights. The pre-processed, wavelength-calibrated,
sky-subtracted and extracted spectra were thus finally flux-calibrated
using this response function.
The fluxes were measured within the ALICE CONTEX in
MIDAS. A fourth-degree continuum was fitted to the line-free
spectra, and then for each line the flux was summed within two wavelengths
bracketing the line. The blends H![]() +[O III]
+[O III]
![]() ,
H
,
H![]() +[N II]
+[N II]
![]() and the [S II]
doublet
and the [S II]
doublet
![]() were deconvolved using Gaussian
fits, and we ensured that the sum of the single line fluxes equaled
that of their blend. The measured line ratios were corrected for the
effects of reddening, measured by comparing the observed and the expected
hydrogen line ratios. The theoretical H line ratios of Hummer & Storey
(1987) were used, assuming an electron temperature
were deconvolved using Gaussian
fits, and we ensured that the sum of the single line fluxes equaled
that of their blend. The measured line ratios were corrected for the
effects of reddening, measured by comparing the observed and the expected
hydrogen line ratios. The theoretical H line ratios of Hummer & Storey
(1987) were used, assuming an electron temperature
![]() K. We set
K. We set
![]() ,
,
![]() and
and
![]() so that
so that
![]() .
The reddening constant was then computed using the Cardelli et al.
(1989) extinction law, where
.
The reddening constant was then computed using the Cardelli et al.
(1989) extinction law, where
![]()
![]() ,
and we assumed RV=3.1. We obtained the value of C both from
the ratio H
,
and we assumed RV=3.1. We obtained the value of C both from
the ratio H![]() /H
/H![]() and from H
and from H![]() /H
/H![]() .
These line ratios are affected by the unknown stellar absorption under
the H emission lines: we then corrected the fluxes assuming a constant
EW of the absorption lines, and adopted the EW that yielded the closest
values for the two C. In some cases we were not able to resolve
H
.
These line ratios are affected by the unknown stellar absorption under
the H emission lines: we then corrected the fluxes assuming a constant
EW of the absorption lines, and adopted the EW that yielded the closest
values for the two C. In some cases we were not able to resolve
H![]() from the [N II] lines; however, the flux
of the latter lines is at most a few percent of that of H
from the [N II] lines; however, the flux
of the latter lines is at most a few percent of that of H![]() ,
so we assumed that this correction is negligible. Since the H
,
so we assumed that this correction is negligible. Since the H![]() /H
/H![]() ratio is the more accurate, the value from this ratio was adopted to correct the observed fluxes, which were finally normalized to H
ratio is the more accurate, the value from this ratio was adopted to correct the observed fluxes, which were finally normalized to H![]() whose flux was set to 1.
whose flux was set to 1.
![\begin{figure}
\par\includegraphics[width=7.8cm,clip]{7617fig40.ps}\end{figure}](/articles/aa/full/2008/33/aa7617-07/img375.gif) |
Figure B.1: Response functions for each date of the Lick run: the solid curves are the functions for the blue and red spectra, the dashed curve is the full spectrum function (no dichroic), and the dotted lines are the functions for the high resolution spectra. The functions have been normalized to the peak response. |
| Open with DEXTER | |
In the following we will call blue, red, full, and high-resolution, the spectra taken with the blue arm and grism 830/3460, with the red arm and grating 300/4230 (plus dichroic D46), with the red arm and no dichroic, and with the red arm and grating 1200/5000, respectively.
The frame pre-processing, wavelength calibration, and flux calibration was done within ESO-MIDAS (and its ``context'' LONG), with a modified version of the quick-look tool described above. The procedure was similar to the EFOSC2 data reduction, except for the bias subtraction, which is done directly by the Kast acquisition system. All the frames were trimmed to remove the overscan regions, and then master flat-field (FF) and arc images were created. Three to five dome flat-field frames per spectrograph configuration were available, so a median frame was first created, and then the spectral signature of the lamp was removed by fitting a polynomial surface to the median FF, assuming that the polynomial does not vary along the spatial direction.
Our main concern in the data reduction was to ensure that, in the
overlap region, the fluxes of blue and red spectra are calibrated
with the smallest systematic uncertainties. This was particularly
difficult for the shortest wavelengths of the red spectra (blueward
of ![]() 5000 Å), where the response function drops steeply from
5000 Å), where the response function drops steeply from
![]() to zero in just
to zero in just ![]() 300 Å (see below and Fig. B.1).
This gradient is extremely sensitive to the FF correction in this
spectral region, and it was found that a polynomial of degree 7gave the best response function for the red spectra. For all other
spectra a degree 6 polynomial gave the best results.
300 Å (see below and Fig. B.1).
This gradient is extremely sensitive to the FF correction in this
spectral region, and it was found that a polynomial of degree 7gave the best response function for the red spectra. For all other
spectra a degree 6 polynomial gave the best results.
The arcs were used to remap the bidimensional spectra from the pixel-pixel
space to the wavelength-pixel space, thereby also correcting the off-axis
distortions of the optics, such that the spectrum could be extracted
by just defining a window in the spatial direction. The two Kast
lamps are filled with NeAr and HeHgCd, and since no cadmium or mercury
line lists are available in the MIDAS system, a suitable line
list was built from various sources. The computed dispersions and
wavelength coverages for each Kast configuration are given
in Table B.1. The dispersion is
![]() 1 Å px-1 for the blue and high resolution spectra,
and 4.6 Å px-1 for the red and full range spectra. The
resolution, as measured on the arc lines, is
1 Å px-1 for the blue and high resolution spectra,
and 4.6 Å px-1 for the red and full range spectra. The
resolution, as measured on the arc lines, is ![]() 3 Å FWHM and
3 Å FWHM and
![]() 10 Å FWHM for the high and low resolution spectra.
10 Å FWHM for the high and low resolution spectra.
In the next step, all the spectra were divided by the master FF and calibrated in wavelength, and then a preliminary extraction with a large window was done, in order to create sky images for each spectrum, that were used for the correction of the spectrograph flexures (see below). The sky frames were constructed by first creating the sky spectrum on the two sides of the central object, as an average within two windows. The flanking sky spectra were used to fit the sky gradient in the spatial direction, assumed to be linear and independent of wavelength, and the bidimensional artificial sky frames were made by simulating this gradient.
Table B.1: Dispersions and wavelength range for each date and Kast configuration.
By comparing the position of sky lines in different spectra, it was
soon realized that the spectrograph is subject to large flexures,
with spectrum-to-spectrum differences of up to 10 px, i.e. more
than 40 Å for the red spectra. This fact has several implications,
and at this point of the reduction it affects the definition of the
response function, in particular at the shortest wavelengths of the
red spectra. For this reason, the standard star spectra were registered
to rest-frame wavelengths before creating the response function. Due
to the short exposure times, the sky lines are almost absent from
the standard star spectra, so the shift in wavelength was computed
using the central wavelength of H![]() for the red spectra, and
H
for the red spectra, and
H![]() for the blue spectra. This approach works if the effect
of radial velocities on the position of the stellar lines is negligible.
This assumption was checked by comparing the relative position of
H
for the blue spectra. This approach works if the effect
of radial velocities on the position of the stellar lines is negligible.
This assumption was checked by comparing the relative position of
H![]() and the telluric triplet at
and the telluric triplet at ![]() 6870 Å. The average
difference over all standard stars is
6870 Å. The average
difference over all standard stars is
![]()
![]() 0.7 Å, and since the scatter is much less than the spectral dispersion, we conclude that indeed the effect of radial velocities (both intrinsic and due to the solar motion) is negligible, and that the barycenter
of the telluric triplet is at 6871.9 Å.
0.7 Å, and since the scatter is much less than the spectral dispersion, we conclude that indeed the effect of radial velocities (both intrinsic and due to the solar motion) is negligible, and that the barycenter
of the telluric triplet is at 6871.9 Å.
The shift in wavelength was then subtracted from the starting wavelength
of the bidimensional spectra, the standard star spectra were extracted
again, and the response function was defined by comparison to the
published spectrum. Again, the most difficult task is following the
response function for the red spectra blueward of ![]() 5000 Å. It was
found that a polynomial fit is not adequate even using the highest
degree implemented in MIDAS (30). We then used a spline of degree 1, which gave good results since the sample rate of the published fluxes
is a few Å. The master response function was decided by
flux-calibrating all the standard stars with a given response function,
and then by taking the one that gave the best average calibration for
all standards and over a range of airmasses (see
Fig. B.1). Due to the large wavelength
coverage, the most critical case is that of the red spectra, where we
expect a maximum difference of
5000 Å. It was
found that a polynomial fit is not adequate even using the highest
degree implemented in MIDAS (30). We then used a spline of degree 1, which gave good results since the sample rate of the published fluxes
is a few Å. The master response function was decided by
flux-calibrating all the standard stars with a given response function,
and then by taking the one that gave the best average calibration for
all standards and over a range of airmasses (see
Fig. B.1). Due to the large wavelength
coverage, the most critical case is that of the red spectra, where we
expect a maximum difference of ![]()
![]() from the red to the blue part
of the spectrum. For these spectra, the response function is able to
correct the instrumental flux down to 4300 Å.
from the red to the blue part
of the spectrum. For these spectra, the response function is able to
correct the instrumental flux down to 4300 Å.
Finally the galaxy spectra were extracted and flux-calibrated with a procedure resembling that adopted for the standard stars, but in this case the flexure correction was done with the very strong sodium sky line at 5892 Å. In order to have a good subtraction of the sky lines, the sky windows were chosen close to the object spectrum, and the best windows were decided on an object-by-object basis with several experiments. Also the windows for the object spectra needed a careful selection, in order to enhance the faint lines over the background, and to avoid as much as possible the places where the sky line subtraction was less than optimal.
Using the continuum in the overlap regions, the final spectra have
been obtained by merging the blue, red (or full in the case of DDO 42),
and high resolution spectra. This implies that a reliable merging
could be produced only for those spectra where a meaningful continuum
could be defined (i.e. those with the higher S/N), namely for the
regions in DDO 42, DDO 53, and UGC 4483. First, the continua have
been equalized in the overlap regions, and then the spectra have been
rebinned to a common 1 Å step, which is smaller than any of
the other dispersions. The equalization of the continua has been done
in the
![]() plane: a straight line has
been fitted to the continua, and then the difference d of the two
fits at the midpoint of the overlap region has been taken. The normalization
factor is then 10d. In the merged spectrum H
plane: a straight line has
been fitted to the continua, and then the difference d of the two
fits at the midpoint of the overlap region has been taken. The normalization
factor is then 10d. In the merged spectrum H![]() belongs
to the high-resolution spectrum, H
belongs
to the high-resolution spectrum, H![]() belongs to the red (or
full) spectrum, and H
belongs to the red (or
full) spectrum, and H![]() belongs to the blue spectrum. These
hydrogen lines were then used to perform some health checks on the
merged spectra. Both H
belongs to the blue spectrum. These
hydrogen lines were then used to perform some health checks on the
merged spectra. Both H![]() and H
and H![]() are present in the red
(or full) spectrum, so we first checked that the ratio of these two
lines is the same in the merged spectrum as in the red (or full) spectrum.
If that was not the case, corrections to the equalization factors
were introduced. H
are present in the red
(or full) spectrum, so we first checked that the ratio of these two
lines is the same in the merged spectrum as in the red (or full) spectrum.
If that was not the case, corrections to the equalization factors
were introduced. H![]() is present both in the blue and in the
red (or full) spectrum, however in that spectral region the response
function of the red (or full) spectrum reaches almost zero, so its
flux is rather uncertain. Comparing the flux of this line in the two
spectra is then not really meaningful, so we followed another approach.
For the Sculptor group dwarfs, Table 4
shows that the average flux of H
is present both in the blue and in the
red (or full) spectrum, however in that spectral region the response
function of the red (or full) spectrum reaches almost zero, so its
flux is rather uncertain. Comparing the flux of this line in the two
spectra is then not really meaningful, so we followed another approach.
For the Sculptor group dwarfs, Table 4
shows that the average flux of H![]() is
is
![]() ,
with a dispersion of
,
with a dispersion of
![]() .
Thus we made sure
that no strong deviations from this value were obtained: if the H
.
Thus we made sure
that no strong deviations from this value were obtained: if the H![]() flux was more than
flux was more than ![]() discrepant from the quoted value, we
adjusted the equalization factor to bring the flux into agreement
with the average value while maintaining a good overlap of the continua.
This meant reducing the deviations to less than
discrepant from the quoted value, we
adjusted the equalization factor to bring the flux into agreement
with the average value while maintaining a good overlap of the continua.
This meant reducing the deviations to less than ![]() .
.
Line fluxes were measured in the way described in Sect. A.2,
regarding EFOSC2 measurements. The difference is that a different
set of lines had to be deblended. In particular, [O II] 3727was deblended from two nearby unknown lines at 3722 Å and 3736 Å,
[O III]4363 was deblended from
![]() 4340,
and finally the Gaussian deblending was employed to separate [O II]7320from [O II]7330.
4340,
and finally the Gaussian deblending was employed to separate [O II]7320from [O II]7330.
The first step of the data reduction was to remove the sky background, and simultaneously, the dark current and bias. We subtracted from each object image the average of the preceding and the succeeding sky images. This strategy accounts for sky background variations with characteristic time comparable or a few times longer than the time spent at each pointing. For the first and the last object, we could only subtract the nearest sky image. Next, we carried out the flat field correction. A common median zero point was imposed to all available sky images, a median was obtained to produce a flat field, which was normalized to unity. Then, all sky-subtracted object images were divided by the flat-field. The bad pixels were masked out and all object images were aligned and combined to produce a final image for each target. In addition, for the SOFI data, we carried out an illumination correction to account for the difference between the sky illumination and the illumination of the dome screen used for flat-fielding, as described on the instrument webpages. The entire data reduction was carried out with standard IRAF tasks.
The photometric calibration was carried out by observations of standard
stars from Hunt et al. (1998) for the Northern objects,
and from Persson et al. (1998) for the Southern ones. The
INGRID data were photometrically calibrated with measurements of 129 standard stars in 13 fields from the night of Jan. 16, 2003, and the
SOFI data were calibrated with 13 standard stars observed during all
nights. Some galaxies were observed twice at the NTT to verify the
self consistency of the photometry and because the night of Oct. 15,
2002 was non-photometric, so all targets had to be re-observed during
the next night with shorter integration times. Finally, the calibration
of ESO 473-024 is based on a single standard, observed at the same
airmass as the target. The transformation equations are:
| (C.1) |
| (C.2) |
| (C.3) |