1 - National Radio Astronomy Observatory
2 - Australia Telescope National Facility, Epping, New South Wales, Australia, 2120, Australia
3 - National Radio Astronomy Observatory*, 520 Edgemont Road, Charlottesville, VA, 22903, USA
A&A 487, 419-429 (2008)
DOI: 10.1051/0004-6361:20079284
S. Bhatnagar1 - T. J. Cornwell2 - K. Golap1 - J. M. Uson3
1 - National Radio Astronomy Observatory![]() , 1003 Lopezville Road, Socorro, NM, 87801, USA
, 1003 Lopezville Road, Socorro, NM, 87801, USA
2 - Australia Telescope National Facility, Epping, New South Wales, Australia, 2120, Australia
3 - National Radio Astronomy Observatory*, 520 Edgemont Road, Charlottesville, VA, 22903, USA
Received 19 December 2007 / Accepted 3 June 2008
Abstract
Astronomical imaging using aperture synthesis telescopes
requires deconvolution of the point spread function as well as
calibration of instrumental and atmospheric effects. In general,
such effects are time-variable and vary across the field of view as
well, resulting in direction-dependent (DD), time-varying gains.
Most existing imaging and calibration algorithms assume that the
corruptions are direction independent, preventing even moderate
dynamic range full-beam, full-Stokes imaging. We present a general
framework for imaging algorithms which incorporate DD errors. We
describe as well an iterative deconvolution algorithm that corrects
known DD errors due to the antenna power patterns (including
errors due to the antenna polarization response) as well as pointing
errors for high dynamic range full-beam polarimetric imaging. Using
simulations we demonstrate that errors due to realistic primary
beams as well as antenna pointing errors will limit the dynamic
range of upcoming higher sensitivity instruments like the EVLA and
ALMA and that our new algorithm can be used to correct for such
errors. We show that the technique described here corrects for
effects that can be described as approximate unitary operators in
the interferometric measurement equation, such as those due to
antenna pointing errors and non-azimuthally symmetric antenna power
patterns. We have applied this algorithm to VLA 1.4 GHz
observations of a field that contains two ``4C'' sources and have
obtained Stokes I and V images with systematic errors that are one
order of magnitude lower than those obtained with conventional
imaging tools. Residual systematic errors that are seen at a level
slightly above that of the thermal noise are likely due to selfcalibration instabilities that are triggered by a combination of unknown pointing errors and errors in our assumption of the shape of the primary beam of each antenna. We hope to present a more refined algorithm to deal with the fully general case in due course. Our simulations show that on data with no other calibration errors, the algorithm corrects pointing errors as well as errors due to known
asymmetries in the antenna pattern.
Key words: methods: data analysis - techniques: interferometic - techniques: image processing - techniques: polarimetric
Astronomical observations made with interferometric radio telescopes suffer from variable gain effects which can be broadly classified as direction-independent (DI) and direction-dependent (DD) errors. The complex instrumental gains due to the electronic devices that follow the feed elements are directionally independent, whereas the time-varying gains due to the antenna primary beams provide an example of direction-dependent gains. Direction-independent effects may be corrected separately from imaging, so most processing algorithms have been limited to treating such effects. Direction-dependent gains are more difficult to incorporate since they must be applied during imaging which has slowed progress thus far. This must now change, however, because direction dependent gains are expected to limit observations with existing as well as next generation telescopes presently under construction. Indeed, a number of deep observations made with present telescopes have been limited already by direction-dependent, time-variable errors. In this, the first of two papers, we present an algorithmic framework that allows incorporation of a class of directionally dependent gain effects during deconvolution. A key part of this framework is the provision of an efficient transform between the data and image domains. As an example of the application of this framework, we demonstrate that the effects of known antenna pointing errors and beam polarization can be corrected during imaging. We also discuss error propagation and the required computing resources. A second paper will describe an algorithm constructed within this framework that allows solving for parameters that describe such gain changes.
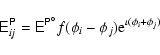
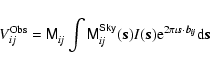
The measurement equation that describes astronomical imaging using
aperture synthesis telescopes can be compactly written using the
Hamaker-Bregman-Sault notation (Hamaker et al. 1996) as![]() :
:
Measurements sample this equation, providing constraints on the
unknowns on the right hand side. The sky brightness distribution
![]() has to be estimated in the presence of known or unknown gain terms
has to be estimated in the presence of known or unknown gain terms
![]() and
and
![]() .
However, the measurement equation cannot simply be inverted as it is not a Fourier transform. Furthermore, as is the case for simpler forms of the measurement equation, the visibility is sampled only at a limited set of points so there is insufficient information to determine the solution exactly. We follow the normal terminology and call the estimation of the sky brightness ``deconvolution'' though it is only vaguely related to the typical deconvolution of a shift-invariant point-spread function (Andrews & Hunt 1977). The other part of imaging is the (necessary) estimation and correction of the gains either assuming that the sky brightness distribution is known (``calibration'') or determined simultaneously (``self-calibration'').
.
However, the measurement equation cannot simply be inverted as it is not a Fourier transform. Furthermore, as is the case for simpler forms of the measurement equation, the visibility is sampled only at a limited set of points so there is insufficient information to determine the solution exactly. We follow the normal terminology and call the estimation of the sky brightness ``deconvolution'' though it is only vaguely related to the typical deconvolution of a shift-invariant point-spread function (Andrews & Hunt 1977). The other part of imaging is the (necessary) estimation and correction of the gains either assuming that the sky brightness distribution is known (``calibration'') or determined simultaneously (``self-calibration'').
Most often, deconvolution and self-calibration are performed using simple steepest-descent algorithms. The residuals are minimized in the least square sense by minimizing ![]() which can be expressed in terms of the data (
which can be expressed in terms of the data (![]() )
and the model data (
)
and the model data (![]() )
as
)
as
![\begin{displaymath}\chi^2 = \left[\vec{V}-\vec{V}^M\right]^{\dag } \Lambda \left[\vec{V} - \vec{V}^M\right]
\end{displaymath}](/articles/aa/full/2008/31/aa9284-07/img39.gif) |
(2) |
There are cases in which the deconvolution and correction for the
Mueller matrix can be decoupled. For example, direction dependent
effects which are identical for all the measurements can be removed by
dividing the deconvolved image by
![]() .
The correction for an azimuthally symmetric and time-constant antenna power pattern provides one such example. The deconvolution is then performed on the entire data set, ignoring the antenna power pattern, whose inverse function is applied to the image only after the deconvolution and self-calibration have been completed. However, this assumption often breaks down. For example, the antenna power pattern for most practical antenna geometries is azimuthally asymmetric (because of off-axis feed position, asymmetric subreflector, feed-legs, ...) and rotates on the sky for azimuth-elevation mount telescopes resulting in off-axis gains which vary with parallactic angle (PA). In such case, processing time slices of the data independently might lower the range of the gain variations in each subset. The final deconvolved images for each subset are averaged post-deconvolution. This is straightforward and often used, but can be expected to be sub-optimal because the deconvolution step is inherently non-linear and higher PSF sidelobes for individual subsets increase the level of (non-symmetric) deconvolution errors in each sub-image. Hence it would seem preferable to follow a procedure that applied the corrections while imaging the full data set.
.
The correction for an azimuthally symmetric and time-constant antenna power pattern provides one such example. The deconvolution is then performed on the entire data set, ignoring the antenna power pattern, whose inverse function is applied to the image only after the deconvolution and self-calibration have been completed. However, this assumption often breaks down. For example, the antenna power pattern for most practical antenna geometries is azimuthally asymmetric (because of off-axis feed position, asymmetric subreflector, feed-legs, ...) and rotates on the sky for azimuth-elevation mount telescopes resulting in off-axis gains which vary with parallactic angle (PA). In such case, processing time slices of the data independently might lower the range of the gain variations in each subset. The final deconvolved images for each subset are averaged post-deconvolution. This is straightforward and often used, but can be expected to be sub-optimal because the deconvolution step is inherently non-linear and higher PSF sidelobes for individual subsets increase the level of (non-symmetric) deconvolution errors in each sub-image. Hence it would seem preferable to follow a procedure that applied the corrections while imaging the full data set.
In this section, we consider in detail an example of directionally dependent gains - the antenna far-field voltage pattern.
The far-field voltage pattern is the Fourier transform of the antenna
illumination function (Kraus 1986). Thus it is typically the case
that because of the details of the antenna geometry (such as quadrupod
legs) and feed design, the antenna voltage patterns are azimuthally
asymmetric. Furthermore, the polarization response of the antenna
will vary away from the antenna optical axis due to antenna geometry
and the physics of the reflection of electromagnetic waves from curved
surfaces. In addition, as an interferometric array composed of
altitude-elevation mounted antennas tracks a region of the sky, these
asymmetrical antenna voltage patterns rotate on the sky. This, along
with significant time varying antenna pointing errors, makes
![]() time varying and different for each antenna pair
(interferometric baseline). Even equatorially mounted antennas share
in this problem to the extent that changes in elevation (temperature)
might deform the antennas due to gravity (dilation).
time varying and different for each antenna pair
(interferometric baseline). Even equatorially mounted antennas share
in this problem to the extent that changes in elevation (temperature)
might deform the antennas due to gravity (dilation).
The Mueller matrix is an outer product of the two antenna based Jones matrices (Hamaker et al. 1996; Jones 1941). A full direction-dependent polarimetric description requires a Jones matrix per pixel in the image. For the two orthogonal polarizations, labeled p and q, the Sky Jones matrix as a function of direction is given by:
The full direction-dependent Sky Mueller matrix
![]() for baseline
i-j is a
for baseline
i-j is a ![]() matrix:
matrix:
![\begin{figure}
\par\includegraphics[width=7cm,clip]{9284F1a.eps}\includegraphics[width=7cm,clip]{9284F1b.eps}\end{figure}](/articles/aa/full/2008/31/aa9284-07/img56.gif) |
Figure 1:
The image in the left panel shows a typical (first) diagonal term for the VLA at 1.4 GHz
|
| Open with DEXTER | |
![\begin{figure}
\par\includegraphics[width=7cm,clip]{9284F2a.eps}\includegraphics[width=7cm,clip]{9284F2b.eps}\end{figure}](/articles/aa/full/2008/31/aa9284-07/img60.gif) |
Figure 2:
The off-diagonal terms of the Sky Mueller matrix for
VLA antennas at 1.4 GHz. The image in the left panel is of first
order in the antenna leakage (
|
| Open with DEXTER | |
For high dynamic range imaging (![]()
![]() ), the
off-diagonal terms of the Mueller matrix are non-negligible, vary
across the entire beam and, typically, increase substantially with
distance from the center. Figure 2 shows typical off-diagonal terms for the VLA (the
cross polar power patterns
), the
off-diagonal terms of the Mueller matrix are non-negligible, vary
across the entire beam and, typically, increase substantially with
distance from the center. Figure 2 shows typical off-diagonal terms for the VLA (the
cross polar power patterns
![]() and
and
![]() ). These are the higher
order leakage terms and are purely due to the leakage of the
orthogonal polarization signals into the complementary polarization in
the signal path from various antennas The term shown in the
left-hand-side panel is the first order leakage term and has peak
amplitude relative to the diagonal terms of
). These are the higher
order leakage terms and are purely due to the leakage of the
orthogonal polarization signals into the complementary polarization in
the signal path from various antennas The term shown in the
left-hand-side panel is the first order leakage term and has peak
amplitude relative to the diagonal terms of ![]() 10-2. Since this
is comparable to the difference between the diagonal terms, ignoring
this term will result in imaging artifacts similar to those due to the
assumption that parallel- and cross-hand power patterns are identical.
The second order term
10-2. Since this
is comparable to the difference between the diagonal terms, ignoring
this term will result in imaging artifacts similar to those due to the
assumption that parallel- and cross-hand power patterns are identical.
The second order term
![]() ,
shown
in the right hand side panel, has an amplitude of
,
shown
in the right hand side panel, has an amplitude of
![]() .
Consequently, for high dynamic range imaging (
.
Consequently, for high dynamic range imaging (![]()
![]() ),
the
),
the
![]() cannot be approximated as even a diagonally
dominant matrix. For even moderate dynamic range full-Stokes,
full-beam imaging, this difference needs to be taken into account.
cannot be approximated as even a diagonally
dominant matrix. For even moderate dynamic range full-Stokes,
full-beam imaging, this difference needs to be taken into account.
Existing calibration procedures split the errors into two antenna
based Jones matrices - the
![]() and
and
![]() matrices
for complex gain and polarization leakage, respectively.
matrices
for complex gain and polarization leakage, respectively.
![]() is assumed to be purely diagonal while
is assumed to be purely diagonal while
![]() is unity along the
diagonal and the off-diagonal terms are the leakage gains
(Hamaker et al. 1996). The directional dependence of these terms is ignored and
the values of the complex gains and leakage gains at the center of the
field are used throughout the beam. Typically, polarization leakage
is small near the optical axis of the antenna. Hence,
for imaging compact sources at the center of the beam, the Sky
Mueller matrix is diagonally dominant and the above approximation is
justified. When imaging fields with significant emission throughout
the primary beam, this approximation will lead to artifacts and
significantly lower image fidelity away from the image center. This is
even more true for the case of mosaic imaging (Cornwell 1988)
where there is significant flux density throughout the primary beam for
most pointings.
is unity along the
diagonal and the off-diagonal terms are the leakage gains
(Hamaker et al. 1996). The directional dependence of these terms is ignored and
the values of the complex gains and leakage gains at the center of the
field are used throughout the beam. Typically, polarization leakage
is small near the optical axis of the antenna. Hence,
for imaging compact sources at the center of the beam, the Sky
Mueller matrix is diagonally dominant and the above approximation is
justified. When imaging fields with significant emission throughout
the primary beam, this approximation will lead to artifacts and
significantly lower image fidelity away from the image center. This is
even more true for the case of mosaic imaging (Cornwell 1988)
where there is significant flux density throughout the primary beam for
most pointings.
Therefore for high dynamic range full beam imaging, full treatment of polarization has to be kept in the entire imaging and calibration process. We refer to this as J-Matrix based imaging and calibration. Stokes images have to be made from the linear addition of the visibilities from all polarization products, weighted by the appropriate terms of the Sky Mueller matrix. Strictly speaking, even conventional Stokes-I imaging using only the parallel hand visibilities is incorrect. For moderate dynamic range full beam, full Stokes imaging, it may be possible to use only the diagonal terms of the Sky Mueller matrix. Note that the computational load of J-Matrix based imaging is a factor of four higher than the corresponding load for conventional imaging (where the J-Matrix is assumed to be purely diagonal).
As described above, most iterative deconvolution algorithms derive updates (
![]() )
to the existing model image (
)
to the existing model image (![]() )
from the gradients of chi-square with respect to the unknown sky brightness:
)
from the gradients of chi-square with respect to the unknown sky brightness:
 |
(5) |
Typically, the model image is iteratively improved as:
![\begin{displaymath}\vec{I}^M_i ={\ensuremath{\mathsf{T^{}_{}}} }\left(\vec{I}^M_{i-1}, \left[{\vec{I}^R_i}\right]\right)
\end{displaymath}](/articles/aa/full/2008/31/aa9284-07/img71.gif) |
(6) |
![\begin{figure*}
\par\includegraphics[width=7cm,clip]{9284F3a.eps}\includegraphics[width=7cm,clip]{9284F3b.eps}\end{figure*}](/articles/aa/full/2008/31/aa9284-07/img78.gif) |
Figure 3:
The off-diagonal term of
|
| Open with DEXTER | |
Following terminology established by Clark (1980), the calculation of
the derivative for a given estimate is called the major cycle,
and the application of the
![]() operator is called the minor cycle. The minor cycle typically operates in the
Stokes frame. The operator
operator is called the minor cycle. The minor cycle typically operates in the
Stokes frame. The operator
![]() includes conversions
between the signal-domain polarization frame and the Stokes frame
using an appropriate coordinate transform operator (Hamaker et al. 1996).
includes conversions
between the signal-domain polarization frame and the Stokes frame
using an appropriate coordinate transform operator (Hamaker et al. 1996).
The major cycle can be broken into two calculations:
![\begin{displaymath}\vec{I}^{R}=\left[{\ensuremath{\mathsf{A}} }^{\dag }{\ensurem...
...f{A}} }\right]^{-1}{\ensuremath{\mathsf{A}} }^\dag\vec{V}^{R}.
\end{displaymath}](/articles/aa/full/2008/31/aa9284-07/img81.gif) |
(8) |
The similarity between Eqs. (9) and (7) indicates
that direction-dependent gains can be incorporated as part
of the deconvolution iterations by using an efficient algorithm for
the forward and backward calculations. We have chosen to use a
technique similar to that used in the w-projection algorithm to
correct for the effects of non co-planar baselines
(Cornwell et al. 2003). As discussed in Sect. 4.1,
an approximately unitary operator
![]() can be
constructed as the Fourier transform of Eq. (4). For our
purpose, using
can be
constructed as the Fourier transform of Eq. (4). For our
purpose, using
![]() as the interpolation operator for
gridding the visibilities on a regular grid and using FFT to invert
the gridded visibilities would suffice. The accuracy of the forward
calculation is proportional to the accuracy of
as the interpolation operator for
gridding the visibilities on a regular grid and using FFT to invert
the gridded visibilities would suffice. The accuracy of the forward
calculation is proportional to the accuracy of
![]() which can,
in principle, be arbitrarily precise (e.g. by accurate measurement of the
antenna voltage pattern). An iterative deconvolution scheme using
such transforms should ultimately drive the residual image to be
noise-like, although it would seem desirable to limit the number of free
parameters introduced in the process. Note that since the final model image is iteratively
built using accurate computations only in one direction, the intermediate residual dirty images have no physical meaning as is usually the case.
which can,
in principle, be arbitrarily precise (e.g. by accurate measurement of the
antenna voltage pattern). An iterative deconvolution scheme using
such transforms should ultimately drive the residual image to be
noise-like, although it would seem desirable to limit the number of free
parameters introduced in the process. Note that since the final model image is iteratively
built using accurate computations only in one direction, the intermediate residual dirty images have no physical meaning as is usually the case.
![]() affects the measurements as described by Eq. (1).
The forward and backward transforms discussed above crucially depend
on
affects the measurements as described by Eq. (1).
The forward and backward transforms discussed above crucially depend
on
![]() being at least approximately unitary. Since
being at least approximately unitary. Since
![]() is an outer product of antenna based Jones matrices
(Eq. (3)) and
is an outer product of antenna based Jones matrices
(Eq. (3)) and
![]() where
where
![]() represents the
element-by-element Fourier transform of its argument, for our
purpose it is sufficient to ensure that the
represents the
element-by-element Fourier transform of its argument, for our
purpose it is sufficient to ensure that the
![]() is
approximately unitary
is
approximately unitary![]() . The
diagonal terms of
. The
diagonal terms of
![]() (of the form
(of the form
![]() )
correspond to the ideal (un-squinted) power
patterns and are nearly equal to each other. Figure 3 shows
the real and imaginary parts of the off-diagonal term normalized by
det
)
correspond to the ideal (un-squinted) power
patterns and are nearly equal to each other. Figure 3 shows
the real and imaginary parts of the off-diagonal term normalized by
det
![]() .
The peak amplitude is about two
orders of magnitude lower than the diagonal term making
.
The peak amplitude is about two
orders of magnitude lower than the diagonal term making
![]() approximately unitary. Image plane corrections therefore can be
incorporated as part of the image deconvolution procedure by using
approximately unitary. Image plane corrections therefore can be
incorporated as part of the image deconvolution procedure by using
![]() and
and
![]() as part of the forward and reverse transforms between
the visibility and image domains for baseline i-j.
as part of the forward and reverse transforms between
the visibility and image domains for baseline i-j.
Our deconvolution algorithm proceeds as follows:
In the following section, we describe how the forward and backward calculations can account correctly for polarization leakage and pointing errors.
![\begin{figure}
\par\vbox{
\hskip 0.3cm
\hbox{
\includegraphics[width=7.8cm,clip]...
...lip]{9284F4c.eps}\includegraphics[width=7.8cm,clip]{9284F4d.eps} }}
\end{figure}](/articles/aa/full/2008/31/aa9284-07/img117.gif) |
Figure 4:
The top row shows the Stokes-I images and the bottom
row shows the Stokes-V images. The images on the left were made
without squint and pointing correction while those on the right had
both corrections applied. The deconvolution errors seen around the
strongest sources are due to the antenna pointing errors and time
varying direction dependent gain due to the rotation of azimuthally
asymmetric antenna power patterns. These images were made using a
linear transfer function with the gray scales in the range
- |
| Open with DEXTER | |
The backward calculation can be realized by using
![]() as the interpolation operator for re-sampling
as the interpolation operator for re-sampling
![]() (the visibilities for the polarization product
(the visibilities for the polarization product
![]() )
on a regular grid at pixels labeled by indices (n,m) as:
)
on a regular grid at pixels labeled by indices (n,m) as:
The algorithm was tested for VLA squint and gain variations due to the rotation of azimuthally asymmetric antenna power patterns on the sky.
The visibilities were simulated using the
![]()
![]() package with the parameters listed in
Table 1.
A model for typical sky emission at 1420 MHz was
generated using the NVSS source list. The actual rendition has 74 point sources with flux densities ranging between 195 mJy and 2 mJy.
A PA increment of
package with the parameters listed in
Table 1.
A model for typical sky emission at 1420 MHz was
generated using the NVSS source list. The actual rendition has 74 point sources with flux densities ranging between 195 mJy and 2 mJy.
A PA increment of ![]() was used in order to simulate the
rotation of the R- and L-beams on the sky. The visibilities were
simulated for VLA C-array and an rms noise of
was used in order to simulate the
rotation of the R- and L-beams on the sky. The visibilities were
simulated for VLA C-array and an rms noise of ![]() 1 mJy per
visibility sample was added to simulate an image plane rms noise of
1 mJy per
visibility sample was added to simulate an image plane rms noise of
![]() 1
1 ![]() Jy/beam. Without squint correction, the peak and rms noise
in the resultant Stokes-V image were
Jy/beam. Without squint correction, the peak and rms noise
in the resultant Stokes-V image were ![]() 2 mJy and
2 mJy and
![]() 10
10 ![]() Jy/beam respectively. The Stokes-V image generated using
the algorithm described in this paper was noise-like with an rms
Jy/beam respectively. The Stokes-V image generated using
the algorithm described in this paper was noise-like with an rms ![]() 1
1 ![]() Jy/beam. The squint correction results in an improvement of the
noise figure by a factor of
Jy/beam. The squint correction results in an improvement of the
noise figure by a factor of ![]() 10. The visibilities with pointing
errors were simulated by predicting the model visibilities using the
forward transform (Sect. 5.1) with
10. The visibilities with pointing
errors were simulated by predicting the model visibilities using the
forward transform (Sect. 5.1) with
![]() computed for increments of
computed for increments of ![]() in PA. A model for the VLA
aperture illumination pattern
(Brisken 2003) was used to generate a
non-azimuthally symmetric power pattern. The model includes the
geometry of the sub-reflector and the feed position as well as the
aperture blockage due to the feed legs and the sub-reflector. The
averages of the pointing errors for each antenna were randomly
distributed between
in PA. A model for the VLA
aperture illumination pattern
(Brisken 2003) was used to generate a
non-azimuthally symmetric power pattern. The model includes the
geometry of the sub-reflector and the feed position as well as the
aperture blockage due to the feed legs and the sub-reflector. The
averages of the pointing errors for each antenna were randomly
distributed between ![]()
![]() with an rms of
with an rms of
![]() .
The
images were deconvolved using standard image deconvolution procedures
and again using the above algorithm. The Stokes-I images are shown in
Fig. 4. As expected, the deconvolution errors were maximal
for the sources around the half-power point and in the first sidelobe
of the power pattern. These errors were eliminated when the pointing
and squint correction were applied during deconvolution. The bottom panels
of Fig. 4 show the Stokes-V images without and with pointing
and squint corrections.
.
The
images were deconvolved using standard image deconvolution procedures
and again using the above algorithm. The Stokes-I images are shown in
Fig. 4. As expected, the deconvolution errors were maximal
for the sources around the half-power point and in the first sidelobe
of the power pattern. These errors were eliminated when the pointing
and squint correction were applied during deconvolution. The bottom panels
of Fig. 4 show the Stokes-V images without and with pointing
and squint corrections.
Table 1: Simulation parameters.
![\begin{figure}
\par\includegraphics[width=7.6cm,clip]{9284F5a.eps}\includegraphics[width=7.6cm,clip]{9284F5b.eps}\end{figure}](/articles/aa/full/2008/31/aa9284-07/img130.gif) |
Figure 5:
The Stokes-I images at 1.4 GHz with VLA C-array observation. The left panel shows the deconvolved image without corrections of the antenna power pattern variations as a function of
parallactic angle. The right panel shows the result from the algorithm described in this paper. The two dominant sources, on either side of the pointing center have flux densities of |
| Open with DEXTER | |
![\begin{figure}
\par\includegraphics[width=7.6cm,clip]{9284F6a.eps}\includegraphics[width=7.6cm,clip]{9284F6b.eps}\end{figure}](/articles/aa/full/2008/31/aa9284-07/img131.gif) |
Figure 6:
The Stokes-V images for a 1.4 GHz VLA C-array data. The left and right panels show the images without and with PB-corrections. A linear
transform
with a range |
| Open with DEXTER | |
The algorithm was also tested for Stokes-I and -V imaging using VLA
1.4 GHz observations of the superthin galaxy IC2233
(Matthews & Uson 2008). The field contains two strong sources
(![]() 854 mJy/beam and
854 mJy/beam and ![]() 145 mJy/beam) on opposite sides of the
pointing center, located at positions of
145 mJy/beam) on opposite sides of the
pointing center, located at positions of ![]() 75% and
75% and ![]() 35%
primary beam response levels respectively. The observations were made
in spectral mode with channels of width
35%
primary beam response levels respectively. The observations were made
in spectral mode with channels of width ![]() 24 kHz for a total of
24 kHz for a total of
![]() 11.6 h in 2 passes with well distributed uv-coverage. The
line-free channels (11 from the second ``IF pair'') were used for the
tests described here. The aperture illumination pattern for each
antenna was assumed to be the same and computed using the model for
VLA antennas (Brisken 2003). The aperture illuminations were
computed as a function of PA in increments of
11.6 h in 2 passes with well distributed uv-coverage. The
line-free channels (11 from the second ``IF pair'') were used for the
tests described here. The aperture illumination pattern for each
antenna was assumed to be the same and computed using the model for
VLA antennas (Brisken 2003). The aperture illuminations were
computed as a function of PA in increments of ![]() .
The expected
thermal noise for this data is
.
The expected
thermal noise for this data is ![]() 0.13 mJy/beam. The results of the
imaging run with and without the correction for time-varying primary
beam gains and polarization squint are shown in
Figs. 5 and 6. The peak
negative and positive residual in the Stokes-V images without primary
beam correction is -9.7 mJy/beam and 2.8 mJy/beam respectively.
After the primary beam correction, the peaks were
0.13 mJy/beam. The results of the
imaging run with and without the correction for time-varying primary
beam gains and polarization squint are shown in
Figs. 5 and 6. The peak
negative and positive residual in the Stokes-V images without primary
beam correction is -9.7 mJy/beam and 2.8 mJy/beam respectively.
After the primary beam correction, the peaks were ![]() 0.5 mJy/beam
and uncorrelated with location of the bright sources, with an rms
noise of 0.15 mJy/beam.
0.5 mJy/beam
and uncorrelated with location of the bright sources, with an rms
noise of 0.15 mJy/beam.
Convergence of the deconvolution iterations is judged by the statistics in the residual image at convergence. Errors in the final residual image purely due to primary beam (PB) effects (within the
main-lobe) can be expressed as:
![\begin{displaymath}\vec{I}^R = \sum_{\psi} PS\!F(\psi)\star \left[\Delta PB(\psi) \vec{I}^\circ\right]
\end{displaymath}](/articles/aa/full/2008/31/aa9284-07/img133.gif) |
(13) |
![\begin{displaymath}\left.I^R\right\vert _{\max} =
\left[\left.PS\!F_{\rm sidelob...
...ght] \left[\left.\Delta PB(\psi_i)\right\vert _{\max}\right]S.
\end{displaymath}](/articles/aa/full/2008/31/aa9284-07/img142.gif) |
(14) |
![\begin{figure}
\par\includegraphics[width=7cm,clip]{9284F7.eps}\end{figure}](/articles/aa/full/2008/31/aa9284-07/img143.gif) |
Figure 7:
Model for the VLA 1.4 GHz antenna at
Parallactic Angle |
| Open with DEXTER | |
![\begin{figure}
\par\includegraphics[width=8cm,clip]{9284F8.eps}\end{figure}](/articles/aa/full/2008/31/aa9284-07/img144.gif) |
Figure 8:
Difference between an instantaneous Stokes-I PB and an
azimuthally averaged PB (
|
| Open with DEXTER | |
The deconvolution algorithm described above consists essentially of approximating the function shown in Fig. 9 (or equivalently the 2D function shown in Fig. 7) by a piece-wise
constant function. The maximum error due to such an approximation can
be estimated using the following equation:
| |
= | (15) | |
| = | ![$\displaystyle S~\left[\left.PS\!F_{\rm sidelobe}\right\vert _{\max}\right]~\left.\frac{\partial{PB}}{\partial\psi}\right\vert _{\max}.$](/articles/aa/full/2008/31/aa9284-07/img151.gif) |
 |
(16) |
The PA increment for higher sensitivity telescopes like the EVLA or SKA such that imaging is not limited by the above approximation will be much smaller. This requirement however can be significantly relaxed by approximating the error function by a piecewise linear approximation (interpolation of the functions computed at larger PA increments). Furthermore, since image interpolation itself can be expensive, caching of pre-computed aperture functions at appropriate PA increments will be necessary. Note that the gridding cost is relatively insensitive to the number of convolution functions used. A hybrid approach of FFT based transforms plus analytical computations for the strongest sources will probably deliver optimal performance.
Some residual deconvolution errors are still left around the second strongest source in Fig. 5. The pattern in the residual image (not shown) suggests that these errors are due to image pixelation (Voronkov & Wieringa 2004; Cotton & Uson 2007). More sophisticated parametrization of the sky, independent of the image pixel size (e.g. as is done in scale sensitive deconvolution algorithms like the Asp-Clean (Bhatnagar & Cornwell 2004) or MS-Clean) along with the imaging algorithm described here to correct for DD gains should give better results. It is also possible that the residual errors are due to pointing errors during the observation. We are investigating this possibility and hope to report on it in due course.
![\begin{figure}
\par\includegraphics[width=80mm,clip]{9284F9.eps}\end{figure}](/articles/aa/full/2008/31/aa9284-07/img155.gif) |
Figure 9:
Azimuthal cut through |
| Open with DEXTER | |
The algorithm described here corrects for DD gains without loosing the efficiency advantage of the FFT algorithm. Our algorithm scales well in run-time efficiency and implementation complexity for large data volume, complex field as well as for arrays where antenna elements cannot be assumed to be identical.
Various variants of the ``Peeling'' algorithm can also be used to correct for direction-dependent gains. In this approach antenna based gains are determined in the direction of each compact source. These gains are then used to subtract the contribution of compact sources from the observed data using a Direct Fourier Transform (DFT) and the residual visibilities are imaged again. While this is useful in removing the artifacts due to strong compact sources, since the gains are determined independently for each direction in the sky, as the image complexity increases, too many degrees of freedom (d.o.f.) might be added to the problem. For crowded fields (large number of compact sources), this leads to a proliferation of d.o.f.s and potentially to the problem of over-fitting (the extreme case being when each pixel in the image has an associated independent gain which gives the best-fit result). Since DFTs have to be used to compute residuals, the computing load is also significantly higher than the corresponding one for FFT-based computation of residuals. For complex fields containing extended emission, this approach quickly becomes numerically un-viable because of the large number of d.o.f.s included as well as the high computing and I/O loads involved. Therefore, while variants of the Peeling algorithm could have given better results for the particular 1.4 GHz VLA data that we have used in this paper, we did not resort to Peeling based algorithms. However since the goal here is to demonstrate the effectiveness of the algorithm in correcting for otherwise difficult to correct DD gains, we used this relatively simple field for our tests so that the advantages and limitations of our algorithm are brought to the fore.
Of course, using a direct Fourier transform (DFT) for predicting model visibilities rather than using the FFT algorithm will give the most accurate results. While such a brute-force approach might be useful for simple fields, as mentioned above, the computing cost for even such simple fields becomes prohibitive for data with more than a few frequency channels, even when assuming that the various antenna elements are identical. For cases where this assumption breaks down, as it does even for the simple case of random antenna pointing errors, computing costs are impractically high. Furthermore, for full-beam, full-Stokes imaging, which requires use of at least the diagonal terms of the Mueller matrix (Eq. (4)) if not the full matrix, it is unclear if a brute-force DFT approach will work.
Antenna pointing errors, azimuthally asymmetric aperture illuminations, wide bandwidths and deconvolution errors due to the use of discrete pixels for the sky representation all leave residuals that limit the full-beam imaging dynamic range to 104-105. Therefore, apart from correcting for the direction dependent effects, for the highest imaging dynamic range, scale-sensitive decomposition of the sky might also be necessary (Bhatnagar & Cornwell 2004). The algorithm described here can be combined efficiently with scale-sensitive deconvolution and has the potential of overcoming the above mentioned imaging dynamic range limit.
The algorithm described here accounts for the time varying gain variations due to the rotation of the azimuthally asymmetric aperture illumination with PA. For imaging with a large bandwidth ratio (e.g. the ratio of frequencies at the two edges of the observing band for EVLA will be 2:1), the dominant error term will be the scaling of the power pattern with frequency. Sources which will be well within the main lobe of the primary beam at the lower frequency end of the band will be outside the main lobe at the higher frequency end (and may even appear in the first sidelobe). Since the azimuthal variations in the power pattern due to feed-leg/sub-reflector blockage are maximal close to the null and in the first sidelobe, frequency scaling of the aperture illumination will contribute a first-order error.
Scaling of the antenna power patterns with frequency in observations with wide bandwidths can be incorporated in the algorithm described here by computing the aperture illumination functions at appropriate increments in frequency. Alternatively, depending on the required accuracy, this scaling can be achieved as well by scaling the co-ordinates with frequency. Since the computing cost scales weakly with the number of convolution functions used, the extra computing load will not be too high. The cost of computing the aperture functions itself will be significant, but it is a one-time cost.
Rotation of the sidelobes results in gain variations on the order of a factor of two in the direction of the sidelobes. For mosaic observations, this will contribute significant time-varying flux density in most individual pointings; assuming a peak PSF sidelobe of 10%, the error inside the main lobe of the power pattern will be at the level of a few percent of the peak flux in the direction of the first sidelobe of the antenna power pattern. This will limit the mosaicking dynamic range significantly, indeed it will be a first-order effect. In addition, a second-order effect will be due to antenna pointing errors. Correction of both of these effects will be required for mosaicking instruments presently under construction like the ALMA and the ASKAP (Johnston 2007). The general framework and the algorithm described here can be generalized easily for application to mosaic imaging and could correct errors due to the rotation of antenna primary beams as well as pointing errors. In practice however, the imaging dynamic range might be limited by the precision with which antenna power patterns and pointing errors can be determined. Furthermore, a similar approach can be used for imaging with inhomogeneous arrays like CARMA/ALMA (where not all antennas in the array are identical) as well as with arrays with multi-feed antennas like the ASKAP. Finally, for very high dynamic range imaging with telescopes like LOFAR, SKA, and even EVLA, nominally identical antenna elements may have variations that will induce errors higher than the thermal noise limit. In that sense, such telescopes will also need to be treated as inhomogeneous arrays.
Existing imaging algorithms ignore the effects of time varying gains due to antenna pointing errors and rotation of azimuthally asymmetric antenna power patterns. As shown in Sects. 6 and 7 using the VLA as an example, residual errors due to these effects are maximal in the first sidelobe and significant even within the main lobe of the antenna power pattern. Simulations show that the errors due to these effects limit the achievable dynamic range for sensitive radio interferometers under construction like the EVLA, ALMA and ASKAP. The full polarimetric response of the antenna is also inherently asymmetric due to the physics of reflection from curved surfaces. In addition, the voltage patterns of the two orthogonal polarizations for the VLA antennas are separated on the sky (polarization squint) resulting in increasing instrumental Stokes-V as a function of distance from the image center. Therefore, for moderate dynamic range full-beam, full-Stokes imaging, the Sky Jones matrix for the VLA antennas cannot be assumed to be scaled-identity or even diagonal. Even for antennas without polarization squint, the off-diagonal terms will remain significant, even though the difference between the parallel-hand terms may be negligible. Hence, full-Sky Jones matrix treatment is necessary for full Stokes imaging of most observed fields. This implies a four-fold increase in the computing load when compared to imaging when primary beam effects are neglected.
The deconvolution algorithm described in this paper corrects for
systematic effects due to non-ideal primary beams by modeling the
complex antenna aperture illumination for the two orthogonal
polarizations as a function of parallactic angle and antenna pointing
errors. The antenna aperture functions are used to construct precise
forward and approximate inverse transforms, exploiting the property
that the Sky Jones matrix is approximately unitary. We have applied
this algorithm to VLA 1.4 GHz imaging and show that the instrumental
Stokes-V is eliminated to an accuracy of better than 10%, possibly
limited by uncertainties in our model of the primary beam as well as
pointing errors that were not corrected in this reduction because our
algorithm does not yet handle pointing errors and selfcalibration
simultaneously. Simulations of single pointing observations at
1.4 GHz with the EVLA with typical time-varying antenna pointing
errors show that antenna pointing errors limit the imaging dynamic
range at a level of ![]() 105:1 away from strong sources in a
typical field (imaging dynamic range could be even lower if you are
unlucky, like for the IC2233 case). Using this algorithm on this
simulated data we demonstrate that the effects of antenna pointing
errors can also be corrected during deconvolution. This approach can
therefore be used for full-beam full-Stokes imaging.
105:1 away from strong sources in a
typical field (imaging dynamic range could be even lower if you are
unlucky, like for the IC2233 case). Using this algorithm on this
simulated data we demonstrate that the effects of antenna pointing
errors can also be corrected during deconvolution. This approach can
therefore be used for full-beam full-Stokes imaging.
Finally, we note that in the presence of image plane errors, imaging and calibration algorithms are more tightly coupled compared to those appropriate to direction-independent calibration. Solvers for parameters which describe direction dependent errors require the forward transform used during imaging. Correction for direction dependent effects is done during image deconvolution and one cannot produce corrected visibilities independent of full image deconvolution. With the advent of higher sensitivity arrays where many direction dependent errors will need to be accounted for, modern imaging and calibration software must be designed to easily accommodate these cases.
Acknowledgements
All of this work was done using thepackage. We thank W. Brisken for his help in modeling the VLA antenna aperture function and M. A. Voronkov for his many useful comments. We thank Lynn Matthews for her excellent bandpass calibration of the IC 2233 data. We have benefited from discussions with Bill Cotton, Rick Fisher, Rick Perley and Ken Sowinski.
![\begin{displaymath}
{\ensuremath{\mathsf{J^{\rm Sky}_{\it i}}} (\vec{s})}=
\left...
...nsuremath{\mathsf{J^{\it q}_{\it i}}} }\\
\end{array}\right].
\end{displaymath}](/articles/aa/full/2008/31/aa9284-07/img42.gif)
![$\displaystyle \left[
\begin{array}{cccc}
{\ensuremath{\mathsf{J^{\it p}_{\it i}...
...\ensuremath{\mathsf{J^{\it q^{\textstyle *}}_{\it j}}} }\\
\end{array}\right].$](/articles/aa/full/2008/31/aa9284-07/img48.gif)
![\begin{displaymath}
\vec{V}^{M^\prime}(u_{\it ij},v_{\it ij},w_{\it ij}) = \left...
... }
\vec{I}^M\right]^g\right)(u_{\it ij},v_{\it ij},w_{\it ij})
\end{displaymath}](/articles/aa/full/2008/31/aa9284-07/img83.gif)