 |
Figure 1: The survival of planetesimals in the Jupiter, Saturn, Uranus, Neptune, and Kuiper-belt regions of the PPD after 1 Gyr. The animations of the evolution of this dependence (as well as the dependencies plotted in Figs. 3, 5, 7, 9, and 10) are available at http//www.aanda.org. |
| Open with DEXTER | |
In the text
 |
Figure 2: The evolution of the population of outer OC during the first giga-year. The evolution of the inner-OC as well as whole-OC population is demonstrated, too. |
| Open with DEXTER | |
In the text
 |
Figure 3: The cumulative radial distribution of planetesimals after 100 Myr (dotted curve) and 1 Gyr (solid curve). |
| Open with DEXTER | |
In the text
 |
Figure 4: The evolution of the delivery of comets to the outer Oort cloud, which initially originated in the Jupiter, Saturn, Uranus, Neptune, and Kuiper-belt regions. The contributions from these regions are illustrated by red, green, dark blue, violet, and light blue curve, respectively. |
| Open with DEXTER | |
In the text
 |
Figure 5: The numbers of TPs that moved into the outer OC from the Jupiter, Saturn, Uranus, Neptune, and Kuiper-belt regions. The full bars illustrate the numbers of TPs in 0.5 AU-wide intervals of the initial PPD, which reside in the outer OC at 1 Gyr. The empty bars indicate the TPs that exist, at least for a short period, in the outer OC. |
| Open with DEXTER | |
In the text
 |
Figure 6: The evolution of the cumulative ejection of comets into the interstellar space. |
| Open with DEXTER | |
In the text
 |
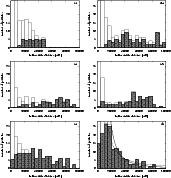
Figure 7: The distribution of the heliocentric distance of the OC comets (cross-hatched bars) for the times 1 (plot a)), 4 b), 16 c), 63 d), 250 e), and 1000 Myr f). The corresponding distributions of all comets, still bound to the Sun, are also shown (empty bars). In the region r < 10 000 AU, these distributions are outside of the chosen scale because of a better transparency of the first group of the distributions. If all comets in the given interval are in the OC, then the cross-hatched bar overlaps the empty bar, which is not visible, in this interval, then. In plot f), our fit of the behaviour in the interval from 25 000 to 100 000 AU, by the power-law with index s = -2.26, is shown with thick-solid curve and the corresponding fit by the power-law with DQT87's index s = -1.5 is shown with the thin-dotted curve. |
| Open with DEXTER | |
In the text
 |
Figure 8: The evolution of the relative distribution of semi-major axis, a, of comets in the region of the Oort cloud beyond 10 000 AU. The curves labelled by 1, 4, 16, 63, 250, and 1000 illustrate the distributions for the corresponding time in Myr. |
| Open with DEXTER | |
In the text
 |
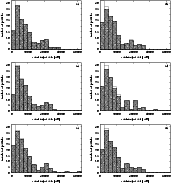
Figure 9: The distribution of the semi-major axis, a, of comets in the Oort cloud (cross-hatched bars). Plots a), b), c), d), e), and f) illustrate the distributions for the times of 900, 920, 940, 960, 980, and 1000 Myr. The corresponding distributions of all comets, still gravitationally-bound to the Sun, are also illustrated (empty bars). If all comets in the given interval are in the OC, then the cross-hatched bar overlaps the empty bar, which is not visible, then. |
| Open with DEXTER | |
In the text
 |
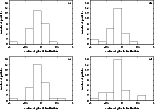
Figure 10:
The distribution of the cosine of inclination, |
| Open with DEXTER | |
In the text