 OH
and HC
OH
and HC N absorption
![[*]](/icons/foot_motif.gif)
OH
and HCN absorptionH. S. Liszt1 - J. Pety2,3 - R. Lucas2
1 - National Radio Astronomy Observatory, 520 Edgemont Road, Charlottesville, VA,
22903-2475, USA
2 - Institut de Radioastronomie Millimétrique, 300 rue de la Piscine, 38406 Saint Martin d'Hères, France
3 - Obs. de Paris, 61 Av. de l'Observatoire, 75014 Paris, France
Received 26 March 2008 / Accepted 10 May 2008
Abstract
Context. An unexpectedly complex polyatomic chemistry exists in diffuse clouds, allowing detection of species such as C2H, C3H2, H2CO, and NH3, which have relative abundances that are strikingly similar to those inferred toward the dark cloud TMC-1.
Aims. We probe the limits of complexity of diffuse cloud polyatomic chemistry.
Methods. We used the IRAM Plateau de Bure Interferometer to search for galactic absorption from low-lying J=2-1 rotational transitions of A- and E-CH3OH near 96.740 GHz and used the VLA to search for the J=8-7 transition of HC5N at 21.3 GHz.
Results. Neither CH3OH nor HC5N were detected at column densities well below those of all polyatomics known in diffuse clouds and somewhat below the levels expected from comparison with TMC-1. The HCN/HC5N ratio is at least 3-10 times higher in diffuse gas than toward TMC-1.
Key words: ISM: molecules - astrochemistry - ISM: clouds
Note to the reader: following the publication of the corrigendum, the title of the article was corrected on 19 October 2016. "CH3" has been replaced by "CH3OH".
As we have shown in a recent series of papers, local diffuse clouds
seen in cm-wave and mm-wave absorption against extragalactic background
sources have an unexpectedly rich and robust polyatomic chemistry
(see Liszt et al. 2006 and references given there). At lower
column densities CO, OH, HCO+, C2H and C3H2 are
detected but when N(HCO+)
 or N(H2)
 ,
CS, HCN, NH3 and H2CO
appear with relative abundances like those inferred toward the
canonical dark cloud TMC-1 (Ohishi et al. 1992).
,
CS, HCN, NH3 and H2CO
appear with relative abundances like those inferred toward the
canonical dark cloud TMC-1 (Ohishi et al. 1992).
Some fairly complex species are seen in these absorption studies, but the real limits of complexity within this chemistry are not known. Most of our work has been at mm-wavelengths while larger astrophysically-important species are generally heavier so that the bulk of their rotational population resides in energy levels which are best observed at lower frequencies.
An exception to this general scenario is methanol (CH3OH),
many of whose lowest rotational transitions (including the
ground-state E-type transition) occur near 96 740 MHz. These lines were
detected in TMC-1 by Friberg et al. (1988) and the relative abundance
of CH3OH with respect to HCO+ in TMC-1 is
N(CH3OH)/N(HCO+)  0.25 (Ohishi et al. 1992).
Although the generally-accepted chemical scheme for producing methanol
in dark gas invokes progressive hydrogenation of H2CO on grains
and might not be expected to be a fertile source of molecules
in lightly-shielded regions, H2CO is widely seen in diffuse clouds
(Liszt et al. 2006; Nash 1990; Liszt & Lucas 1995). Furthermore, the environment is
rich in atomic hydrogen in diffuse gas and models have been proposed
in which molecules are hydrogenated on grains and released into
the ambient diffuse gas where high abundances persist for some time
(Price et al. 2003; Viti et al. 2000). Alternatively, material may be cycled
through a dense phase, with persistently high molecular abundances
for quite some time thereafter in a more diffuse state (Falgarone et al. 2006).
This being the case, at the suggestion of our colleagues, we
undertook to search for CH3OH absorption using the IRAM Plateau de
Bure Interferometer.
0.25 (Ohishi et al. 1992).
Although the generally-accepted chemical scheme for producing methanol
in dark gas invokes progressive hydrogenation of H2CO on grains
and might not be expected to be a fertile source of molecules
in lightly-shielded regions, H2CO is widely seen in diffuse clouds
(Liszt et al. 2006; Nash 1990; Liszt & Lucas 1995). Furthermore, the environment is
rich in atomic hydrogen in diffuse gas and models have been proposed
in which molecules are hydrogenated on grains and released into
the ambient diffuse gas where high abundances persist for some time
(Price et al. 2003; Viti et al. 2000). Alternatively, material may be cycled
through a dense phase, with persistently high molecular abundances
for quite some time thereafter in a more diffuse state (Falgarone et al. 2006).
This being the case, at the suggestion of our colleagues, we
undertook to search for CH3OH absorption using the IRAM Plateau de
Bure Interferometer.
An alternative approach to searching for heavier molecules is simply to follow them to lower frequencies and, subsequent to the CH3OH observations described here, we realized that the cyanopolyynes HC3N and HC5N should be observable with high sensitivity during the VLA-eVLA conversion. Given the similarity in abundance between so many species in TMC-1 and diffuse gas, and the high relative abundances of the cyanopolyynes in TMC-1 (where N(HCN):N(HC3N):N(HC5N) = 20:6:3) it seemed appropriate to search for just those species which are the particular hallmark of the chemistry in TMC-1.
Section 2 of this work describes the observations and some aspects of the spectroscopy of CH3OH. Section 3 describes the cyanopolyyne work and Sect. 4 presents our upper limits on the CH3OH and HC5N abundances and briefly summarizes our absorption line work to date as well as the physical conditions under which the diffuse cloud chemistry operates.
OH observations and data
Table 1: Background sources observed in CH3OH .
The data were acquired at the Plateau de Bure Interferometer in May and July 2006 with 5 or 6 antennas. Table 1 summarizes the observed sightlines, observing dates, approximate quasar fluxes, integration times (the on-source time equivalent to having 6 antennas simultaneously observing), and the empirically-determined rms error in line/continuum ratio in the final, reduced spectra.
Six correlator bands of 20 MHz were concatenated to cover frequencies from 97 600 to 97 800 MHz (or a  150 km s-1 bandwidth) with a channel spacing of 39.06 kHz or 0.121 km s-1 and a channel width of 70 kHz. Two additional correlator bands of 320 MHz were used to measure the 3 mm continuum over the 580 MHz instantaneous IF-bandwidth available with this generation of receivers. The fluxes of the quasar continuum were determined relative to the primary flux calibrator used at Plateau de Bure, i.e. MWC349. The resulting flux accuracy is 15%.
The data were processed inside the GILDAS/CLIC
software (Pety 2005). After a standard RF bandpass calibration, the time-dependent amplitude and phase gains were computed per baseline on the continuum data, assuming a point source. Those gains were then applied to the line data taken simultaneously and spectra were computed as a weighted temporal average of the visibility amplitudes.
Table 2: CH3OH spectroscopy and column density.
Rest frequencies for the CH3OH transitions (Table 2) were taken from the NIST list of recommended rest frequencies, found online at http://physics.nist.gov/cgi-bin/micro/table5/start.pl. Although the spectroscopic constants have changed slightly, helpful energy level diagrams and related information for CH3OH are given by Lees (1973); Nagai et al. (1979) and Friberg et al. (1988); Lees (1973) tabulates line strengths and spontaneous emission coefficients. As noted in Table 2, we observed several J=2 K-1 Ktransitions of A- and E-type CH3OH around 96 740 MHz. For E-CH3OH the J=0level of the K=-1 ladder is absent owing to symmetry concerns and the J=2-1 - 1-1 transition is actually the ground-state E-CH3OH line. The fourth column of Table 2 gives the fraction of all A- or E-CH3OH which resides in the 1K level of the various transitions when the rotational populations are in equilibrium with the 2.73 K cosmic microwave background. The total column density of CH3OH is the sum of all A- and E-CH3OH.
According to Lees (1973), the transitions observed are all of a-type,
with dipole moment of 0.885 D, leading to the spontaneous emission rates
A21 shown in Table 2. From standard formulae, given the
assumed excitation and level populations, we may write for either the X=Aor X=E configurations N(X-CH3OH) =
 , where the observed optical depth integral over any of the J=2 K-1K lines is expressed in km s-1 and values of
  are given in
the last column of Table 2.
are given in
the last column of Table 2.
Table 3: Background sources observed in HC5N J=8-7.
![\begin{figure}
\par\includegraphics[width=14cm,clip]{09851F1.eps}\end{figure}](/articles/aa/full/2008/29/aa09851-08/img29.gif) |
Figure 1:
Excitation of cyanopolyynes by electrons in diffuse gas. Shown are the integrated optical depths for
 transitions as a function of H2-number density when X(e) = n(e)/n(H2)
 .
At left are shown results for N(HC3N) = .
At left are shown results for N(HC3N) =
 and at right for N(HC5N) =
 .
For each transition, calculations at TK = 20, 40, and 60 K are shown but only for lower-J transitions are they clearly separated. In each case the curve for the highest TK-value lies lowest. The transitions observed in this work are shown as dashed (red) lines. .
For each transition, calculations at TK = 20, 40, and 60 K are shown but only for lower-J transitions are they clearly separated. In each case the curve for the highest TK-value lies lowest. The transitions observed in this work are shown as dashed (red) lines. |
| Open with DEXTER | |
We observed the J=5-4 HC3N and J=8-7 HC5N transitions at 45.4 and 21.3 GHz at the VLA on 2007 December 16-17 using a correlator setup with 128 channels of width 24.4 kHz and 12.2 kHz, respectively (0.161 km s-1 and 0.172 km s-1). We bandpass calibrated and then observed the background sources fixedly without the need for other phase calibrators, given the strong emission and point-like nature of the sources (all of which are calibrators for other experiments). We used reference pointing on all sources. After applying the bandpass calibration, we used the AIPS task UVLSD which forms and averages line/continuum spectra during individual correlator integration intervals. The final spectra were then formed with vector averaging in the POSSM task and exported for reduction and analysis. The fluxes of the background sources were not needed to form the absorption spectra and were not separately determined.
Although unforseen, it has not been possible to correlate baselines with both VLA and eVLA antennas at the narrow IF bandwidths used in this work. Given the makeup of the VLA during our observations, it was necessary to discard nearly half of the the baselines. Additionally, the Q-band HC3N observations were corrupted by an unexplained IF instability or other problem which made passband calibration problematic and rendered the noise levels several times higher than expected. Although some portions of some passbands appeared to be usable for some sources, we do not trust these results and we will not discuss them further. Results for the HC5N transition toward four sources (those observed in CH3OH as well as B0212+735) are summarized in Table 3.
Given the relatively large mass and high dipole moments of the
cyanopolyynes, 3.6 and 4.33 Debye for HC3N and HC5N,
respectively, maximizing the sensitivity of the detection
experiment required consideration of the populations of
the rotational ladder. Although the density of neutral
particles is too low to produce significant departures from
rotational equilibrium with the cosmic background (see Sect. 4.3),
excitation by electrons is non-negligible. Figure 1 shows the
integrated optical depths expected for various rotational transitions
as a function of the assumed temperature and density of
molecular hydrogen, under the assumption that n(e)/n(H2)
representing a fully ionized component of moderately-depleted carbon, n(C)
 ,
along with a smaller contribution by H+. We solved the rate equations determining
the level populations for a total column density
of absorbers, including collisional excitation by electrons using the rate constants of Dickinson & Flower (1981).
,
along with a smaller contribution by H+. We solved the rate equations determining
the level populations for a total column density
of absorbers, including collisional excitation by electrons using the rate constants of Dickinson & Flower (1981).
Technical details aside,
the transitions having the greatest integrated optical depth
are those which most sensitively probe the actual molecular abundance.
The J=5-4 HC3N and J=8-7 HC5N transitions are the first or
second-most sensitive transitions over the range of density indicated.
The calculated optical depth of the J=8-7 HC5N transition is
insensitive to temperature but declines slightly with increasing
density. Given the behaviour shown in Fig. 1, it is conservative
to assert that
 km s-1 N(HC5N) and
the upper limits on the J=8-7 line profile optical depth integrals
given in Table 3 have been converted to HC5N column
density in Table 4 using this value.
km s-1 N(HC5N) and
the upper limits on the J=8-7 line profile optical depth integrals
given in Table 3 have been converted to HC5N column
density in Table 4 using this value.
The bottom row of Table 4 gives limits on the total CH3OH
column density toward B0415+479 (3C 111) and B2200+420 (BL Lac) and for the
-10.5 km s-1 component toward B0355+508 (NRAO150), which has the highest
column densities and is chemically the most complex feature along that
sightline (Liszt et al. 2006). These are 2 statistical upper limits
at the empirically-determined channel-to-channel rms levels tabulated in
Table 1, over the expected velocity span determined by our deep
HCO+ profiles for each line. The features toward 3C111 and BL Lac have
blended velocity substructure, but this distinction is ignored here.
Spectra of the various species in the directions discussed are given in the
references cited in Table 4.
statistical upper limits
at the empirically-determined channel-to-channel rms levels tabulated in
Table 1, over the expected velocity span determined by our deep
HCO+ profiles for each line. The features toward 3C111 and BL Lac have
blended velocity substructure, but this distinction is ignored here.
Spectra of the various species in the directions discussed are given in the
references cited in Table 4.
Table 4 also compares these limits on the CH3OH column density with values for the column densities of a variety of molecules previously observed toward the various features in our earlier work. To compare with dark cloud values, the right-most column of Table 4 gives the abundances of the various species seen in TMC-1.
Our upper limits on the CH3OH column density are in all cases quite low compared to those of the other species shown in Table 4, and are generally at or modestly below the abundance ratios seen in TMC-1, especially toward 3C111. For instance N(CH3OH)/CS < 0.2, 0.1, and 0.13 for BL Lac, NRAO150, and 3C111, respectively, compared with a value 0.2 toward TMC-1.
As noted in Sect. 3, the upper limits on the line profile integral of HC5N absorption in Table 3 were converted to column density for inclusion in Table 4 using N(HC5N)
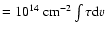 ,
following the excitation calculations shown in Fig. 1. The HCN/HC5N ratio, approximately 7 in TMC-1, is at least 3-10 times higher than this toward B2200 and B0415+379.
,
following the excitation calculations shown in Fig. 1. The HCN/HC5N ratio, approximately 7 in TMC-1, is at least 3-10 times higher than this toward B2200 and B0415+379.
Table 4: Column densities and relative abundances.
Table 4 serves as a summary of our absorption line chemistry work to date, for sightlines and clouds with somewhat higher column density N(HCO+)
 which have the richest chemistry. These patterns are not universal: the abundances of CO and all other detected species listed beneath C3H2 in the table increase dramatically with respect to HCO+ for N(HCO+)
 ,
as shown for instance in Fig. 3 of Liszt & Lucas (2001). CO, which is found in nearly all features identified in HCO+, even at N(HCO+) < 1012, is a special case, varying widely due to the influence of photodissocation and self-shielding (Liszt 2007). It can however be understood as the electron recombination product of HCO+ when N(HCO+)/N(H2)
,
as shown for instance in Fig. 3 of Liszt & Lucas (2001). CO, which is found in nearly all features identified in HCO+, even at N(HCO+) < 1012, is a special case, varying widely due to the influence of photodissocation and self-shielding (Liszt 2007). It can however be understood as the electron recombination product of HCO+ when N(HCO+)/N(H2)
 ,
as observed (ibid).
,
as observed (ibid).
Despite the overall similarity in relative abundances of many
species with the TMC-1 patterns, some differences with TMC-1 are
also apparent, even beyond the absence of CH3OH and HC5N.
In particular, the low HNC/HCN ratio in diffuse clouds
is characteristic of warmer gas, consistent with the observed
HOC+/HCO+ ratio (Liszt et al. 2004; Liszt & Lucas 2001). The HCN/HNC and
HOC+/HCO+ ratios are important clues to the diffuse nature
of the host gas. Previous indications that diffuse gas was being observed were
the low reddening (0.32 mag) known to exist toward B2200+420 (BL Lac), the weakness of mm-wave emission from species other than CO - only HCO+ is detected (Liszt & Lucas 1994; Lucas & Liszt 1996) -
and finding that N(OH) and N(CO) were comparable to the column densities observed in uv absorption toward  Oph and some other bright stars.
The general properties of diffuse gas are summarized by Snow & McCall (2006).
In the context of our work, the kinetic temperature and the
density and thermal partial pressure of H2 are indicated in various ways by the chemistry,
fractionation and rotational excitation of CO (Liszt 2007; Liszt & Lucas 1998), and are typical of the diffuse ISM. The partial thermal pressures n(H2)
 -
-
 K are comparable to those derived for the bulk of the gas from C I fine-structure
excitation seen in uv absorption (Jenkins & Tripp 2001). N(12CO)/N(13CO) ratios may be as low as 15-20 in clouds with N(CO)
K are comparable to those derived for the bulk of the gas from C I fine-structure
excitation seen in uv absorption (Jenkins & Tripp 2001). N(12CO)/N(13CO) ratios may be as low as 15-20 in clouds with N(CO)
 ,
from which it may be inferred
that the kinetic temperature of lines of sight like those
summarized in Table 4 is 25-50 K, somewhatbelow the mean
kinetic temperature inferred from obsevation of H2 itself
(70-80 K, see Rachford et al. 2002) but consistent with formation
and rotational excitation of CO at n(H2)
,
from which it may be inferred
that the kinetic temperature of lines of sight like those
summarized in Table 4 is 25-50 K, somewhatbelow the mean
kinetic temperature inferred from obsevation of H2 itself
(70-80 K, see Rachford et al. 2002) but consistent with formation
and rotational excitation of CO at n(H2)
 .
The very weak mm-wave emission of optically-thick HCO+
is consistent with such n(H2) if
n(e)/n(H2)
.
The very weak mm-wave emission of optically-thick HCO+
is consistent with such n(H2) if
n(e)/n(H2)
 as expectedfor diffuse
gas in which only a small fraction (
as expectedfor diffuse
gas in which only a small fraction ( 1-5%) of the free
gas-phase carbon resides in CO and the rest is in the form
of C+.
1-5%) of the free
gas-phase carbon resides in CO and the rest is in the form
of C+.
Despite the consistency of these arguments, it is the case that no quiescent ion-molecule chemistry will reproduce the observed abundances at such low n(H2). Some recent models of the diffuse cloud chemistry regard these conditions as a general background against which transient processes may operate (Smith et al. 2004; Falgarone et al. 2006), affecting the observed chemical abundance patterns without necessarily imprinting themselves observably on the internal degrees of freedom in the molecules themselves.
Acknowledgements
IRAM is supported by INSU/CNRS (France), MPG (Germany), and IGN (Spain). The National Radio Astronomy Observatory is operated by AUI, Inc. under a cooperative agreement with the US National Science Foundation. We owe the staff at IRAM (Grenoble) and the Plateau de Bure our thanks for their assistance in taking the data. We thank the scientific staff at the VLA, especially Mark Claussen, for assistance in dealing with data-handling issues during the VLA/eVLA transition. The referee provided a gentle but perceptive report which resulted in great improvement of the text. We thank Maryvonne Gerin for encouraging us to search for CH3OH.