 |
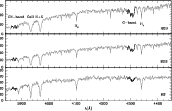
Figure 1: Typical spectrum of a RGB ( top panel), a SGB ( middle panel), and a MS ( bottom panel) star in the globular cluster NGC 288. The regions of the measured indices are marked by darker lines. Furthermore the positions of the prominent CaII H and K and Hydrogen lines are indicated in the top panel. |
| Open with DEXTER | |
In the text
![\begin{figure}
\par\hspace*{3mm}
\begin{tabular}[]{c c c}
\hspace*{-0.6cm}\psfig...
...rx=195mm,bbury=246mm}\hspace*{3cm}
\vspace*{0.9cm}\\
\end{tabular}
\end{figure}](/articles/aa/full/2008/29/aa09446-08/Timg32.gif) |
Figure 2:
The color magnitude diagrams for the globular clusters
in our sample. Those stars for which line strength measurements are available
are marked in color. We distinguish between stars of different evolutionary
states. MS stars are indicated by blue squares, SGB stars by green triangles,
and RGB stars by red circles. CN-weak and CN-strong stars are denoted by open
and filled symbols, respectively. Note that in all diagrams the calibrated
pre-image B and V magnitudes are shown. Our sample comprises clusters
spanning a wide range in metallicity (
|
| Open with DEXTER | |
In the text
 |
Figure 3: The distribution of the stars of the different clusters in the CN vs. MV diagram. The left upper panel illustrates the overall distribution of our sample stars. In the lower panel we distinguished between different evolutionary states of the stars. The color coding of the data points corresponds to stars from the different clusters as indicated in the figure legend in the upper right. Whereas for the MS all clusters show roughly the same distribution, for the RGB the distribution shows a large scatter. For the clusters NGC 288 and NGC 362, a bimodal distribution in CN band strength is visible. In the lower left corner of the bottom panels the median errors of the measurements are shown. |
| Open with DEXTER | |
In the text
| |
Figure 4: The distribution of the stars in the CN vs. CH diagram for the RGB star in our sample clusters. The stars of different clusters are indicated by different colors as listed in Fig. 3. The left panel illustrates the overall distribution of our sample stars, with a typical error given in the lower right corner. The solid line indicated a possible differentiation between CN-strong and CN-weak stars in this diagram, drawn by eye. In right panel we calculated the mean CN and CH of both the CN-strong and CN-weak stars. The original overall distribution is plotted in gray, while the mean values are color-coded as defined before. |
| Open with DEXTER | |
In the text
| |
Figure 5:
Left: the MV vs. CN diagram for the RGB (red), SGB
(green), and MS (blue) stars for the cluster NGC 288. The bimodal distribution
is clearly visible. The dashed line illustrates the lower envelope fitted to
this distribution. Right: plotted is MV vs. the CN excess parameter
|
| Open with DEXTER | |
In the text
![\begin{figure}
\par\hspace*{1.5cm}\scalebox{1}[1]{\includegraphics*[viewport=30 45 499 547]{9446fig13.ps}}
\end{figure}](/articles/aa/full/2008/29/aa09446-08/Timg53.gif) |
Figure 6:
Distributions of CN-band strength in the RGB stars
of our sample clusters. The histograms of the CN-excess parameter
|
| Open with DEXTER | |
In the text
 |
Figure 7:
Combined histograms of the CN-excess parameter for
the clusters in our sample. The gray histogram comprises all eight clusters.
In the black histogram Pal 12 and Ter 7, which are believed to belong to the
Sgr dSph, are not included. Here we only consider stars on the lower RGB.
|
| Open with DEXTER | |
In the text
| |
Figure 8:
The combined distributions of the CN excess
parameters measured for stars on the SGB and MS. The gray histogram
comprises all eight clusters. In the black histogram Pal 12 and Ter 7 are
not included. The solid lines indicate the median values of the distributions.
The dashed lines indicate the selection limits for CN-strong and CN-weak
stars. Stars with
|
| Open with DEXTER | |
In the text
![\begin{figure}
\par\hspace*{2mm}
\begin{tabular}[]{c c}
\psfig{figure=9446fig16....
...t=18cm,bbllx=110mm,bblly=60mm,bburx=550mm,bbury=246mm}\end{tabular}
\end{figure}](/articles/aa/full/2008/29/aa09446-08/Timg76.gif) |
Figure 9:
The CN vs. MV and CH vs. MV diagrams for the eight
clusters in our sample. We differentiate between RGB, SGB, and MS stars for
all clusters. The CN-strong and CN-weak stars are marked by filled and open
symbols, respectively. SGB and MS stars with intermediate
|
| Open with DEXTER | |
In the text
 |
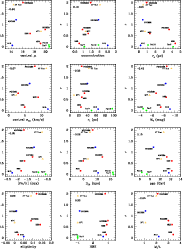
Figure 10: The number ratio of CN-strong to CN-weak stars (r-parameter) vs. various cluster parameters (see Table 4). Our targets are indicated by the filled circles. The two results taken from the literature are marked by open triangles. Red, blue, yellow, and green colors indicate OH, YH, BD, and Sgr GCs, respectively. In the upper left corner the calculated Spearman rank correlation coefficient is given. |
| Open with DEXTER | |
In the text
 |
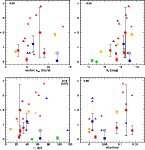
Figure 11:
Plot of the r-parameter vs. those globular cluster
parameters that showed a promising correlation in Fig. 10 or in previous studies by e.g., Smith (2002), such as
ellipticity, central velocity dispersion (
|
| Open with DEXTER | |
In the text