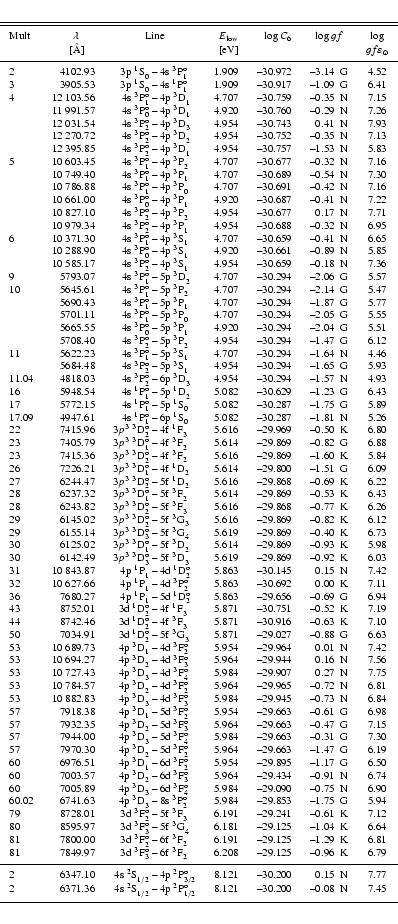
Table 1:
Atomic data for spectral lines of Si I and Si II (last two entries). References to the gf-values are G: Garz (1973, experimental), K: Kurucz & Peytremann
(1975), and N: NIST (http://www.physics.nist.gov/). Values for
refer to our final atomic model, with
= 0.1.