A&A 484, 555-561 (2008)
DOI: 10.1051/0004-6361:20079170
Observations of CO on Saturn and Uranus at millimeter wavelengths: new upper limit determinations
T. Cavalié1 -
F. Billebaud1 -
T. Fouchet2 -
E. Lellouch2 -
J. Brillet1 -
M. Dobrijevic1
1 - Université Bordeaux I, CNRS, Observatoire Aquitain des Sciences de l'Univers,
Laboratoire d'Astrophysique de Bordeaux,
2 rue de l'Observatoire, BP 89, 33270 Floirac, France
2 -
Observatoire de Paris-Meudon, Laboratoire d'Études Spatiales et d'Instrumentation en Astrophysique, France
Received 30 November 2007 / Accepted 1 March 2008
Abstract
Aims. We observed Saturn and Uranus at CO millimetric line wavelengths in order to better constrain the origin of CO in the atmospheres of these planets. CO sources can be either of internal or of external origin.
Methods. We recorded broad multi-band spectra of Saturn and Uranus at the frequencies of the J = 1
 0 and J = 2
1 CO lines.
0 and J = 2
1 CO lines.
Results. As we do not detect any CO line in the spectra, we derive new upper limits of the abundance of CO in the atmospheres of Saturn and Uranus. The value we obtain for Saturn (6.3  10-8, restricted to the stratosphere) is larger than the value of the CO mixing ratio in the external origin model used. New observations with higher sensitivity and/or longer observing time should enable us to determine the CO external source strength. The upper limit we derive on Uranus is slightly lower (2.7
10-8, restricted to the stratosphere) than the value derived from an early observation of CO on Uranus, at infrared wavelength. As the fluorescence model used then did not take scattering effects into account, we suggest that the value could be overestimated.
10-8, restricted to the stratosphere) is larger than the value of the CO mixing ratio in the external origin model used. New observations with higher sensitivity and/or longer observing time should enable us to determine the CO external source strength. The upper limit we derive on Uranus is slightly lower (2.7
10-8, restricted to the stratosphere) than the value derived from an early observation of CO on Uranus, at infrared wavelength. As the fluorescence model used then did not take scattering effects into account, we suggest that the value could be overestimated.
Key words: planets and satellites: individual: Saturn, Uranus - radio lines: solar system
Water and carbon dioxide have been detected in
the stratospheres of the four giant planets and Titan
(Feuchtgruber et al. 1997; Burgdorf et al. 2006; Coustenis et al. 1998; Feuchtgruber et al. 1999).
The presence of these condensable species above the
tropopause cold trap (except CO2, which does not condense on Jupiter and Saturn) implies the presence of an external supply of
oxygen. Different possible sources have been proposed: infall of
interplanetary dust particles (IDPs), sputtering from the planetary
rings and icy satellites, or massive impacts of kilometer-sized comets
or asteroids (Moses et al. 2000).
Different techniques can be used to discriminate between these various sources.
First, the spatial distribution (altitude and latitude)
of oxygenated compounds can trace localized inputs. Lellouch et al. (2002) showed that the
water in Jupiter is restricted to pressure levels higher than the
0.5-mbar level and that CO2 is enhanced in the southern hemisphere:
both species must then originate from localized, recent events: the Shoemaker
Levy 9 (SL9) impacts. A recent analysis of submillimeter spectra of Odin and SWAS
(Submillimeter Wave Astronomy Satellite) space telescopes seems to confirm
the cometary origin of the stratospheric water on Jupiter (Cavalié et al. 2008). A second possibility is to determine which chemical species, water or a species with a C-O bond (CO, CO2,
...), is the main oxygen carrier to the stratospheres of the giant
planets. From observations in the millimetric range or at 5- m,
Bézard et al. (2002) and Lellouch et al. (2002,2005) have
measured the CO abundance in the stratospheres of Jupiter and Neptune,
and demonstrated that the ratios of the CO to the H2O deposition
rates are larger than 30 and can be as large as 200. These large
CO/H2O ratios strongly favor large impacts as the main source
of oxygen in the stratospheres of Jupiter and Neptune, as shown by SL9
(Moses 1996; Moses et al. 2000; Lellouch 1996).
m,
Bézard et al. (2002) and Lellouch et al. (2002,2005) have
measured the CO abundance in the stratospheres of Jupiter and Neptune,
and demonstrated that the ratios of the CO to the H2O deposition
rates are larger than 30 and can be as large as 200. These large
CO/H2O ratios strongly favor large impacts as the main source
of oxygen in the stratospheres of Jupiter and Neptune, as shown by SL9
(Moses 1996; Moses et al. 2000; Lellouch 1996).
In between, the situation of Saturn and Uranus is still unclear,
because the CO mixing ratio in the stratospheres of these planets is
still unknown or uncertain, and also since the CO origin cannot
definitely be attributed to an external flux. Indeed, an internal
source of CO also exists in giant planets in the form of
convective transport from the deep warm atmosphere where the
equilibrium CO abundance is higher than in the shallow
atmosphere. This internal source is observed on Jupiter and Neptune
(Lellouch et al. 2005; Bézard et al. 2002). Its
measurement could be very useful to constrain the O/H ratio and the
convective activity in the giant planet deep interiors (Bézard et al. 2002).
On Saturn, CO has been detected from 5-m spectroscopy at a level
of 1 ppb (if uniformly mixed) by Noll & Larson (1991) but the authors
were not able to independently measure the stratospheric and
tropospheric mixing ratios. Therefore it is not possible to reliably
estimate the relative contributions of the external and internal
flux. Later, Rosenqvist et al. (1992) could only derive an upper limit of
1
10-7 from their observations at millimeter wavelengths.
On Uranus, CO has been detected at 5-m
(Encrenaz et al. 2004) from fluorescent emission. These authors derived a
stratospheric mixing ratio of 3
10-8 but within an
uncertainty of a factor of two. In the troposphere, they derived an upper
limit of 2
10-8. The latter improved the previous upper limits
from Marten et al. (1993) and Encrenaz et al. (1996), which
were  3
10-8 and 5
10-7 respectively.
The large error bars in Encrenaz et al. (2004) did not allow the authors
to distinguish the external from the internal flux. For Uranus again,
the CO/H2O deposition rate ratio could not be measured, and the
origin of the external oxygen remains unconstrained. We present new
observations to help constrain the abundance of CO in the atmospheres of Saturn
and Uranus.
3
10-8 and 5
10-7 respectively.
The large error bars in Encrenaz et al. (2004) did not allow the authors
to distinguish the external from the internal flux. For Uranus again,
the CO/H2O deposition rate ratio could not be measured, and the
origin of the external oxygen remains unconstrained. We present new
observations to help constrain the abundance of CO in the atmospheres of Saturn
and Uranus.
Our observations are described in Sect. 2. The radiative transfer
model is presented in Sect. 3 and we show our results in Sect. 4.
Discussion and conclusions are given in Sect. 5.
2 Observations
We observed Saturn and Uranus on 16-18 September 2006 with the Institut de RadioAstronomie Millimétrique (IRAM) 30-m telescope, at Pico Veleta, Spain.
The angular sizes of the planets were 16.6 arcsec for Saturn and 3.7 arcsec for Uranus. The Sub-Earth Point latitudes were respectively -14.3 and -5.25
for Saturn and Uranus.
and -5.25
for Saturn and Uranus.
We simultaneously used two receivers (A and B) which share two backends at 1 and 3-mm wavelength in order to observe the CO J = 1
0 and
J = 2
1 lines at 115.271 GHz and 230.538 GHz.
Each receiver covers a bandwidth of 512 MHz at 115 GHz and 1024 MHz at 230 GHz. Both receiver spectral resolutions were set at 1 MHz. The receivers
were operated in a single side band mode. The side band rejection was 0.001 at 115 GHz and 0.01 at 230 GHz. The wobbler switching technique was used and the wobbler
frequency was set to 0.5 Hz. System temperatures ranged from 320 K to 430 K during the first night (from 380 K to 500 K during the second night) on the 1-mm band and from
250 K to 420 K during the first night (from 260 K to 400 K during the second night) on the 3-mm band. The zenithal atmospheric opacity value was about 0.15-0.20 at 115 GHz
and 0.25-0.30 at 230 GHz. A large absorption feature appears at 231.280 GHz on Uranus and Saturn spectra (see Figs. 1 and 2).
This line is the terrestrial ozone line.
On Saturn and Uranus, the expected CO tropospheric/low stratospheric
absorptions are broad; they cover several GHz in frequency.
This is the reason why we adopted the observation technique that is described in Lellouch et al. (2005) to observe these lines. This technique consists of using both receivers A and B in parallel in order to cover the widest band
available: by taking an overlap of 1/4 of the bands (128 MHz at 115 GHz and 256 MHz at 230 GHz), it is possible to cover 896 MHz and 1792 MHz for
one single tuning at the CO(1-0) and CO(2-1) frequencies. For Saturn and Uranus, we covered 1280 MHz at 115 GHz and 4096 MHz at 230 GHz
(see Figs. 1 and 2). All the tunings were observed from 1/2 h to 1 h in a cyclic scheme.
![\begin{figure}
\par (a)\includegraphics[height=5.7cm,width=7.8cm,clip]{9170fig1.eps} (b)\includegraphics[height=5.7cm,width=7.9cm,clip]{9170fig2.eps} \end{figure}](/articles/aa/full/2008/23/aa9170-07/Timg13.gif) |
Figure 1:
Spectra of Saturn at a) 115 GHz and b) 230 GHz in the antenna temperature scale. Receiver A has a corrupt channel. It can be seen in the middle of the first three lowest frequency bands at 230 GHz. This channel is removed before reducing
the spectra. The terrestrial ozone absorption band can be seen at 231.280 GHz. This feature is not taken into account when computing the spectrum noise level. |
| Open with DEXTER |
At 115 GHz, 3 contiguous spectra were obtained, while we observed 5 spectral bands around 230 GHz. The intense terrestrial O2 atmospheric absorption
around 118.750 GHz prevents ground-based observations rightwards of 115.5 GHz. This is the reason why we only have 3 bands at 115 GHz, respectively
centered around 115.271 GHz, 114.887 GHz and 114.503 GHz. The 115 GHz spectrum was not probed over 115.5 GHz.
Once all the observations were carried out, the individual spectra were connected.
As two contiguous spectra generally did not have the same continuum level, we averaged the spectra in their overlap part and rescaled them one to
another. So, all the spectra have been rescaled according to the continuum of the first spectrum of each band. The final spectrum frequency ranges
are 114.263-115.511 GHz and 228.504-232.568 GHz. Finally, the spectra were reduced as for classical spectra. After removing a polynomial baseline of maximum degree 3,
we removed the ripples with the greatest amplitude with a FFT procedure. The ripple frequencies that were removed were the ones present on
each spectrum (at 115 GHz and 230 GHz, for Saturn and Uranus). As we performed no absolute calibration, the lines were interpreted in terms
of line to continuum ratios. All the lines were smoothed to a 16 MHz spectral resolution in order to reduce the noise level. The 3- levels we obtain, depending on the continuum
value, are shonw in Table 1. The best 3- level we obtain are for the CO(2-1) line at 230 GHz either on Saturn or Uranus, after
converting the antenna temperature noise level intensity of each spectrum into a brightness temperature noise level intensity.
levels we obtain, depending on the continuum
value, are shonw in Table 1. The best 3- level we obtain are for the CO(2-1) line at 230 GHz either on Saturn or Uranus, after
converting the antenna temperature noise level intensity of each spectrum into a brightness temperature noise level intensity.
3 Radiative transfer
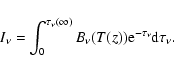
We modeled the observed millimetric radiation with a line-by-line non-scattering radiative transfer model. We computed synthetic spectra in the wavelength ranges of the CO(1-0) and (2-1) lines. The program respects the approximate spherical geometry of the planets (except the rings on Saturn) so that planetary disk and limb contributions were taken into account. We assumed a uniform distribution of all opacity sources and, for simplicity, we adopted mean thermal profiles for both planets since our beam size is comparable to or larger than the planetary disks. Thus, the total opacity on a line of sight only depends on the total thickness of the atmosphere on this line of sight. Therefore, we have a symmetry, in terms of opacity sources and temperature distributions, around the central point of the disk. This is why we only computed synthetic spectra for a given number of points located on the planetary disk radius. Assuming local thermal equilibrium, the specific intensity 
![$\rm\left[W~m^{-2}~sr^{-1}~Hz^{-1}\right]$](/articles/aa/full/2008/23/aa9170-07/img16.gif) along a given line
of sight is:
along a given line
of sight is:
 |
(1) |
The parameter
 is the optical depth,
 is the Planck function and
T(z) is the atmospheric vertical thermal profile. The thermal profiles we used come, from
Ollivier et al. (2000) for Saturn and from Lindal (1992) for the troposphere and Orton et al. (1987) for the stratosphere for Uranus (see Fig. 3). Continuum opacity is dominated by H2-He-CH4 collision-induced
absorption (Borysow et al. 1985,1988; Borysow & Frommhold 1986). Following Moreno (1998), the opacity due to the far wings of ammonia and phosphine lines is also included (only NH3 in the case of Uranus). We used the Davis et al. (1996) ammonia and Fletcher et al. (2007) phosphine mixing ratio vertical profiles for Saturn. The mixing ratio profile of ammonia on Uranus
is in agreement with Hofstadter & Muhleman (1989) measurements (
is the Planck function and
T(z) is the atmospheric vertical thermal profile. The thermal profiles we used come, from
Ollivier et al. (2000) for Saturn and from Lindal (1992) for the troposphere and Orton et al. (1987) for the stratosphere for Uranus (see Fig. 3). Continuum opacity is dominated by H2-He-CH4 collision-induced
absorption (Borysow et al. 1985,1988; Borysow & Frommhold 1986). Following Moreno (1998), the opacity due to the far wings of ammonia and phosphine lines is also included (only NH3 in the case of Uranus). We used the Davis et al. (1996) ammonia and Fletcher et al. (2007) phosphine mixing ratio vertical profiles for Saturn. The mixing ratio profile of ammonia on Uranus
is in agreement with Hofstadter & Muhleman (1989) measurements (
 10-7 below the condensation level).
Table 1:
Continuum and 3-
noise level in the antenna temperature scale on the CO(1-0) and CO(2-1) spectral bands.
We tested the CO mixing ratio vertical profiles inferred by Noll & Larson (1991) for the atmosphere of Saturn. The first one is based on an internal source of CO (1 ppb, constant with altitude), while the other is the signature of an external supply of CO
(2.5
10-8 in the stratosphere and 10-10 in the troposphere). For Uranus, the CO lines were computed from the Encrenaz et al. (2004) models. The authors tentatively favored an external origin for CO (3
10-8 above the 100 mbar level) and set an upper limit on the magnitude of a tropospheric source (vertical profile with 2
10-8 constant with altitude). Our 3-
mixing ratio values are discussed in Sect. 4. All these profiles are shown in Figs. 4 and 5.
Spectroscopic parameters for NH3, PH3 and CO were taken from Pickett et al. (1998). The line widths are determined by the collisional line widths for H2 and He broadening. The broadening  and temperature dependence exponent n values we took for NH3, PH3 and CO are summarized in Table 2. All lines, except the NH3 ones, are assumed to be Voigt-shaped. Following Moreno (1998), we take a modified Van Vleck and Weisskopf line profile for ammonia.
![\begin{figure}
\par\includegraphics[height=6.9cm,width=8cm,clip]{9170fig6.ps} \end{figure}](/articles/aa/full/2008/23/aa9170-07/Timg23.gif) |
Figure 4:
Ammonia, phosphine and carbon monoxide mixing ratio vertical profiles on Saturn, all in solid lines. The internal and external source of CO models come from Noll & Larson (1991) (N&L'91 on the plot). The upper limits we have derived for the internal source (dotted lines) and for the external source (dashed lines) are also displayed. |
| Open with DEXTER |
![\begin{figure}
\par\includegraphics[height=6.9cm,width=8cm,clip]{9170fig7.ps} \end{figure}](/articles/aa/full/2008/23/aa9170-07/Timg24.gif) |
Figure 5:
Ammonia and carbon monoxide mixing ratio vertical profiles on Uranus, all in solid lines. Both CO internal (upper limit) and external (best fit model) origin profiles come from Encrenaz et al. (2004) (E'04 on the plot). Our upper limits are plotted in dotted lines for the internal source and in dashed lines for the external source. |
| Open with DEXTER |
Table 2:
Collisional line width
![$\rm [cm^{-1}~atm^{-1}]$](/articles/aa/full/2008/23/aa9170-07/img25.gif) (at 300 K) and temperature dependence factor n for NH3, PH3 and CO with H2 and He and for Saturn and Uranus (a blank space means that no data is available).
(at 300 K) and temperature dependence factor n for NH3, PH3 and CO with H2 and He and for Saturn and Uranus (a blank space means that no data is available).
We performed our analysis in terms of line to continuum ratios. We compared our continuum model to previously published observations. On Saturn, the continuum disk brightness temperature of our model is 141.6 K at 115 GHz and 140.0 K at 230 GHz. These numbers are consistent
with Klein et al. (1978) (140  15 K at 115 GHz and 135
11 K at 230 GHz). The good match of our continuum model to observations is confirmed with the Ulich (1981) data. The author reports a disk brightness temperature of 150
7 K at 86 GHz
and 164
12 K at 142 GHz. As noted by the author, the observations at 142 GHz were carried out with a high inclination of the rings, increasing the apparent brightness temperature of the disk. With our model, we obtain 141.2 K at 86 GHz and 141.6 K at 142 GHz. At 310 GHz,
our model gives 137.7 K, in agreement with Hildebrand et al. (1985). The disk brightness temperature we model for Uranus is 94.8 K at 200 GHz and 91.5 K at 230 GHz, consistent with Encrenaz et al. (1996) (
15 K at 115 GHz and 135
11 K at 230 GHz). The good match of our continuum model to observations is confirmed with the Ulich (1981) data. The author reports a disk brightness temperature of 150
7 K at 86 GHz
and 164
12 K at 142 GHz. As noted by the author, the observations at 142 GHz were carried out with a high inclination of the rings, increasing the apparent brightness temperature of the disk. With our model, we obtain 141.2 K at 86 GHz and 141.6 K at 142 GHz. At 310 GHz,
our model gives 137.7 K, in agreement with Hildebrand et al. (1985). The disk brightness temperature we model for Uranus is 94.8 K at 200 GHz and 91.5 K at 230 GHz, consistent with Encrenaz et al. (1996) (
 K at 200 GHz) and Orton et al. (1986) (
 3.0 K at 230 GHz).
Giant planets have rapid rotation periods. This induces a smearing of the lines which is linked to the rotation period and radius of the planets (see Table 3). Indeed, the radiation emitted along a line of sight are Doppler shifted because of the projected velocity of the rotating gas. The smearing effect is maximum when the Sub-Earth Point latitude is close to 0.
To take this into account, the planetary disk was partitioned into a regular square grid. On each point of the grid, a synthetic spectrum is calculated by interpolating the spectra that were computed on a planetary disk radius. The spectra of the grid are then shifted in frequency, according to their location, and averaged with appropriate weights by taking the antenna pattern (2D Gaussian function) into account (Lellouch et al. 2002; Bergin et al. 2000). Although the CO lines are formed in the lower stratosphere, the lines appear to be in absorption, because the temperature where the line is formed is lower than the tropospheric continuum temperature. According to our model, we do not expect any observable stratospheric emission peak in the line core at 115 GHz and
230 GHz, unlike lines at higher frequencies (Cavalié et al. 2007). Because the lines are formed at high pressure levels, the CO lines are broad (Encrenaz et al. 1996). Thus, the smearing was found to have only a small effect on the final spectrum compared to the line width.
Table 3:
Saturn and Uranus physical characteristics (Conrath & Gautier 2000; de Graauw et al. 1997; Baines et al. 1995; Conrath et al. 1987; Lindal 1992).
![\begin{figure}
\par\includegraphics[height=7.4cm,width=16cm,clip]{9170fig8.eps} \end{figure}](/articles/aa/full/2008/23/aa9170-07/Timg29.gif) |
Figure 6:
Observed 12CO (2-1) spectra on Saturn. The total bandwidth is 4 GHz and the spectral resolution is 16 MHz. The spectra resulting from the upper limits we derived are plotted as follows: our 3-
upper limit of 6.3
10-8 in the stratosphere (external source of CO) in solid line and our 3- upper limit of 3.9
10-8 constant with altitude (internal source of CO) in long-dashed lines. The internal source of CO model (short-dashed lines) as well as the external source of CO (dotted lines) taken from Noll & Larson (1991) are also plotted for comparison with our upper limits. The absorption feature at 231.280 GHz is the terrestrial O3 line. |
| Open with DEXTER |
![\begin{figure}
\par\includegraphics[height=7.4cm,width=16cm,clip]{9170fig9.eps} \end{figure}](/articles/aa/full/2008/23/aa9170-07/Timg30.gif) |
Figure 7:
Observed 12CO (2-1) spectra on Uranus. The total bandwidth is 4 GHz and the spectral resolution is 16 MHz. The short-dashed lines correspond to the upper limit determined by Encrenaz et al. (2004) for a CO mixing ratio constant with altitude (
 10-8). The external source of CO model (dotted lines) is the Encrenaz et al. (2004) best fit model (
 10-8 restricted to the
stratosphere). Our 3-
upper limits are plotted in solid line (
10-8 restricted to the
stratosphere). Our 3-
upper limits are plotted in solid line (
 10-8, restricted to the stratosphere) and in long-dashed lines (
 10-8, constant with altitude). The absorption feature at 231.280 GHz is the terrestrial O3 line.
 |
| Open with DEXTER |
The rings of Saturn are sources of flux emission/absorption at millimeter wavelength
(de Pater & Dickel 1991; Dunn et al. 2005). With a Sub-Earth Point latitude of -14.3
at the time of the observations, the rings hide 10% of the northern part of the disk and add their own flux. This is why we pointed the telescope towards the planet between the southern limb and the rings. The contribution of the rings cannot be neglected when analysing submillimeter and infrared data. But Melnick et al. (1983) and de Pater & Dickel (1991)
show that the brightness temperature of the rings (20-30 K) is well below the
temperature of the disk at 1-mm and 3-mm (140 K). So the flux added by the ring contribution is not very important at these wavelengths. Therefore, we do not include the effect of the rings in our analysis. Moreover, as we do not analyse the data in terms of absolute intensities, we assume that the attenuation of the flux of the disk due to the rings does not change the result. Nevertheless, we pointed the telescope towards the mid-point of a segment going from the inner ring to the southern limb in order to have the maximum flux coming from the planet. This shift of the pointing on the planetary disk was taken into account when modeling the emission of the planet.
4 Analysis
The CO(1-0) and (2-1) lines are the weakest CO lines below 1000 GHz. Indeed, the tropopause temperature on Saturn and Uranus are
82 K and 53 K respectively, so that the population density of the energy levels peaks for higher frequency lines. However, the atmospheric opacity is lower at 115 GHz and 230 GHz than for higher frequencies. The best compromise at such low frequencies is reached
at 230 GHz. This is why the upper limits come from the 230 GHz observation analysis.
As a consequence of the broad width of the CO lines, we do not exactly reach the continuum in the 230 GHz spectrum of Saturn. Hence, the low frequency edges of the synthetic spectra have been rescaled to match the edge of the 3- model.
None of the CO lines we targeted were detected on Saturn or Uranus.
From the 230 GHz observations of Saturn analysis, we derive a CO mixing ratio 3- upper limit of 3.9
10-8
for a constant mixing ratio of CO with altitude. This is an improvement by a factor of 3 compared to the Rosenqvist et al. (1992) measurement. However, this limit is well above the 1 ppb level of the internal origin model of Noll & Larson (1991). If the bulk of CO is restricted to the stratosphere, then we derive an upper
limit for the CO mixing ratio of 6.3
10-8. Once again this value is above the
Noll & Larson (1991) value in the stratosphere (2.5
10-8), but only slightly. All the spectra discussed above are displayed in Fig. 6.
The observations of Uranus at 230 GHz (see Fig. 7) led to an upper limit of 1.8
10-8 for a mixing ratio constant with altitude (internal origin) and 2.7
10-8 if all the CO is in the stratosphere. The first value is consistent with the Encrenaz et al. (2004) upper limit for an internal source
and the second one is consistent with the upper limit derived by Marten et al. (1993). However, the latter seems to be in contradiction with the Encrenaz et al. (2004) detection level in the stratosphere, at face value. However, the authors mention that their fluorescence model could overestimate the CO abundance by at least a factor of 2.
5 Discussion
Observations of CO in the atmospheres of the giant planets are of key importance in order to determine the origin of oxygenated compounds that are present in their atmospheres.
CO was first detected in the atmosphere of Saturn in 1985-1986. Noll et al. (1986) could not distinguish
between an internal (
 ppb constant with altitude) and an external (
 10-8 restricted to the stratosphere)
supply of atmospheric CO. From their 1990-2230 cm-1 high-resolution spectrum, Noll & Larson (1991) detected thirteen CO lines but were unable to firmly conclude on an internal origin, even if one of the lines
favored an internal origin. From photochemical modeling, Moses et al. (2000) also could not distinguish between the origin scenarios,
although both an internal and an external origin was favored as the simplest method to explain all the CO, CO2 and H2O observations. In their photochemical model of the atmosphere of Saturn, Ollivier et al. (2000) proposed a cometary-like composition for
the oxygen external flux. This scenario cannot provide enough CO in the stratosphere of Saturn, so Ollivier et al. (2000)
tentatively inferred that CO was mixed upward from the deep interior levels. Contrary to Ollivier et al. (2000), Moses et al. (2000)
could not reproduce the CO2 and H2O data from ISO (Infrared space Observatory) with an influx of water alone and required some external influx
of carbon-oxygen bonded species. The 3-
upper limit of 3.9
10-8,
restricted to the stratosphere found here still cannot reject the external origin model from Noll & Larson (1991). It also cannot reject the external source model of Moses et al. (2000), where the CO mixing ratio increases with altitude and
becomes greater than our upper limit between 10-1 and 10-5 mbar. Because the atmospheric layers above 10-1-10-2 mbar do not contribute to the
radiation at these wavelengths, the line is not sensitive to an increase of the CO mixing ratio in this part of the stratosphere. New observations with higher sensitivity and/or more observing time would be needed at this frequency (230 GHz) to reach the 2.5 10-8 level.
10-8 restricted to the stratosphere)
supply of atmospheric CO. From their 1990-2230 cm-1 high-resolution spectrum, Noll & Larson (1991) detected thirteen CO lines but were unable to firmly conclude on an internal origin, even if one of the lines
favored an internal origin. From photochemical modeling, Moses et al. (2000) also could not distinguish between the origin scenarios,
although both an internal and an external origin was favored as the simplest method to explain all the CO, CO2 and H2O observations. In their photochemical model of the atmosphere of Saturn, Ollivier et al. (2000) proposed a cometary-like composition for
the oxygen external flux. This scenario cannot provide enough CO in the stratosphere of Saturn, so Ollivier et al. (2000)
tentatively inferred that CO was mixed upward from the deep interior levels. Contrary to Ollivier et al. (2000), Moses et al. (2000)
could not reproduce the CO2 and H2O data from ISO (Infrared space Observatory) with an influx of water alone and required some external influx
of carbon-oxygen bonded species. The 3-
upper limit of 3.9
10-8,
restricted to the stratosphere found here still cannot reject the external origin model from Noll & Larson (1991). It also cannot reject the external source model of Moses et al. (2000), where the CO mixing ratio increases with altitude and
becomes greater than our upper limit between 10-1 and 10-5 mbar. Because the atmospheric layers above 10-1-10-2 mbar do not contribute to the
radiation at these wavelengths, the line is not sensitive to an increase of the CO mixing ratio in this part of the stratosphere. New observations with higher sensitivity and/or more observing time would be needed at this frequency (230 GHz) to reach the 2.5 10-8 level.
The weakness of the internal heat source in Uranus may be the cause of the limited convection in the deep interior of the planet (Wallace 1980; Hunten 1978), implying a lack of disequilibrium species, like CO, in its troposphere. Moreover, the quasi-isothermal structure of Uranus in the 1-mbar to 1-bar pressure range does not favor spectroscopic detection of minor constituents.
The first attempts to detect CO at millimetric wavelengths led to
upper limits on the mid-atmospheric (10-mbar) CO mixing ratio (4
10-8, Rosenqvist et al. 1992; 3
10-8, Marten et al. 1993). From CSO-FTS observations, Encrenaz et al. (1996) inferred an upper limit for the tropospheric content of CO (5
10-7). The fluorescence of CO was detected in the atmosphere of Uranus by Encrenaz et al. (2004). Their atmospheric model suggests that the CO mixing ratio is greater in the stratosphere (3
10-8 if all CO is restricted to the stratosphere)
than in the troposphere (upper limit: 2
10-8). However, we did not detect the CO (2-1) line and a noise level analysis led to a 1.8
10-8 upper limit if the CO mixing ratio is constant with altitude (internal origin) and 2.7
10-8, if restricted to the stratosphere (external origin). Our upper limit for the internal origin is consistent with the one derived by Encrenaz et al. (2004).
However, our external origin upper limit is slightly lower than the Encrenaz et al. (2004) detection level. But, their model did not take
scattering by cloud particles into account. Therefore, the authors conclude that their values could be overestimated by at least a factor of 2. Thus, we suggest that Encrenaz et al. (2004) could have overestimated their measured value of the CO mixing ratio in the stratosphere
(external origin model) of Uranus and that scattering has a non negligible effect on the spectrum of Uranus at 4.7-m. From our observations, there is no
evidence of an external origin of CO. This molecule could be a good candidate for the production of the observed CO2 (Burgdorf et al. 2006).
Even if CO is not detected in our observations, the level of our upper limits does not imply that we should reconsider the possibility of production of CO2 from CO, since CO2 was detected at the
(4.0
0.5)
10-11 level. A complete photochemical model of Uranus, which
takes chemical uncertainties into account (Dobrijevic et al. 2003; Hébrard et al. 2007,2006) should
be developed in order to test several hypothese for the supply of H2O, CO2 and CO in order to understand their chemistry and to model the observed abundances of these species.
6 Conclusion
Although this attempt to detect CO in the atmospheres of Saturn and Uranus has failed, new upper limits have been derived. Our upper limit
on a CO internal source in the atmosphere of Saturn (3.9
10-8, constant with altitude) is better than the previously published one
(Rosenqvist et al. 1992) by a factor of 3. This upper limit on the internal source is far from the 1 ppb detection level of Noll & Larson (1991) and the upper limit we derived on the external source (6.3
10-8, restricted to the stratosphere)
is greater than the stratospheric abundance of CO in the external origin model of Noll & Larson (1991) (2.5
10-8) by a
factor of 2.5. New observations with higher sensitivity and/or more observing time should permit a derivation of the magnitude of the CO external
source on Saturn. Our non-detection of CO at the 1.8
10-8 level in the atmosphere of Uranus is consistent with the latest published upper limit
on an internal source of CO (2
10-8, Encrenaz et al. 2004). Moreover, the upper limit we derived on the magnitude of an external source
(2.7
10-8, restricted to the stratosphere) is below the detection level of Encrenaz et al. (2004). However, our measurement is not
incompatible with the result of Encrenaz et al. (2004) (3
10-8, restricted to the stratosphere). Their fluorescence model did
not take scattering effects by cloud particles into account. As a consequence, the mixing ratio they derived could have been overestimated. According
to the authors, the uncertainty on their result could be at least a factor of 2. Moreover, our new upper limits add new constraints on the possible temporal variability of the abundance of CO in the atmospheres of these planets.
From our observations, it is still impossible to conclude on the strength of the external flux of oxygen in the atmosphere of Saturn and Uranus.
This question could be answered by observing at higher frequency where the lines are stronger. Such observations would still need several hours
of integration because of the sky opacity, which is higher at such frequencies. Such observations would be focused on the stratospheric narrow emission
peak in order to derive the stratospheric CO abundance but could also be performed over a wide frequency range (Hesman et al. 2007; Lellouch et al. 2005).
CO observations with the Herschel Space Observatory would also be very valuable with regard to its foreseen outstanding capability to detect faint lines in short integration times.
Such observations should focus on the lines that have the strongest predicted line strength (good signal to noise ratio in a relatively short integration time) and for which observations are independent of the ammonia and phosphine abundances (Cavalié et al. 2007).
Acknowledgements
IRAM is supported by INSU/CNRS (France), MPG (Germany) and IGN (Spain).
- Baines, K. H.,
Mickelson, M. E., Larson, L. E., & Ferguson,
D. W. 1995, Icarus, 114, 328 [NASA ADS] [CrossRef]
- Beaky,
M. M., Goyette, T. M., & De Lucia, F. C. 1996,
J. Chem. Phys., 105, 3994 [NASA ADS] [CrossRef]
- Berge,
G. L., & Gulkis, S. 1976, Earth-based radio observations
of Jupiter: Millimeter to meter wavelengths, ed. T. Gehrels,
621
- Bergin, E. A.,
Lellouch, E., Harwit, M., et al. 2000, ApJ, 539, L147 [NASA ADS] [CrossRef]
- Bézard, B.,
Lellouch, E., Strobel, D., Maillard, J.-P., & Drossart, P.
2002, Icarus, 159, 95 [NASA ADS] [CrossRef]
(In the text)
- Borysow, A., &
Frommhold, L. 1986, ApJ, 304, 849 [NASA ADS] [CrossRef]
- Borysow, J., Trafton,
L., Frommhold, L., & Birnbaum, G. 1985, ApJ, 296, 644 [NASA ADS] [CrossRef]
- Borysow, J.,
Frommhold, L., & Birnbaum, G. 1988, ApJ, 326, 509 [NASA ADS] [CrossRef]
- Brown,
L. R., & Peterson, D. B. 1994, J. Mol. Spec., 168,
593 [NASA ADS] [CrossRef]
- Burgdorf, M., Orton,
G., van Cleve, J., Meadows, V., & Houck, J. 2006, Icarus, 184,
634 [NASA ADS] [CrossRef]
-
Cavalié, T., Billebaud, F., Lellouch, E., et al. 2007, in
Herschel Open time Key Program Workshop, 20-21 Feb. 2007,
ESTEC, Noordwick, The Netherlands
(In the text)
- Cavalié, T., Billebaud,
F., Biver, N., et al. 2008, Planet. Space Sci.,
submitted
(In the text)
- Conrath, B. J.,
& Gautier, D. 2000, Icarus, 144, 124 [NASA ADS] [CrossRef]
- Conrath, B., Hanel,
R., Gautier, D., Marten, A., & Lindal, G. 1987,
J. Geophys. Res., 92, 15003 [NASA ADS] [CrossRef]
- Coustenis, A.,
Salama, A., Lellouch, E., et al. 1998, A&A, 336, L85 [NASA ADS]
- Davis, G. R.,
Griffin, M. J., Naylor, D. A., et al. 1996, A&A,
315, L393 [NASA ADS]
(In the text)
- de Graauw, T.,
Feuchtgruber, H., Bezard, B., et al. 1997, A&A, 321,
L13 [NASA ADS]
- de Pater, I., &
Dickel, J. R. 1991, Icarus, 94, 474 [NASA ADS] [CrossRef]
- Dobrijevic, M.,
Ollivier, J. L., Billebaud, F., Brillet, J., & Parisot,
J. P. 2003, A&A, 398, 335 [NASA ADS] [CrossRef] [EDP Sciences]
- Draegert,
D. A., & Dudley, W. 1968, J. Opt. Soc. Am., 58, 1399 [NASA ADS]
- Dunn, D. E., de
Pater, I., Wright, M., Hogerheijde, M. R., & Molnar,
L. A. 2005, AJ, 129, 1109 [NASA ADS] [CrossRef]
- Encrenaz, T., Serabyn,
E., & Weisstein, E. W. 1996, Icarus, 124, 616 [NASA ADS] [CrossRef]
(In the text)
- Encrenaz, T.,
Lellouch, E., Drossart, P., et al. 2004, A&A, 413, L5 [NASA ADS] [CrossRef] [EDP Sciences]
(In the text)
- Feuchtgruber, H.,
Lellouch, E., de Graauw, T., et al. 1997, Nature, 389,
159 [NASA ADS] [CrossRef]
- Feuchtgruber, H.,
Lellouch, E., Encrenaz, T., et al. 1999, in The Universe as
Seen by ISO, ed. P. Cox, & M. Kessler, ESA Special
Publication, 427, 133
- Fletcher, L. N.,
Irwin, P. G. J., Teanby, N. A., et al. 2007,
Icarus, 189, 457 [NASA ADS] [CrossRef]
(In the text)
-
Hébrard, E., Dobrijevic, M., Bénilan, Y., & Raulin,
F. 2006, J. Photochem. Photobiol. C: Photochem. Rev., 7, 211 [CrossRef]
- Hébrard, E.,
Dobrijevic, M., Bénilan, Y., & Raulin, F. 2007,
Planet. Space Sci., 55, 1470 [NASA ADS] [CrossRef]
- Hesman, B. E.,
Davis, G. R., Matthews, H. E., & Orton, G. S.
2007, Icarus, 186, 342 [NASA ADS] [CrossRef]
- Hildebrand,
R. H., Loewenstein, R. F., Harper, D. A.,
et al. 1985, Icarus, 64, 64 [NASA ADS] [CrossRef]
(In the text)
- Hofstadter,
M. D., & Muhleman, D. O. 1989, Icarus, 81, 396 [NASA ADS] [CrossRef]
(In the text)
- Hunten, D. M.
1978, Nature, 276, 16 [NASA ADS] [CrossRef]
- Klein,
M. J., Janssen, M. A., Gulkis, S., & Olsen,
E. T. 1978, Saturn's microwave spectrum: Implications for the
atmosphere and the rings, ed. D. M. Hunten, & D.
Morrison (NASA conference publ. 2068), 195
(In the text)
- Lellouch, E. 1996, in
The Collision of Comet Shoemaker-Levy 9 and Jupiter,
ed. K. S. Noll, H. A. Weaver, & P. D.
Feldman, IAU Colloq., 156, 213
- Lellouch, E.,
Bézard, B., Moses, J. I., et al. 2002, Icarus, 159,
112 [NASA ADS] [CrossRef]
(In the text)
- Lellouch, E., Moreno,
R., & Paubert, G. 2005, A&A, 430, L37 [NASA ADS] [CrossRef] [EDP Sciences]
- Lévy, A.,
Lacome, N., & Tarrago, G. 1993, J. Mol. Spec., 157, 172 [NASA ADS] [CrossRef]
- Lévy, A.,
Lacome, N., & Tarrago, G. 1994, J. Mol. Spec., 166, 20 [NASA ADS] [CrossRef]
- Lindal, G. F.
1992, AJ, 103, 967 [NASA ADS] [CrossRef]
(In the text)
- Marten, A., Gautier,
D., Owen, T., et al. 1993, ApJ, 406, 285 [NASA ADS] [CrossRef]
(In the text)
- Melnick, G., Russell,
R. W., Gosnell, T. R., & Harwit, M. 1983, Icarus, 53,
310 [NASA ADS] [CrossRef]
(In the text)
- Moreno, R.
1998, Ph.D. Thesis, AA (Université Paris VI)
(In the text)
- Moses, J. I.
1996, in The Collision of Comet Shoemaker-Levy 9 and Jupiter,
ed. K. S. Noll, H. A. Weaver, & P. D.
Feldman, IAU Colloq., 156, 243
- Moses, J. I.,
Lellouch, E., Bézard, B., et al. 2000, Icarus, 145,
166 [NASA ADS] [CrossRef]
(In the text)
- Noll, K. S.,
& Larson, H. P. 1991, Icarus, 89, 168 [NASA ADS] [CrossRef]
(In the text)
- Noll, K. S.,
Knacke, R. F., Geballe, T. R., & Tokunaga, A. T.
1986, ApJ, 309, L91 [NASA ADS] [CrossRef]
(In the text)
- Ollivier, J. L.,
Dobrijévic, M., & Parisot, J. P. 2000,
Planet. Space Sci., 48, 699 [NASA ADS] [CrossRef]
(In the text)
- Orton, G. S.,
Griffin, M. J., Ade, P. A. R., Nolt, I. G.,
& Radostitz, J. V. 1986, Icarus, 67, 289 [NASA ADS] [CrossRef]
(In the text)
- Orton, G. S.,
Baines, K. H., Bergstrahl, J. T., et al. 1987,
Icarus, 69, 230 [NASA ADS] [CrossRef]
(In the text)
- Pickett, H. M.,
Poynter, I. R. L., Cohen, E. A., et al. 1998,
J. Quant. Spectr. Radiat. Transfer, 60, 883 [NASA ADS] [CrossRef]
(In the text)
- Rosenqvist, J.,
Lellouch, E., Romani, P. N., Paubert, G., & Encrenaz, T.
1992, ApJ, 392, L99 [NASA ADS] [CrossRef]
(In the text)
- Ulich, B. L.
1981, AJ, 86, 1619 [NASA ADS] [CrossRef]
(In the text)
- Varanasi, P. 1988, J.
Quant. Spectr. Radiat. Transfer, 39, 13 [NASA ADS] [CrossRef]
- Wallace, L. 1980,
Icarus, 43, 231 [NASA ADS] [CrossRef]
- Weisstein, E. W.,
& Serabyn, E. 1996, Icarus, 123, 23 [NASA ADS] [CrossRef]
Copyright ESO 2008
![\begin{figure}
\par (a)\includegraphics[height=5.7cm,width=7.8cm,clip]{9170fig1.eps} (b)\includegraphics[height=5.7cm,width=7.9cm,clip]{9170fig2.eps} \end{figure}](/articles/aa/full/2008/23/aa9170-07/img13.gif)
![\begin{figure}
\par (a)\includegraphics[height=5.7cm,width=7.8cm,clip]{9170fig3.eps} (b)\includegraphics[height=5.7cm,width=7.9cm,clip]{9170fig4.eps} \end{figure}](/articles/aa/full/2008/23/aa9170-07/img14.gif)
![\begin{figure}
\par\includegraphics[height=5.7cm,width=8cm,clip]{9170fig5.eps} \end{figure}](/articles/aa/full/2008/23/aa9170-07/img22.gif)
![\begin{figure}
\par\includegraphics[height=6.9cm,width=8cm,clip]{9170fig6.ps} \end{figure}](/articles/aa/full/2008/23/aa9170-07/img23.gif)
![\begin{figure}
\par\includegraphics[height=6.9cm,width=8cm,clip]{9170fig7.ps} \end{figure}](/articles/aa/full/2008/23/aa9170-07/img24.gif)
![\begin{figure}
\par\includegraphics[height=7.4cm,width=16cm,clip]{9170fig8.eps} \end{figure}](/articles/aa/full/2008/23/aa9170-07/img29.gif)
![\begin{figure}
\par\includegraphics[height=7.4cm,width=16cm,clip]{9170fig9.eps} \end{figure}](/articles/aa/full/2008/23/aa9170-07/img30.gif)