A&A 483, 453-459 (2008)
DOI: 10.1051/0004-6361:20078979
B. Famaey1 - A. Siebert2,3 - A. Jorissen1
1 - Institut d'Astronomie et d'Astrophysique, Université
Libre de Bruxelles, CP 226, Boulevard du Triomphe, 1050 Bruxelles, Belgium
2 -
Astrophysikalisches Institut Potsdam, An der Sterwarte 16, 14482
Potsdam, Germany
3 -
Observatoire de Strasbourg, 11 rue de l'Université, 67000 Strasbourg, France
Received 2 Nobember 2007 / Accepted 9 December 2007
Abstract
Aims. We investigate the nature of the classical low-velocity structures in the local velocity field, i.e. the Pleiades, Hyades, and Sirius moving groups. After using a wavelet transform to locate them in velocity space, we study their relation with the open clusters kinematically associated with them.
Methods. By directly comparing the location of moving group stars in parallax space to the isochrones of the embedded clusters, we check whether, within the observational errors on the parallax, all moving group stars could originate from the ongoing evaporation of the associated cluster.
Results. We conclude that, in each moving group, the fraction of stars making up the velocity-space overdensity superimposed on the background is higher than the fraction of stars compatible with the isochrone of the associated cluster. These observations thus favour a dynamical (resonant) origin for the Pleiades, Hyades, and Sirius moving groups.
Key words: Galaxy: kinematics and dynamics - Galaxy: open clusters and associations: general - Galaxy: disk - Galaxy: solar neighbourhood - stars: kinematics
It has been known for a long time that the local velocity field in the solar neighbourhood is clumpy, and that most of the observed clumps are made of spatially unbound groups of stars, called moving groups (e.g., Eggen 1958, 1960, 1975, 1983).
Although unbound, most of these moving groups, however, share the kinematics of well-known open clusters. The best documented low-velocity groups (e.g., Famaey et al. 2005; Chereul et al. 1998, 1999; Dehnen 1998; Montes et al. 2001; Ecuvillon et al. 2007) are the Hyades moving group (e.g., Famaey et al. 2007) associated with the Hyades cluster (600 Myr) and the Sirius moving group associated with the evaporating UMa star cluster (300 Myr). Another kinematic group called the Local Association or Pleiades moving group is a set of stars mostly associated with the Pleiades cluster (100 Myr), as well as a few other young clusters with ages all below 150 Myr (![]() Persei, NGC 2516, IC 2602 and Scorpio-Centaurus). Finally, the large group consisting of stars lagging behind the galactic rotation and moving outward in the disk (e.g., Blaauw 1970; Raboud et al. 1998; Famaey et al. 2005; Bensby et al. 2007) is called the Hercules stream.
Persei, NGC 2516, IC 2602 and Scorpio-Centaurus). Finally, the large group consisting of stars lagging behind the galactic rotation and moving outward in the disk (e.g., Blaauw 1970; Raboud et al. 1998; Famaey et al. 2005; Bensby et al. 2007) is called the Hercules stream.
The classical hypothesis of Eggen is that those low-velocity moving groups are, in fact, remnants of clusters that partly evaporated with time. Indeed, their prominence close to the Sun's position in velocity space without any vertical flow (e.g., Seabroke et al. 2007) is not compatible with the hypothesis that they are the result of merger events with satellite galaxies. Such satellite debris have been identified in the solar neigbourhood (Helmi et al. 2006; Arifyanto & Fuchs 2006; Dettbarn et al. 2007), but contain much fewer stars and move with higher velocities. However, Eggen's hypothesis is still debatable because at least some of the moving groups may also be generated by resonant mechanisms linked with the nonaxisymmetry and nonstationarity of the Galaxy. For example, a rotating bar at the centre of the Milky Way is now thought to be able to create the Hercules stream if the Sun is located near the outer Lindblad resonance (OLR) of the bar. The existence of such a kinematical group could be due to the coexistence at the OLR of orbits elongated along and perpendicular to the bar's major axis (Dehnen 2000), or to an overcrowding of chaotic regions in velocity space induced by the bar near the OLR (Fux 2001). On the other hand, moving groups with lower velocities such as the Hyades and the Pleiades could still be linked with the spirality of the Galaxy. For example, a series of strong transient spiral arms with their mean corotation at the solar galactocentric radius have been shown to produce similar structures in the local velocity distribution (De Simone et al. 2004), while a group such as the Hyades could also correspond to nearly-closed orbits trapped at the 4:1 inner Lindblad resonance (ILR) of a two-armed spiral density wave (Quillen & Minchev 2005).
Eggen's hypothesis and the dynamical perturbations by the bar and the spiral arms are of course not mutually incompatible scenarios. Clusters do evaporate over time and, at some intermediate stage, an unbound group of stars with similar velocities must appear (Woolley 1961). On the other hand, large spiral perturbations are known to indeed exist in the Galaxy and must have an effect on local stellar kinematics. So, for an individual moving group, how can we observationally distinguish between a pure Eggen scenario, a pure dynamical scenario and a mix of both?
Famaey et al. (2005) used a maximum-likelihood method (Luri et al. 1996) to model a sample of K and M giant stars (combining Hipparcos parallaxes with Tycho-2 proper motions and CORAVEL radial velocities) to assign each star to a kinematic base group. This allowed us to identify three main moving groups (Hercules, Sirius, and Hyades-Pleiades) and to plot the corresponding stars in Hertzsprung-Russell (HR) diagrams: the similarity between the HR diagrams of stars in the moving groups and in the background was noted, which argued in favour of a dynamical (resonant) origin for the groups rather than a coeval (evaporated cluster) origin. However, this method, although extremely powerful in yielding unbiased distance estimates, presented two shortcomings: first, the method revealed itself unable to separate distinct substructures on a scale smaller than 30 km s-1 (e.g., to separate the Hyades from the Pleiades moving group); second, although the similarity of HR diagrams for the moving groups and the background was striking, it did not statistically exclude the possibility of such HR diagrams being the result of coeval groups superimposed on the background. However, a complementary analysis of the Hyades moving group, by Famaey et al. (2007), based on the Geneva-Copenhagen catalogue of F and G dwarfs (Nordström et al. 2004), revealed that the number of stars in the group with respect to the total number of stars in the background was independent of mass, contrary to the expectations based on the difference between the initial mass function (IMF) of an evaporating cluster and the present-day mass function (PDMF) of the background, arguing again in favour of a resonant origin for the Hyades moving group.
Here, we reanalyse the data of Famaey et al. (2005) to circumvent the two shortcomings of the maximum-likelihood method. First, we use a wavelet transform (see Chereul et al. 1998, 1999, who had not used the radial velocities that are now available) to identify the structures on scales smaller than 30 km s-1. Second, by directly comparing the location of moving group stars in parallax space to isochrones of the embedded clusters, we independently confirm the dynamical nature of the groups (Famaey et al. 2005, 2007) in a robust statistical way.
Fifteen years of observations with the CORAVEL spectrometer on the Swiss 1-m telescope at the Observatoire de Haute Provence yielded the radial velocities of Hipparcos stars later than about F5 in the northern hemisphere. This unique database of radial velocities measured with a typical precision of 0.3 km s-1, combines a high precision and the absence of kinematic bias. The details of the sample of K and M giants used in this paper (combining Hipparcos parallaxes with Tycho-2 proper motions and CORAVEL radial velocities) can be found in Famaey et al. (2005).
The parametric maximum-likelihood technique of Luri et al. (1996) and Famaey et al. (2005) is not suited to finding small structures in the velocity space and cannot separate, for example, the Hyades and Pleiades moving groups. To detect these small-scale structures, we use a wavelet transform technique on the 2D velocity field defined by the U and V velocities (U is the velocity toward the galactic center, V the velocity in the direction of Galactic rotation, both with respect to the Sun). The method is similar to Chereul et al. (1998, 1999) analysis but for clarity, the main steps are summarized below.
Let us note that the method used in Famaey et al. (2005) had the great advantage of giving an unbiased statistical estimate of the distance of individual stars, unlike the inverse of the parallax affected by the Lutz-Kelker bias. In the process of analysing the distribution of stars in velocity space with the wavelet transform, we thus have to make use of the results of Famaey et al. (2005) concerning the distances of individual stars.
The wavelet transform by an oscillating and zero-integral mother
wavelet ![]() of a real one-dimensional signal F(x) is defined as:
of a real one-dimensional signal F(x) is defined as:
 |
(1) |
Following Chereul et al. (1998, 1999), we use the à trou algorithm (e.g., Holschneider et al. 1989) to compute the wavelet decomposition of our 2D velocity field. This algorithm relies on the definition of the mother wavelet ![]() as the difference at two different scales of the same smoothing function (or scaling function)
as the difference at two different scales of the same smoothing function (or scaling function) ![]() :
:
 |
(2) |
 |
(3) |
For our 2D analysis, we define
![]() .
The coefficients
Cs(i,j) (i.e. the smoothed signal at scale s and pixel (i,j)) are
given by the recursive relation
.
The coefficients
Cs(i,j) (i.e. the smoothed signal at scale s and pixel (i,j)) are
given by the recursive relation
 |
(4) |
| Ws(i,j)=Cs-1(i,j)-Cs(i,j). | (5) |
The original distribution is subject to Poisson noise and noise fluctuations
induce nonzero wavelet coefficients at each scale. These nonzero
coefficients generate artifacts mimicking substructures and must be removed
prior to the scientific analysis.
To reject the noise-induced coefficients and select only the regions
corresponding to real overdensities, we again follow Chereul et al.
(1999). We perform numerical simulations of a 2D Poisson noise and follow
rigourously the same procedure (binning and wavelet transform) to estimate
the amplitude of the wavelet coefficients generated by the noise at each
scale. We then compute a threshold,
![]() ,
at each scale and each pixel, such that the probability that the noise wavelet coefficient is larger than this threshold is P=10-4. We subsequently apply a hard thresholding to clean the wavelet
coefficients using
,
at each scale and each pixel, such that the probability that the noise wavelet coefficient is larger than this threshold is P=10-4. We subsequently apply a hard thresholding to clean the wavelet
coefficients using
![$\displaystyle %
W_{s}(i,j)=
\left\{
\begin{array}{l}
W_{s}(i,j)~~{\rm if}~~ W_{s}(i,j) \geq \lambda_{s}^+(i,j),\\ [2mm]
0 ~~ {\rm otherwise}.
\end{array}\right.$](/articles/aa/full/2008/20/aa8979-07/img30.gif) |
(6) |
![\begin{figure}
\par\includegraphics[width=6.7cm,clip]{Famaey_scale4_background.ps}\end{figure}](/articles/aa/full/2008/20/aa8979-07/img31.gif) |
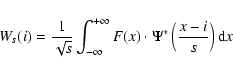
Figure 1: Contours and wavelet coefficients in the [U,V] plane for the Famaey et al. (2005) sample. Black: isocontours of the velocity distribution smoothed over 14 km s-1. The color scales with the wavelet coefficients at scale 4 (14 km s-1) after thresholding. The four structures observed in the wavelet space correspond to the Hercules stream ( bottom green structures), Pleiades and Hyades ( middle red structures from right to left), and Sirius (yellow, top). The limit of the structures in the wavelet space are used to select the samples for further analysis. |
| Open with DEXTER | |
The wavelet coefficients at scale 4 (see Fig. 1) are nonzero in the three boxes of the [U,V]-plane, corresponding to (i) the Pleiades (
![]() ,
,
![]() ); (ii) the Hyades (
); (ii) the Hyades (
![]() ,
,
![]() ); and (iii) Sirius (
); and (iii) Sirius (
![]() ,
,
![]() ). Interestingly, the Hercules stream is also recovered, but is separated in two different substructures (
). Interestingly, the Hercules stream is also recovered, but is separated in two different substructures (
![]() and [-40 -30],
and [-40 -30],
![]() ), a fact that had not as yet been identified in previous studies.
), a fact that had not as yet been identified in previous studies.
The most interesting result from this wavelet analysis is thus the similarity between the small-scale structure of the Hyades-Pleiades moving group and the Hercules stream. They both appear as a pair of groups. If they are both of dynamical origin, this could provide an important new constraint on dynamical models designed to reproduce them (see e.g. Fig. 9 of De Simone et al. 2004).
Now that the locations of the substructures have been precisely identified in velocity space, we examine whether these subtsructures result from the sole evaporation of the main clusters associated with them. Since the dynamical nature of the Hercules stream is well-proven from a detailed analysis of its chemical heterogeneity (Bensby et al. 2007), we concentrate hereafter on the Pleiades, Hyades and Sirius moving groups.
For each zone in velocity-space determined hereabove with the wavelet technique, we shall first estimate the fraction of stars in the moving group and in the background. Then, we shall assume that all the stars of the group are coeval and thus located on a single isochrone in the Hertzsprung-Russell diagram. We can then compute for each star the parallax that would correspond to this isochrone. Then, the relative difference (normalized by the error) of the Hipparcos parallaxes and isochrone parallaxes should follow a Gaussian of mean 0 and standard dispersion 1 after the distribution of background stars in parallax space has been subtracted. If this is not the case, the moving group will be proven to be, at least partially, of dynamical (resonant) origin.
![\begin{figure}
\par\includegraphics[width=6.3cm,clip]{histoU_Pleiades.eps}\vspac...
...}\vspace*{3mm}
\includegraphics[width=6.3cm,clip]{histoU_Sirius.eps}\end{figure}](/articles/aa/full/2008/20/aa8979-07/img40.gif) |
Figure 2:
Top: U distribution of stars from the Famaey et al. (2005) sample for the Pleiades strip |
| Open with DEXTER | |
To separate the background from the Pleiades
component, we plotted (Fig. 2) the histogram of stars in the strip ![]() (km s-1)
(km s-1) ![]() -18 (corresponding to
the range spanned by the Pleiades in Fig. 1),
and fitted three separate Gaussians to the total histogram (see Famaey et al. 2007): one
representing the background, another representing the Pleiades, and the
last one partially representing the Hyades (which partially contaminates the U-distribution in this strip). Since the Hyades V-strip is slightly different from the Pleiades one, we repeated the operation for the Hyades with the strip
-18 (corresponding to
the range spanned by the Pleiades in Fig. 1),
and fitted three separate Gaussians to the total histogram (see Famaey et al. 2007): one
representing the background, another representing the Pleiades, and the
last one partially representing the Hyades (which partially contaminates the U-distribution in this strip). Since the Hyades V-strip is slightly different from the Pleiades one, we repeated the operation for the Hyades with the strip ![]() (km s-1)
(km s-1) ![]() -12. Finally, for Sirius, we fitted only two Gaussians to the histogram in the strip
-12. Finally, for Sirius, we fitted only two Gaussians to the histogram in the strip ![]() (km s-1)
(km s-1) ![]() 8. The parameters of the Gaussians yielding the best fit to the data are
given in Table 1 for the Pleiades strip, Table 2 for the Hyades strip, and Table 3 for the Sirius strip. It is worth noting that the
8. The parameters of the Gaussians yielding the best fit to the data are
given in Table 1 for the Pleiades strip, Table 2 for the Hyades strip, and Table 3 for the Sirius strip. It is worth noting that the
![]() of the background Gaussian (33 km s-1) is consistent with the
result listed in Table 2 of Famaey et al. (2005), and that the
parameters of the Hyades and Pleiades Gaussians are precisely identical (except for
of the background Gaussian (33 km s-1) is consistent with the
result listed in Table 2 of Famaey et al. (2005), and that the
parameters of the Hyades and Pleiades Gaussians are precisely identical (except for ![]() and for the absolute number of stars present in the strip).
and for the absolute number of stars present in the strip).
We then obtained the relative contribution of each moving group with
respect to the background at their corresponding location in the [U,V]-plane by integrating these
Gaussians over a range in U corresponding to
![]() .
We chose this range to match the regions where the wavelet coefficients are nonzero (precisely in the case of the Pleiades, approximately in the case of the Hyades and Sirius, see Fig. 1), i.e.
.
We chose this range to match the regions where the wavelet coefficients are nonzero (precisely in the case of the Pleiades, approximately in the case of the Hyades and Sirius, see Fig. 1), i.e.
![]() for the Pleiades; [-39,-25] for the Hyades; and [-2,12] for Sirius. We find that, in these regions of velocity space, the percentages of stars physically belonging to the Pleiades, Hyades, and Sirius moving groups are respectively 46% (111/239 stars in the Pleiades), 52% (150/290 stars in the Hyades), and 35% (60/169 in Sirius).
for the Pleiades; [-39,-25] for the Hyades; and [-2,12] for Sirius. We find that, in these regions of velocity space, the percentages of stars physically belonging to the Pleiades, Hyades, and Sirius moving groups are respectively 46% (111/239 stars in the Pleiades), 52% (150/290 stars in the Hyades), and 35% (60/169 in Sirius).
Table 1:
Parameters of the Gaussians fitting the U distribution of
stars from Famaey et al. (2005), in the V-strip
corresponding to the Pleiades, ![]() (km s-1)
(km s-1) ![]() -18. The parameters ki give the relative fractions
-18. The parameters ki give the relative fractions
![]() ,
where Ni is the total number of stars in
component i, and
,
where Ni is the total number of stars in
component i, and
![]() is the total number of stars in the
V-strip. The fraction fs is the
relative fraction of stars from the Pleiades moving group with respect to
all stars in the restricted
is the total number of stars in the
V-strip. The fraction fs is the
relative fraction of stars from the Pleiades moving group with respect to
all stars in the restricted ![]()
![]() range
around the Gaussian average, corresponding to the Pleiades zone where the wavelet coefficients are nonzero at scale 4 (see Sect. 3).
range
around the Gaussian average, corresponding to the Pleiades zone where the wavelet coefficients are nonzero at scale 4 (see Sect. 3).
Table 2:
Same as Table 1 in the V-strip corresponding to the Hyades, ![]() (km s-1)
(km s-1) ![]() -12, with
-12, with
![]() .
.
Table 3:
Same as Table 1 in the V-strip corresponding to the Sirius moving group, ![]() (km s-1)
(km s-1) ![]() 8, with
8, with
![]() .
.
![\begin{figure}
\par\includegraphics[width=6.3cm,clip]{HR_Pleiades_gaussian.eps}\...
...ace*{2mm}
\includegraphics[width=6.3cm,clip]{HR_Sirius_gaussian.eps}\end{figure}](/articles/aa/full/2008/20/aa8979-07/img46.gif) |
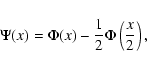
Figure 3:
Top: comparison of the 100 Myr isochrone (Z=0.02) from Schaller et al. (1992) and Lejeune & Schaerer (2001), with the stars kinematically
associated with the Pleiades cluster/moving group. Note that
absolute magnitudes have been derived from a simple inversion of the parallax, and are thus biased, which is not a problem for the subsequent analysis done in parallax space. Stars whose parallax is within |
| Open with DEXTER | |
We plot the stars kinematically associated with the various groups (i.e. stars in the regions defined by the V-strip and within ![]() of the mean of the U-Gaussian hereabove) in HR diagrams (Fig. 3), together with the isochrone of the asscociated cluster (100 Myr for the Pleiades; 600 Myr for the Hyades; and 300 Myr for Sirius). Let us stress again that these HR diagrams mix stars from the background and from the moving groups/clusters. Because we perform an analysis in parallax space hereafter, we chose to plot the (biased) stellar absolute magnitude
of the mean of the U-Gaussian hereabove) in HR diagrams (Fig. 3), together with the isochrone of the asscociated cluster (100 Myr for the Pleiades; 600 Myr for the Hyades; and 300 Myr for Sirius). Let us stress again that these HR diagrams mix stars from the background and from the moving groups/clusters. Because we perform an analysis in parallax space hereafter, we chose to plot the (biased) stellar absolute magnitude
![]() obtained directly from the inversion of the Hipparcos parallax and from the Hipparcos magnitude Hp and the
obtained directly from the inversion of the Hipparcos parallax and from the Hipparcos magnitude Hp and the
![]() color index, instead of the unbiased absolute magnitude of Famaey et al. (2005). The absorption correction
color index, instead of the unbiased absolute magnitude of Famaey et al. (2005). The absorption correction ![]() taken from Famaey et al. (2005) has been applied, however. Note that those absolute magnitudes plotted are thus subject to the Lutz-Kelker bias but that, again, this is not a problem since the comparison between isochrone and star locations will be made in the parallax space. Finally, the
taken from Famaey et al. (2005) has been applied, however. Note that those absolute magnitudes plotted are thus subject to the Lutz-Kelker bias but that, again, this is not a problem since the comparison between isochrone and star locations will be made in the parallax space. Finally, the
![]() index, taken as well from Famaey et al. (2005), is derived from the
index, taken as well from Famaey et al. (2005), is derived from the
![]() index using the colour transformation from Platais et al. (2003). We have used isochrones from the basic grid (labelled ``c'') of Schaller et al. (1992) (metallicity Z = 0.02, standard mass loss, core overshoot, OPAL opacities), as reprocessed by Lejeune & Schaerer (2001), to provide the photometric indices from the Johnson
index using the colour transformation from Platais et al. (2003). We have used isochrones from the basic grid (labelled ``c'') of Schaller et al. (1992) (metallicity Z = 0.02, standard mass loss, core overshoot, OPAL opacities), as reprocessed by Lejeune & Schaerer (2001), to provide the photometric indices from the Johnson ![]() and Cousins RI bands.
and Cousins RI bands.
We then computed for each star in the kinematical samples the parallax
![]() expected if the star would lie along the associated cluster isochrone. For the region where RGB and AGB overlap, there are more stars in the He-clump or on the RGB, since the lifetime is longer in these two phases than on the AGB. Therefore, the expected parallax is computed from those parts of the isochrones corresponding to the He-clump and RGB. Note that, since the isochrones of Lejeune & Schaerer (2001) do not cover the whole range of observed
expected if the star would lie along the associated cluster isochrone. For the region where RGB and AGB overlap, there are more stars in the He-clump or on the RGB, since the lifetime is longer in these two phases than on the AGB. Therefore, the expected parallax is computed from those parts of the isochrones corresponding to the He-clump and RGB. Note that, since the isochrones of Lejeune & Schaerer (2001) do not cover the whole range of observed
![]() colors, the number of stars to which an ``isochrone parallax'' could be assigned is slightly smaller than the total number of stars in the considered region of velocity space.
colors, the number of stars to which an ``isochrone parallax'' could be assigned is slightly smaller than the total number of stars in the considered region of velocity space.
The normalized difference between the ``isochrone parallax''
![]() and the measured Hipparcos parallax
and the measured Hipparcos parallax
![]() ,
,
 |
(7) |
 |
(8) |
Then, if a moving group is solely associated with the evaporation of its associated cluster, the subtraction of ![]() from the total histogram of
from the total histogram of ![]() in the velocity-space region should yield the typical distribution of
in the velocity-space region should yield the typical distribution of ![]() for the background population. If this is not the case, the moving group would prove to be, at least partially, linked with a dynamical (resonant) mechanism.
for the background population. If this is not the case, the moving group would prove to be, at least partially, linked with a dynamical (resonant) mechanism.
![\begin{figure}
\par\includegraphics[width=6.2cm,clip]{boxgauss_Pleiades.eps}\end{figure}](/articles/aa/full/2008/20/aa8979-07/img59.gif) |
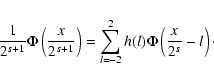
Figure 4:
Histogram of |
| Open with DEXTER | |
The histogram of ![]() for the 100 Myr isochrone has been plotted in Fig. 4, together with the Gaussian histogram
for the 100 Myr isochrone has been plotted in Fig. 4, together with the Gaussian histogram ![]() corresponding to the hypothesis that all stars of the Pleiades moving group (i.e. 46% of the stars in the Pleiades velocity-zone) are falling on the 100 Myr isochrone. Very clearly, the actual amount of stars really present in the
corresponding to the hypothesis that all stars of the Pleiades moving group (i.e. 46% of the stars in the Pleiades velocity-zone) are falling on the 100 Myr isochrone. Very clearly, the actual amount of stars really present in the ![]() -interval covered by the Gaussian is much too low as compared to
-interval covered by the Gaussian is much too low as compared to ![]() to be compatible with the hypothesis that 46% of the stars are coeval at 100 Myr. If we subtract
to be compatible with the hypothesis that 46% of the stars are coeval at 100 Myr. If we subtract ![]() from the actual histogram to find the background distribution in parallax space, we find that the background density distribution is highly negative close to the 100 Myr isochrone, which of course does not make any sense.
from the actual histogram to find the background distribution in parallax space, we find that the background density distribution is highly negative close to the 100 Myr isochrone, which of course does not make any sense.
This is thus a robust proof that the Pleiades moving group is not associated with the evaporation of the Pleiades cluster. Note that the excess of stars in the ![]() histogram, compared to the expectation for an evaporated cluster, is more prominent for positive values of
histogram, compared to the expectation for an evaporated cluster, is more prominent for positive values of ![]() :
these stars are closer (and thus intrinsically fainter) than what they should be to fall on the 100 Myr isochrone, meaning that correcting for the Malmquist bias (i.e. the fact that intrinsically faint objects are missing from such a magnitude-limited sample) would make the problem even worse. Actually, a qualitative look at Fig. 3 reveals that 15 stars are clearly falling close to the 100 Myr isochrone, and are thus likely members of the evaporated Pleiades cluster.
:
these stars are closer (and thus intrinsically fainter) than what they should be to fall on the 100 Myr isochrone, meaning that correcting for the Malmquist bias (i.e. the fact that intrinsically faint objects are missing from such a magnitude-limited sample) would make the problem even worse. Actually, a qualitative look at Fig. 3 reveals that 15 stars are clearly falling close to the 100 Myr isochrone, and are thus likely members of the evaporated Pleiades cluster.
![\begin{figure}
\par\includegraphics[width=6.2cm,clip]{boxgauss_Hyades.eps}\end{figure}](/articles/aa/full/2008/20/aa8979-07/img60.gif) |
Figure 5: Same as Fig. 4 for the Hyades moving group and the 600 Myr isochrone. |
| Open with DEXTER | |
The histogram of ![]() for the 600 Myr isochrone has been plotted in Fig. 5, together with the Gaussian histogram
for the 600 Myr isochrone has been plotted in Fig. 5, together with the Gaussian histogram ![]() ,
corresponding to the hypothesis that all stars of the Hyades moving group (i.e. 52% of the stars in the Hyades velocity-zone) are falling on the 600 Myr isochrone. Very clearly, subtracting
,
corresponding to the hypothesis that all stars of the Hyades moving group (i.e. 52% of the stars in the Hyades velocity-zone) are falling on the 600 Myr isochrone. Very clearly, subtracting ![]() from the observed histogram implies that the background population on which the Hyades group is superimposed has a gap in parallax space close to the 600 Myr isochrone.
from the observed histogram implies that the background population on which the Hyades group is superimposed has a gap in parallax space close to the 600 Myr isochrone.
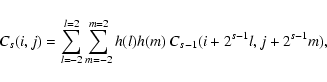
To check whether this is the case, we computed the ![]() -histogram in a comparison box symmetrical to the Hyades with respect to U=-2, i.e. U=[21,35],
V=[-24,-12]. This histogram (grey-shaded in Fig. 6) should be representative of the
-histogram in a comparison box symmetrical to the Hyades with respect to U=-2, i.e. U=[21,35],
V=[-24,-12]. This histogram (grey-shaded in Fig. 6) should be representative of the ![]() -distribution of the background population in the Hyades velocity-zone. We see in Fig. 6 that this histogram is in disagreement with the
-distribution of the background population in the Hyades velocity-zone. We see in Fig. 6 that this histogram is in disagreement with the ![]() -distribution in the Hyades velocity-zone after subtracting
-distribution in the Hyades velocity-zone after subtracting ![]() (Fig. 6 bottom; normalized to the number of stars in the comparison box), but compatible with the full
(Fig. 6 bottom; normalized to the number of stars in the comparison box), but compatible with the full ![]() -distribution in the Hyades velocity zone (Fig. 6 top). We tested the influence of the metallicity adopted for the isochrone (see Fig. 3), and of the actual age assigned to the Hyades cluster (by trying 800 Myr instead of 600) on our result, and found the same disagreement. We conclude that it is impossible that the Hyades moving group, representing 52% of the stars in the Hyades velocity-zone, is entirely made of stars evaporated from the Hyades cluster.
-distribution in the Hyades velocity zone (Fig. 6 top). We tested the influence of the metallicity adopted for the isochrone (see Fig. 3), and of the actual age assigned to the Hyades cluster (by trying 800 Myr instead of 600) on our result, and found the same disagreement. We conclude that it is impossible that the Hyades moving group, representing 52% of the stars in the Hyades velocity-zone, is entirely made of stars evaporated from the Hyades cluster.
![\begin{figure}
\par\includegraphics[width=7.1cm,clip]{compa_Hyades.eps}\end{figure}](/articles/aa/full/2008/20/aa8979-07/img61.gif) |
Figure 6:
The shaded area is the histogram of |
| Open with DEXTER | |
![\begin{figure}
\par\includegraphics[width=6.2cm,clip]{boxgauss_Sirius.eps}\end{figure}](/articles/aa/full/2008/20/aa8979-07/img62.gif) |
Figure 7: Same as Figs. 4 and 5 for the Sirius moving group and the 300 Myr isochrone. |
| Open with DEXTER | |
![\begin{figure}
\par\includegraphics[width=7.2cm,clip]{compa_Sirius.eps}\end{figure}](/articles/aa/full/2008/20/aa8979-07/img63.gif) |
Figure 8:
The shaded area is the histogram of |
| Open with DEXTER | |
We plotted the histogram of ![]() for the 300 Myr isochrone in Fig. 7, together with the Gaussian histogram
for the 300 Myr isochrone in Fig. 7, together with the Gaussian histogram ![]() ,
corresponding to the hypothesis that all stars of the Sirius moving group (i.e. 35% of the stars in the Sirius velocity-zone) are falling on the 300 Myr isochrone.
,
corresponding to the hypothesis that all stars of the Sirius moving group (i.e. 35% of the stars in the Sirius velocity-zone) are falling on the 300 Myr isochrone.
We then computed (grey-shaded in Fig. 8) the ![]() -histogram in a comparison box symmetrical to Sirius with respect to U=-2, i.e.
U=[-16,-2], V=[-5,8]. This histogram should be representative of the
-histogram in a comparison box symmetrical to Sirius with respect to U=-2, i.e.
U=[-16,-2], V=[-5,8]. This histogram should be representative of the ![]() -distribution of the background population in the Sirius velocity-zone. We compared it to both the full
-distribution of the background population in the Sirius velocity-zone. We compared it to both the full ![]() -distribution in the Sirius velocity zone, and to the
-distribution in the Sirius velocity zone, and to the ![]() -distribution in the Sirius velocity-zone after subtracting
-distribution in the Sirius velocity-zone after subtracting ![]() .
In each case, we normalized the histogram to the number of stars in the comparison box. Once again, while the observed histogram of
.
In each case, we normalized the histogram to the number of stars in the comparison box. Once again, while the observed histogram of ![]() in the comparison box is compatible with the total one in the Sirius box, it is in Poissonian disagreement with the histogram obtained after subtracting
in the comparison box is compatible with the total one in the Sirius box, it is in Poissonian disagreement with the histogram obtained after subtracting ![]() (especially around
(especially around ![]() ). However, the disagreement is less obvious than for the Hyades: this is because the Sirius overdensity superimposed on the background is much less prominent than the Hyades overdensity (see Fig. 2).
). However, the disagreement is less obvious than for the Hyades: this is because the Sirius overdensity superimposed on the background is much less prominent than the Hyades overdensity (see Fig. 2).
We have reanalysed the data of Famaey et al. (2005) by using a wavelet transform to identify the main low-velocity moving groups on scales smaller than 30 km s-1, and by subsequently comparing the location of moving-group stars in parallax space to isochrones of the embedded clusters.
This leads to the result that moving groups appear in pairs in the [U,V]-diagram (the Hyades and Pleiades groups are similar to the two distinct structures in the Hercules stream), which could provide new interesting constraints on dynamical models designed to reproduce these features (see e.g. Fig. 9 of De Simone et al. 2004; Fig. 6 of Quillen & Minchev 2005; and Fig. 10 of Chakrabarty 2007), if their origin lies in resonant trapping by the bar, spiral arms, or a mixture of both. We are also interesting in checking in the future whether some differences in metallicities could be observed between the two distinct structures of the Hercules stream to check whether they could have an origin at different galactocentric radii.
Moreover, this study confirms the dynamical (resonant) nature of the Pleiades, Hyades, and Sirius moving groups (see also, Famaey et al. 2007) because the fraction of stars making up each velocity-space overdensity superimposed on the background is higher than the fraction of stars compatible with the isochrone of the embedded cluster. The similarity between the parallax distributions (with respect to the isochrone), in the velocity-zones representative of the background and of the moving groups, is in fact striking (see Figs. 6 and 8), and again demonstrates that the group stars share the same distribution as the background stars in the HR diagram. These low-velocity moving groups have thus a different nature than, e.g., the HR1614 group (
![]() ,
,
![]() ,
see De Silva et al. 2007), which was recently proven to be an evaporated cluster.
,
see De Silva et al. 2007), which was recently proven to be an evaporated cluster.
The next check of this resonant origin of the Pleiades, Hyades, and Sirius moving groups should be a detailed chemical tagging of stars kinematically associated with the groups (Freeman & Bland-Hawthorn 2002) from their element abundance patterns. For instance, we have identified here 290 giant stars kinematically associated with the Hyades, out of which 150 are making up the Hyades overdensity in velocity space (or Hyades moving group). In the resonant scenario, we expect less than 150 giant stars in this sample to have chemical abundances in precise accordance with those of the Hyades cluster (De Silva et al. 2006), although we still expect some of them to be part of the evaporating cluster. Note that we would however expect those 150 stars to be more metal-rich on average than the background because of the likely origin of the moving group in the inner parts of the Galaxy (see e.g. Daflon & Cunha 2004, for the galactic metallicity gradient). In the case of the Sirius moving group, since the overdensity superimposed on the background is much less prominent than the Hyades overdensity (see Fig. 2), and since the evaporated Ursa Major cluster could still make up a large part of the moving group, the real dynamical overdensity should not represent as large a part of the sample as for the Hyades in a chemical tagging analysis. Finally, we would like to conduct another independent check of the resonant origin of the moving groups, by studying the individual kinematics of open clusters in the galactic disk (e.g., Frinchaboy 2006): within the resonant scenario, open clusters with a wide range of ages should show the same overdensities in the [U,V]-diagram as the individual stars studied in this paper.
Acknowledgements
We thank Pavel Kroupa for useful discussions that, in part, triggered the present study.