A&A 483, L9-L12 (2008)
DOI: 10.1051/0004-6361:200809697
LETTER TO THE EDITOR
N. V. Voshchinnikov1,2 - T. Henning3
1 - Sobolev Astronomical Institute,
St. Petersburg University, Universitetskii prosp. 28,
St. Petersburg 198504, Russia
2 -
Isaac Newton Institute of Chile, St. Petersburg Branch, Russia
3 -
Max-Planck-Institut für Astronomie, Königstuhl 17, 69117 Heidelberg, Germany
Received 3 March 2008 / Accepted 21 March 2008
Abstract
The flattening of the 10
![]() silicate emission feature
observed in the spectra of T Tauri and Herbig Ae/Be stars
is usually interpreted as an indicator of grain growth.
We show in this paper that a similar behaviour of the feature shape occurs
when the porosity of composite grains varies.
We modelled the fluffy aggregates with inclusions of different sizes with
multi-layered spheres consisting of
amorphous carbon, amorphous silicate, and vacuum.
We also found that
the inclusion of crystalline silicates in composite porous particles
can lead to a shift of the known resonances and production of new ones.
silicate emission feature
observed in the spectra of T Tauri and Herbig Ae/Be stars
is usually interpreted as an indicator of grain growth.
We show in this paper that a similar behaviour of the feature shape occurs
when the porosity of composite grains varies.
We modelled the fluffy aggregates with inclusions of different sizes with
multi-layered spheres consisting of
amorphous carbon, amorphous silicate, and vacuum.
We also found that
the inclusion of crystalline silicates in composite porous particles
can lead to a shift of the known resonances and production of new ones.
Key words: line: profiles - stars: pre-main-sequence - stars: planetary systems: protoplanetary disks - stars: circumstellar matter - infrared: stars - ISM: dust, extinction
The shape and strength of the silicate emission feature observed
near 10
![]() in the spectra of
T Tauri and Herbig Ae/Be (HAeBe) stars is commonly used as a measure of grain
growth in protoplanetary discs (see Natta et al. 2007,
for a review).
It is well-known theoretically that
with an increase of the grain size,
the feature becomes wider and eventually fades away.
In the case of compact spherical grains with a composition
of astronomical silicate, the 10
in the spectra of
T Tauri and Herbig Ae/Be (HAeBe) stars is commonly used as a measure of grain
growth in protoplanetary discs (see Natta et al. 2007,
for a review).
It is well-known theoretically that
with an increase of the grain size,
the feature becomes wider and eventually fades away.
In the case of compact spherical grains with a composition
of astronomical silicate, the 10
![]() feature disappears when
the grain radius exceeds
feature disappears when
the grain radius exceeds ![]()
![]() (see Fig. 1).
(see Fig. 1).
The standard approach to modelling the 10
![]() feature
includes calculations of light absorption by several populations of
compact (and hollow) silicate spheres.
Amorphous and crystalline particles of small and large sizes
are used to fit the observed emission profiles.
The model was first suggested by Bouwman et al. (2001)
and then modified by van Boekel et al. (2005).
It was used by Schegerer et al. (2006);
Honda et al. (2006);
Kessler-Silacci et al. (2006); Sargent et al. (2006);
Sicilia-Aguilar et al. (2007); and
Bouwman et al. (2008)
to fit the observational data.
Further the authors searched for correlations between
the estimated mass fractions of large and crystalline
grains and different stellar
and disc parameters like mass, luminosity, age, spectral type, etc.
As a rule, the correlations are absent or rather weak
(see Table 5, Sicilia-Aguilar et al. 2007).
feature
includes calculations of light absorption by several populations of
compact (and hollow) silicate spheres.
Amorphous and crystalline particles of small and large sizes
are used to fit the observed emission profiles.
The model was first suggested by Bouwman et al. (2001)
and then modified by van Boekel et al. (2005).
It was used by Schegerer et al. (2006);
Honda et al. (2006);
Kessler-Silacci et al. (2006); Sargent et al. (2006);
Sicilia-Aguilar et al. (2007); and
Bouwman et al. (2008)
to fit the observational data.
Further the authors searched for correlations between
the estimated mass fractions of large and crystalline
grains and different stellar
and disc parameters like mass, luminosity, age, spectral type, etc.
As a rule, the correlations are absent or rather weak
(see Table 5, Sicilia-Aguilar et al. 2007).
In this Letter, we show that
the shape, position, and strength of the 10
![]() silicate feature
is also influenced by variations of the properties of
small mass composite aggregate grains.
We modelled the fluffy aggregates
by multi-layered spheres
(see also Voshchinnikov et al. 2006).
This particle model permits us to include an arbitrary fraction of
materials, and computations do not require large resources.
silicate feature
is also influenced by variations of the properties of
small mass composite aggregate grains.
We modelled the fluffy aggregates
by multi-layered spheres
(see also Voshchinnikov et al. 2006).
This particle model permits us to include an arbitrary fraction of
materials, and computations do not require large resources.
Fluffy particles should appear as a result of grain coagulation in interstellar clouds and protoplanetary discs (e.g., Henning & Stognienko 1996; Dominik & Tielens 1997; Jones 2004; Ormel et al. 2007). It is expected that aggregates can consist of several silicate and carbon sub-particles of different sizes that can be treated as inclusions in a vacuum matrix.
We use the model of spherical multi-layered particles introduced by Voshchinnikov & Mathis (1999). Later, Voshchinnikov et al. (2005) demonstrated that the optical properties of layered spheres resemble those of fluffy aggregates with inclusions of different sizes.
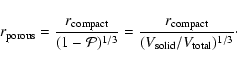
Our model parameters are: the refractive indices and volume fractions
![]() of the materials and the radius of compact particles
of the materials and the radius of compact particles
![]() .
The amount of vacuum in the particle (the particle porosity
.
The amount of vacuum in the particle (the particle porosity
![]() ,
,
![]() )
is
)
is
For calculations, we use different kinds of carbon and silicates: amorphous carbon Be1 and AC1 (Rouleau & Martin 1991), amorphous silicate with olivine composition (Dorschner et al. 1995), crystalline olivine (Fabian et al. 2001), and astronomical silicate (astrosil; Laor & Draine 1993).
The silicate feature in the N band was observed in spectra of
a large variety of objects (see Henning 2008, for a recent review).
We should caution the reader that we calculate absorption
efficiencies, but measure the fluxes. A detailed analysis of disc
spectra certainly requires radiative transfer calculations.
Assuming that the silicate emission is optically thin, we
can compare observed fluxes with theoretical profiles. The latter
are proportional to the product of particle absorption cross section
by the Planck function with the particle temperature
![]()
![]() .
Radiative transfer calculations show that grains of
different temperatures contribute to the silicate feature
(see Fig. 1 in Schegerer et al. 2006).
However, the dominant contribution for the 10
.
Radiative transfer calculations show that grains of
different temperatures contribute to the silicate feature
(see Fig. 1 in Schegerer et al. 2006).
However, the dominant contribution for the 10
![]() feature
comes from particles with
feature
comes from particles with
![]() K for which the Planck function is
approximately constant in N band. Therefore, we can adopt
that the shape of the feature depends primarily on the emission
properties of grains
K for which the Planck function is
approximately constant in N band. Therefore, we can adopt
that the shape of the feature depends primarily on the emission
properties of grains![]() .
.
The profile of the feature
can be described by the normalised absorption efficiency factor
![]() where the flux at wavelength
where the flux at wavelength ![]() characterises the continuum.
As usual, the value of
characterises the continuum.
As usual, the value of
![]() is chosen
(e.g., Schegerer et al. 2006).
is chosen
(e.g., Schegerer et al. 2006).
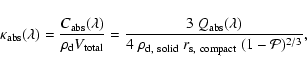
Another representation of the optical behaviour is provided by the
mass absorption coefficient,
which is the ratio of absorption cross section
![]() to particle mass. In the case of a sphere
of porosity
to particle mass. In the case of a sphere
of porosity ![]() ,
it can be written as
,
it can be written as
Figure 1 shows the wavelength dependence of
the normalised absorption efficiency factors for compact silicate
spheres of diverse sizes. With a growth of the particle size (and mass),
the 10
![]() silicate feature broadens, its height decreases
and the position of maximum shifts to longer wavelengths.
silicate feature broadens, its height decreases
and the position of maximum shifts to longer wavelengths.
![\begin{figure}
\par\includegraphics[width=8.5cm,clip]{9697fig1.eps}\end{figure}](/articles/aa/full/2008/19/aa09697-08/img30.gif) |
Figure 1:
Wavelength dependence of the normalised
absorption efficiency factor
[
|
| Open with DEXTER | |
In a similar manner, the silicate feature changes
when the particle porosity grows
(Fig. 2). However, in this case the particle size increases only
moderately, while particle mass remains the same.
With a growth of porosity, the peak strength decreases
for normalised absorption (Fig. 2, upper panel)
whereas the mass absorption coefficient becomes larger
(Fig. 2, lower panel).
The value of
![]() almost doubles at the peak
position when we replace the compact particle by porous particle.
almost doubles at the peak
position when we replace the compact particle by porous particle.
It is well known that the shape and strength of the silicate feature depend on the type of the amorphous silicate, particle size, and fractal dimension (see, e.g., van Boekel et al. 2005; Schegerer et al. 2006; Min et al. 2006). Using the model of composite grains we can also investigate how carbon embedded in particles affects the characteristics of the silicate feature.
![\begin{figure}
\par\includegraphics[width=8.5cm,clip]{9697fig2.eps}\end{figure}](/articles/aa/full/2008/19/aa09697-08/img33.gif) |
Figure 2:
Wavelength dependence of the normalised
absorption efficiency factor ( upper panel) and
mass absorption coefficient ( lower panel)
for layered spheres with
|
| Open with DEXTER | |
![\begin{figure}
\par\includegraphics[width=8.5cm,clip]{9697fig3.eps}\end{figure}](/articles/aa/full/2008/19/aa09697-08/img34.gif) |
Figure 3:
The same as in Fig. 2 ( upper panel) but now
for particles of porosity
|
| Open with DEXTER | |
This dependence is plotted in Fig. 3. With addition of carbon, the feature very rapidly transforms into a plateau and then disappears.
Comparing the data presented in Figs. 1 and 3
with observations, it is possible to estimate
characteristics of grains fitting the observations:
![]() or
or
![]() and
and
![]() (last value is obtained
from Eq. (2) for
(last value is obtained
from Eq. (2) for
![]() ).
Hence the same observational data can be explained with
particles whose radii differ by a factor of
).
Hence the same observational data can be explained with
particles whose radii differ by a factor of ![]() 9 and
masses by a factor of
9 and
masses by a factor of ![]() 8800 (!).
8800 (!).
Using the observations
from Schegerer et al. (2006);
van Boekel et al. (2005);
Sargent et al. (2006); and
Sicilia-Aguilar et al. (2007),
we fitted observational and theoretical profiles of the silicate
feature. We choose the best model by minimising the ![]() criterion.
In all cases, the observational continuum is fitted by a straight
line in the interval
criterion.
In all cases, the observational continuum is fitted by a straight
line in the interval
![]() m for the sake simplicity.
We refer the reader to Juhász et al. (2008) for a
detailed discussion of the physical models of continuum.
We made the calculations
for layered spheres with
m for the sake simplicity.
We refer the reader to Juhász et al. (2008) for a
detailed discussion of the physical models of continuum.
We made the calculations
for layered spheres with
![]() consisting of Be1 and MgFeSiO4.
consisting of Be1 and MgFeSiO4.
![\begin{figure}
\par\includegraphics[width=8.5cm,clip]{9697fig4.eps}\end{figure}](/articles/aa/full/2008/19/aa09697-08/img40.gif) |
Figure 4:
The observational normalised profile of the
10
|
| Open with DEXTER | |
The estimated porosity and amount of carbon in grains producing
the silicate emission feature in protoplanetary discs are collected
in online Table 1.
At this stage, the stars with very pronounced crystalline peaks were
eliminated from consideration.
Table 1 includes 47 stars (30 T Tau and 17 HAeBe stars).
The obtained values of ![]() ,
,
![]() ,
the ratio of masses of carbon to silicate
,
the ratio of masses of carbon to silicate
![]() and stellar age (if known) are given. Note that the determination of the
age is often quite uncertain
for pre-mainsequence stars (see discussion in
Blondel & Tjin A Djie 2006). Therefore, we do not
discuss possible correlations.
and stellar age (if known) are given. Note that the determination of the
age is often quite uncertain
for pre-mainsequence stars (see discussion in
Blondel & Tjin A Djie 2006). Therefore, we do not
discuss possible correlations.
![\begin{figure}
\par\includegraphics[width=8.5cm,clip]{9697fig5.eps}\end{figure}](/articles/aa/full/2008/19/aa09697-08/img42.gif) |
Figure 5:
Wavelength dependence of the
mass absorption coefficient for compact and layered
spheres with
|
| Open with DEXTER | |
The grain porosity exceeds 0.5 and the average value
of ![]() is equal to
is equal to
![]() .
Such particles
resemble aggregates
obtained both experimentally (Kempf et al. 1999) and theoretically
(Shen et al. 2008)
.
Such particles
resemble aggregates
obtained both experimentally (Kempf et al. 1999) and theoretically
(Shen et al. 2008)![]() .
The amount of carbon in grains is not very large
(average volume fraction
.
The amount of carbon in grains is not very large
(average volume fraction
![]() and
average mass ratio
and
average mass ratio
![]() ).
These values increase by a factor of 3-4,
if we replace Be1 by the less absorbing amorphous carbon AC1.
This fact is illustrated in Fig. 4, where the
results are given for both particle materials.
Note that the particles containing AC1 are less porous.
).
These values increase by a factor of 3-4,
if we replace Be1 by the less absorbing amorphous carbon AC1.
This fact is illustrated in Fig. 4, where the
results are given for both particle materials.
Note that the particles containing AC1 are less porous.
The variation of grain porosity
without significant change of grain mass may explain the behaviour
of silicate emission.
This explanation is an alternative to the commonly used idea of
large grains in protoplanetary discs.
We will be able to decide
between the two hypotheses
after conducting spectropolarimetry
in the 10
![]() feature because a noticeable
albedo of large grains manifests itself in
polarisation of the scattered light.
In this case, we expect unusual behaviour of polarisation
parameters (especially positional angle) within the feature
profile in comparison with calculated profiles for dichroic
extinction (see, e.g., Henning & Stognienko 1993;
Prokopjeva & Il'in 2007).
feature because a noticeable
albedo of large grains manifests itself in
polarisation of the scattered light.
In this case, we expect unusual behaviour of polarisation
parameters (especially positional angle) within the feature
profile in comparison with calculated profiles for dichroic
extinction (see, e.g., Henning & Stognienko 1993;
Prokopjeva & Il'in 2007).
Another interesting problem is the degree of crystallinity
of dust in protoplanetary discs, which is related to the processes
of partial grain evaporation and annealing (e.g., Gail 2004).
Due to the conversion of amorphous silicates to crystalline minerals,
the particles may consist of different
types of silicates. In order to show the effect of amorphous
silicate matrix and vacuum on resonances
produced by crystalline silicates, we calculated the
feature profiles for composite particles containing Mg-rich
crystalline olivine Mg1.9Fe0.1SiO4 as a component.
The results are plotted in Fig. 5 where the upper panel
illustrates the influence of particle porosity on position and strength
of emission peaks. It is seen that variations of spectra are
significant: the shape of the feature changes (cf. Fig. 2),
some peaks totally disappear and new peaks arise.
A very pronounced peak with a maximum near
![]() m is observed
for very porous particles whereas
compact and medium-porous particles have
resonances near
m is observed
for very porous particles whereas
compact and medium-porous particles have
resonances near
![]() m.
The inclusion of crystalline silicates in a composite particle
containing amorphous silicate (middle panel) or
amorphous silicate and carbon (lower panel) changes the picture.
The resonance near
m.
The inclusion of crystalline silicates in a composite particle
containing amorphous silicate (middle panel) or
amorphous silicate and carbon (lower panel) changes the picture.
The resonance near
![]() m is clearly seen
at the long-wavelength wing of the feature. Its position slightly
shifts if the porosity changes.
Fabian et al. (2001)
found that such a peak appeared in the spectra of
strongly-elongated particles.
A double peaked structure around
m is clearly seen
at the long-wavelength wing of the feature. Its position slightly
shifts if the porosity changes.
Fabian et al. (2001)
found that such a peak appeared in the spectra of
strongly-elongated particles.
A double peaked structure around
![]() m arises as well.
This structure was not noticed previously in spectra
of crystalline olivines (H. Mutschke, priv. commun., 2007).
Note that, as expected, the mixture of separate constituents
(amorphous silicate, carbon and crystalline silicate,
thick line in lower panel) do not lead to the shift of peaks.
Further calculations with different materials for wider wavelength range
and detailed comparison with Spitzer observations
(see Watson et al. 2007) might help to resolve the
problem of grain
crystallisation in protoplanetary discs and to answer the question
whether the crystals occur in ``isolation'' or as part of porous grains.
m arises as well.
This structure was not noticed previously in spectra
of crystalline olivines (H. Mutschke, priv. commun., 2007).
Note that, as expected, the mixture of separate constituents
(amorphous silicate, carbon and crystalline silicate,
thick line in lower panel) do not lead to the shift of peaks.
Further calculations with different materials for wider wavelength range
and detailed comparison with Spitzer observations
(see Watson et al. 2007) might help to resolve the
problem of grain
crystallisation in protoplanetary discs and to answer the question
whether the crystals occur in ``isolation'' or as part of porous grains.
Acknowledgements
We thank R. van Boekel, A. Schegerer, B. Sargent, M. Honda, and A. Sicilia-Aguilar for sending the observational data in tabular form, H. Mutschke, V. Il'in, S. Korneyev, R. van Boekel, A. Juhász and the anonymous referee for helpful comments and suggestions. The work was partly supported by grants NSh 8542.2006.2, RNP 2.1.1.2152 and RFBR 07-02-00831 of the Russian Federation.
Table 1:
Grain porosity and fractional amount of carbon in grains
as derived from fitting the 10
![]() silicate emission feature.
silicate emission feature.