A&A 481, L41-L44 (2008)
DOI: 10.1051/0004-6361:20078977
Science with Hinode
LETTER TO THE EDITOR
SUMER-Hinode observations of microflares: excitation of molecular hydrogen
D. E. Innes
Max-Planck Institut für Sonnensystemforschung,
37191 Katlenburg-Lindau, Germany
Received 1 November 2007 / Accepted 20 November 2007
Abstract
Context. Concentrations of H2 have been detected by SUMER in active region plage. The H2 is excited by O
 line emission at 1031.94 Å which, although not observed, must be brightening along with the observed transition region line, Si III 1113.24 Å.
Aims. We investigate the excitation of H2 and demonstrate the association between the observed H2 emission and footpoints of X-ray microflares.
Methods. We have made co-ordinated observations of active region plage with the spectrometer SUMER/SoHO in lines of H2 1119.10 Å and Si III 1113.24 Å and with XRT/Hinode X-ray and SOT/Hinode Ca
 filters.
Results. In six hours of observation, six of the seven H2 events seen occurred near a footpoint of a brightening X-ray loop. The seventh is associated with an unusually strong Si III plasma outflow.
Conclusions. Microflare energy dissipation heats the chromosphere, reducing its opacity, so that O
microflare emission is able to reach the lower layers of the chromosphere and excite the H2.
Key words: molecular processes - Sun: activity - Sun: flares - Sun: UV radiation
Solar H2 emission is strong in ultraviolet spectra of
sunspots and has also been seen in flares (Bartoe et al. 1979). In
the quiet Sun it is present but extremely weak (Sandlin et al. 1986).
Here we report the first observations of H2 concentrations in bright
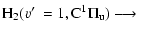
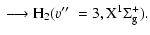
active region plage. The observed H2 line at 1119.10 Å is the 1-3 transition in the Werner series, excited by O
1032 Å (Bartoe et al. 1979; Schühle et al. 1999):
The 1119.10 Å line is about  as bright as the strongest 1-4 Werner line at 1164 Å. The H2 is believed to be formed just above the temperature minimum at around 4200 K.
Its strength is expected to correlate with the
O
intensity, as well as with the chromosphere structure in and above
the H2 region (Jordan et al. 1978).
as bright as the strongest 1-4 Werner line at 1164 Å. The H2 is believed to be formed just above the temperature minimum at around 4200 K.
Its strength is expected to correlate with the
O
intensity, as well as with the chromosphere structure in and above
the H2 region (Jordan et al. 1978).
In this letter, three types of H2 plage events are discussed.
The strongest coincided with ribbon-like Ca
chromospheric brightening at
a footpoint of an X-ray microflare.
The second occurred near the footpoint of a brightening X-ray loop
with no signature in Ca
,
and the third had
neither X-ray emission nor a Ca
signature but very strong
transition region outflow.
All three events highlighted here occurred in three hours
on one of the observing days.
During the second day of observation,
three H2 events were detected in three hours,
and all were associated with X-ray loop brightening
with no Ca
signature.
![\begin{figure}
\par\includegraphics[width=7.6cm,clip]{8977fig1.eps}\end{figure}](/articles/aa/full/2008/13/aa8977-07/Timg9.gif) |
Figure 1:
SUMER spectrum of the region across and around the sunspot,
taken on 29 Apr. 2007 at 02:25 UT. |
| Open with DEXTER |
Hinode (Kosugi et al. 2007) and SUMER (Wilhelm et al. 1995) observed a small active region (AR 10953) on 29 and 30 Apr. 2007. The region had produced several B and one
C class flare four days earlier. All
events during the observing period discussed here were below B class.
On each day, SUMER made six rasters across the plage and sunspot. Each raster took 30 min. The lines observed were H2 1119.10 Å (
 K),
C I multiplet at 1114.39 Å and 1118.41 Å (104 K), Si III 1113.24 Å (
K),
C I multiplet at 1114.39 Å and 1118.41 Å (104 K), Si III 1113.24 Å (
 K), and Ca
 2x557 Å (
 K), where the approximate formation temperatures of the lines are given in brackets.
The spectrum across the sunspot is shown in Fig. 1.
The sunspot is seen predominantly in the H2 line.
K), where the approximate formation temperatures of the lines are given in brackets.
The spectrum across the sunspot is shown in Fig. 1.
The sunspot is seen predominantly in the H2 line.
![\begin{figure}
\par\includegraphics[width=14cm,clip]{8977fig2.eps}\end{figure}](/articles/aa/full/2008/13/aa8977-07/Timg14.gif) |
Figure 2:
The six raster scans taken in H2 and Si III, and the equivalent
X-ray time-slice rasters. The X-ray rasters are constructed by stacking, for each SUMER observation, the cospatial XRT slices
from the XRT Ti-poly images closest in time. The difference images are
computed by subtracting the preceding XRT Ti-poly image. The plage H2 brightenings (labelled I, II, III)
are circled in the H2, Si III, and top X-ray difference raster. The H2 contours are at
 photons s-1 m-2 sr-1, and Si III contours are at 1.2 photons s-1 m-2 sr-1. All images have a linear intensity scale.
The sun-x and sun-y co-ordinates are as in Fig. 3. photons s-1 m-2 sr-1, and Si III contours are at 1.2 photons s-1 m-2 sr-1. All images have a linear intensity scale.
The sun-x and sun-y co-ordinates are as in Fig. 3. |
| Open with DEXTER |
Hinode made simultaneous observations with the X-Ray Telescope
(XRT; Golub et al. 2007)
through both the Ti-poly and
Al-thick filters with 1.5 min cadence.
Observations through both the Ca
and G-band filters
were made with the Broadband Filter Imager
of the Solar Optical Telescope
(SOT; Tsuneta et al. 2007)
with a 1 min cadence. The Extreme ultraviolet Imaging Spectrometer
(EIS; Culhane et al. 2007) observed Fe
 284.25 Å (
 K),
using the wide 266
K),
using the wide 266
 slit and
15 s cadence. To obtain the coalignment between the X-ray images and SUMER,
the EIS images were very useful because they bridged the gap between
SOT Ca
and XRT. In particular, during the strongest microflare
event, EIS captured both the X-ray loop seen with XRT and the ribbon-like footpoint
structure seen in the
SOT Ca
images. This provided the SOT, XRT, and EIS coalignment.
The SUMER-SOT coalignment was made by comparing SOT
G-band and SUMER H2 images. Additional checks were done by comparing SUMER
Si III and EIS Fe
.
The coalignment between SUMER and XRT
is believed to be better than 5
,
with greater accuracy in the
north-south (sun-y) direction.
slit and
15 s cadence. To obtain the coalignment between the X-ray images and SUMER,
the EIS images were very useful because they bridged the gap between
SOT Ca
and XRT. In particular, during the strongest microflare
event, EIS captured both the X-ray loop seen with XRT and the ribbon-like footpoint
structure seen in the
SOT Ca
images. This provided the SOT, XRT, and EIS coalignment.
The SUMER-SOT coalignment was made by comparing SOT
G-band and SUMER H2 images. Additional checks were done by comparing SUMER
Si III and EIS Fe
.
The coalignment between SUMER and XRT
is believed to be better than 5
,
with greater accuracy in the
north-south (sun-y) direction.
![\begin{figure}
\par\includegraphics[width=8.2cm,clip]{8977fig3.eps}\end{figure}](/articles/aa/full/2008/13/aa8977-07/Timg18.gif) |
Figure 3:
SUMER raster images of H2 ( top row) and, below, the XRTTi-poly difference images at the time of the H2 brightenings. |
| Open with DEXTER |
The six rasters taken on 30 Apr. 2007 are shown as a time series in
Fig. 2. Here, the sunspot is the bright H2 region on the right of each raster. The linear intensity scale used to display the images
accentuates the few plage brightenings, both in the H2 and the Si III images. The three brightest H2 concentrations are
circled and labelled I, II, III.
Each H2 concentration coincides with intense Si III, but the inverse is
not true. Not all Si III brightenings are associated with H2.
The relationship between
the H2 and X-ray brightenings is shown in the third row of Fig. 2.
![\begin{figure}
\par\includegraphics[width=13.5cm,clip]{8977fig4.eps}\end{figure}](/articles/aa/full/2008/13/aa8977-07/Timg19.gif) |
Figure 4:
SUMER spectral images and profiles of the H2 brightenings. The Si III intensity is reduced by a factor 20 compared to the rest of the spectrum, so that they can be displayed with the same scale.
Each H2 spectrum is compared to the average plage spectrum, which has
been scaled so that their continua at 1116 Å match. |
| Open with DEXTER |
The two strongest H2 events,
II and III, are associated with X-ray brightenings. Unfortunately,
the X-ray brightening at II is exaggerated by a data gap.
Its brightening is seen better in
the XRT difference images displayed in Fig. 3.
Event III was much the brightest X-ray event during the observing period.
This is the event, mentioned previously, that coincided with a small, bright
ribbon-like structure seen in Ca
images.
Close inspection of the X-ray difference rasters reveals additional X-ray
brightenings, labelled A, B, and C in the third row of Fig. 2.
Event B is associated with weak H2 and Si III, and A and C only with weak
Si III.
The SUMER spectra of the circled events (I, II, and III) are shown in
Fig. 4. There is no simple relationship
between the Si III strength and the H2. In each case the H2 strength is
1-1.5 DN, whereas the Si III varies by a factor of three. It is
noticeable that the Si III emission is generally broader. In event II, it is offset by
 from the H2.
The H2 intensity depends on both the strength of the O
and the
atmospheric opacity between the O
and H2 layers. If the O
follows
the Si III brightness, then an increase in transition region emission cannot
be the only reason for enhanced H2 excitation, because there are several examples
of bright Si III and no observed H2. The analyses by Jordan et al. (1978) and Bartoe et al. (1979)
of H2 in a sunspot and quiet Sun led them to conclude that the opacity over
the sunspot is about an order of magnitude less than in the quiet Sun. This
suggests a similar explanation for the H2 concentrations in bright plage
because energy dissipation at X-ray loop footpoints is commonly associated with
chromospheric evaporation, and the two strongest events discussed here
and all three
events seen on 29 April 2007 were associated with
X-ray loop brightening. The one event not associated with X-ray
brightening showed significant plasma outflow from the transition region.
If chromospheric evaporation due to high-energy particles
accelerated in the microflare reduces the opacity of the chromosphere,
one might expect to find a relationship between the X-ray emission and the
H2. This is not confirmed by the observations presented here, but this could
be because the observed H2 strength depends critically
on the position of the loop footpoint in relation to the SUMER field-of-view
at the time of the brightening. The reason more Si III and X-ray
coincidences occur is probably because Si III brightenings come from higher
up in the atmosphere and cover a larger area, and not just from the loop footpoint.
Future observations with SUMER will measure the O
1032 Å and H2 intensities almost simultaneously. This, together with extended SOT observations
and analysis of the chromospheric dynamics,
will help determine the extent and influence of opacity changes on the H2 intensity.
Acknowledgements
I would like to thank Maria Madjarska for her constructive comments and
careful reading of this letter.
Hinode is a Japanese mission developed and launched by ISAS/JAXA,
collaborating with NAOJ, as domestic partner, and NASA (USA) and STFC (UK)
as international partners. Scientific operation of the Hinode mission is
conducted by the Hinode science team organized at ISAS/JAXA.
Support for the postlaunch operation is provided by JAXA and NAOJ, STFC,
NASA, ESA (European Space Agency), and NSC (Norway).
SUMER is financially supported by DLR, CNES, NASA, and the ESA PRODEX program
(Swiss contribution). SoHO is a project of international co-operation between
ESA and NASA.
We are grateful to all teams for their efforts in the design, building, and
operation of the Hinode and SoHO missions.
- Bartoe,
J.-D. F., Brueckner, G. E., Nicolas, K. R.,
et al. 1979, MNRAS, 187, 463 [NASA ADS]
(In the text)
- Culhane,
J. L., Harra, L. K., James, A. M., et al. 2007,
Sol. Phys. 243, 60
(In the text)
- Golub, L., Deluca,
E., Austin, G., et al. 2007, Sol. Phys., 243, 63 [NASA ADS] [CrossRef]
(In the text)
- Jordan, C.,
Brueckner, G. E., Bartoe, J.-D. F., Sandlin, G. D.,
& Vanhoosier, M. E. 1978, ApJ, 226, 687 [NASA ADS] [CrossRef]
(In the text)
- Kosugi, T.,
Matsuzaki, K., Sakao, T., et al. 2007, Sol. Phys. 243,
118
(In the text)
- Sandlin,
G. D., Bartoe, J.-D. F., Brueckner, G. E., Tousey,
R., & Vanhoosier, M. E. 1986, ApJS, 61, 801 [NASA ADS] [CrossRef]
(In the text)
- Schühle,
U., Brown, C. M., Curdt, W., & Feldman, U. 1999, in ESA
Special Publication, Vol. 446, 8th SOHO Workshop: Plasma Dynamics
and Diagnostics in the Solar Transition Region and Corona, ed.
J.-C. Vial & B. Kaldeich-Schü, 617
- Tsuneta, S.,
Ichimoto, K., Katsukawa, Y., et al. 2007,
[arXiv:711.1715]
(In the text)
- Wilhelm, K., Curdt,
W., Marsch, E., et al. 1995, Sol. Phys., 162, 189 [NASA ADS] [CrossRef]
(In the text)
Copyright ESO 2008


![\begin{figure}
\par\includegraphics[width=7.6cm,clip]{8977fig1.eps}\end{figure}](/articles/aa/full/2008/13/aa8977-07/img9.gif)
![\begin{figure}
\par\includegraphics[width=14cm,clip]{8977fig2.eps}\end{figure}](/articles/aa/full/2008/13/aa8977-07/img14.gif)
![\begin{figure}
\par\includegraphics[width=8.2cm,clip]{8977fig3.eps}\end{figure}](/articles/aa/full/2008/13/aa8977-07/img18.gif)
![\begin{figure}
\par\includegraphics[width=13.5cm,clip]{8977fig4.eps}\end{figure}](/articles/aa/full/2008/13/aa8977-07/img19.gif)