A&A 480, 825-838 (2008)
DOI: 10.1051/0004-6361:20078409
C. Beck1,2
1 - Instituto de Astrofísica de Canarias
(CSIC),Via Lactea, 38205 La Laguna, Tenerife, Spain
2 - Kiepenheuer-Institut für Sonnenphysik,
Schöneckstr. 6, 79104 Freiburg, Germany
Received 3 August 2007 / Accepted 30 November 2007
Abstract
Aims. I deduced a 3D sunspot model that is in full agreement with spectropolarimetric observations, in order to address the question of a possible penumbral heating process by the repetitive rise of hot flow channels.
Methods. I performed inversions of spectropolarimetric data taken simultaneously in infrared (1.5![]() m) and visible (630 nm) spectral lines. I used two independent magnetic components inside each pixel to reproduce the irregular Stokes profiles in the penumbra and studied the averaged and individual properties of the two components. By integrating the field inclination to the surface, I developed a 3D model of the spot from inversion results without intrinsic height information.
m) and visible (630 nm) spectral lines. I used two independent magnetic components inside each pixel to reproduce the irregular Stokes profiles in the penumbra and studied the averaged and individual properties of the two components. By integrating the field inclination to the surface, I developed a 3D model of the spot from inversion results without intrinsic height information.
Results. I find that the Evershed flow is harbored by the weaker of the two field components. This component forms flow channels that show upstreams in the inner and mid penumbra, continue almost horizontally as slightly elevated loops throughout the penumbra, and finally bend down in the outer penumbra. I find several examples where two or more flow channels are found along a radial cut from the umbra to the outer boundary of the spot.
Conclusions. I find that a model of horizontal flow channels in a static background field is in good agreement with the observed spectra. The properties of the flow channels correspond very well to the moving tube simulations of Schlichenmaier et al. (1998, A&A, 337, 897). From the temporal evolution in intensity images and the properties of the flow channels in the inversion, I conclude that interchange convection of rising hot flux tubes in a thick penumbra still seems a possible mechanism for maintaining the penumbral energy balance.
Key words: Sun: magnetic fields - Sun: sunspots
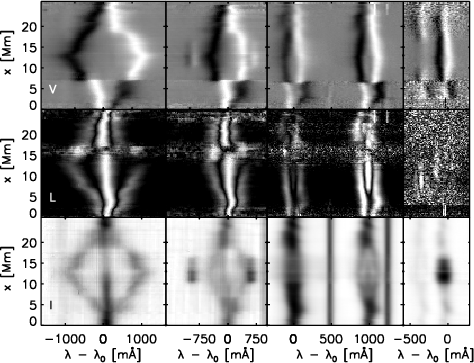 |
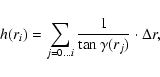
Figure 1: Stokes profiles along the symmetry line connecting spot center and disc center. The limb side is down, the center side up. Bottom row: intensity, I. Middle row: total linear polarization, L. Top row: circular polarization, V. Left to right: IR spectral lines at 1564.8 nm, 1565.2 nm, visible lines at 630.15 nm, 630.25 nm, and Ti I at 630.37 nm. |
| Open with DEXTER | |
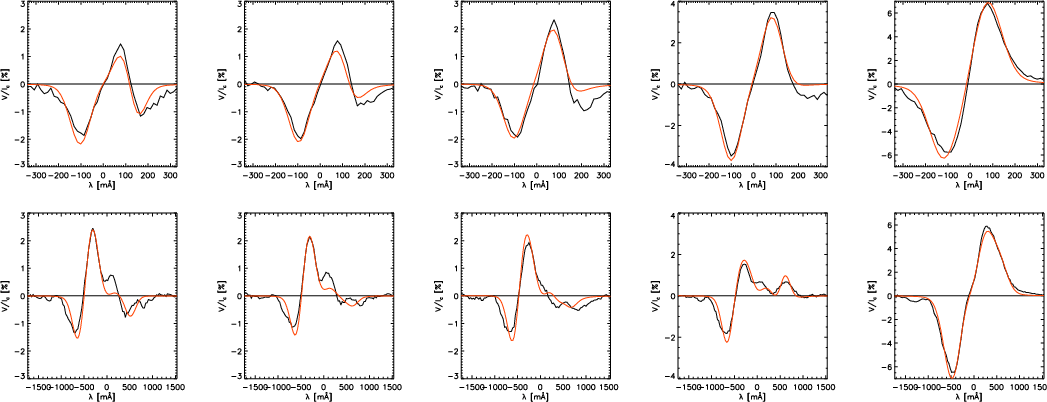 |
Figure 2: Examples of Stokes V profiles in the neutral line. Top row: Stokes V of the Fe I line at 630.15 nm. Bottom row: the co-spatial profiles of Fe I at 1564.8 nm. The red line gives the corresponding best-fit profile of the inversion. The last column shows a profile in the center side penumbra. |
| Open with DEXTER | |
Using spectropolarimetric observations of sunspots, the information content
of the observations was extended to encompass both the magnetic field topology
and the flow fields at the same time. The problem of the penumbral fine
structure, however, was not resolved by this, but became still more complex. The
Evershed flow could be shown to be close to horizontal, but the average
magnetic field turned out not to be
(e.g. Bellot Rubio et al. 2003). A possible explanation for the mismatch between flow and field direction in an ionized
plasma is the assumption that, at the spatial resolution of around
1
![]() ,
achieved in current spectropolarimetric observations, two
different magnetic field components are seen inside the same pixel. These two
components have a different topology and flow field each.
,
achieved in current spectropolarimetric observations, two
different magnetic field components are seen inside the same pixel. These two
components have a different topology and flow field each.
One way to visualize this is to make a cut along the
symmetry line of a sunspot, the line that passes from disc center across the
spot center towards the closest solar limb position (Collados 2002; Bellot Rubio et al. 2004). Figure 1 shows
profiles of intensity, total linear polarization,
![]() ,
and
circular polarization (Stokes V) along the symmetry line for one of the observations analyzed in the
present study. Both circular and linear polarizations show a neutral line on
the limb side and center side, respectively. At the location of these neutral
lines, the profile shape changes abruptly. On the limb side across the neutral
line of Stokes V, stronger fields with smaller line shifts turn into weaker
fields with larger line shifts. On the center side across the neutral line of
L, the same change is seen from strong fields with slower flows to weaker fields with stronger flows.
,
and
circular polarization (Stokes V) along the symmetry line for one of the observations analyzed in the
present study. Both circular and linear polarizations show a neutral line on
the limb side and center side, respectively. At the location of these neutral
lines, the profile shape changes abruptly. On the limb side across the neutral
line of Stokes V, stronger fields with smaller line shifts turn into weaker
fields with larger line shifts. On the center side across the neutral line of
L, the same change is seen from strong fields with slower flows to weaker fields with stronger flows.
More direct evidence of these multiple magnetic field components is given by
the Stokes V profiles close to or within the neutral line of V(Fig. 2) on the limb side. The neutral line indicates a local minimum of the Stokes V signal amplitude, because most of the field lines are
perpendicular to the line of sight (LOS). In magnetograms, the retrieved signal
passes through zero in the neutral line, because the polarity of the
magnetic field changes, e.g. from positive to negative, but the
V signal does not disappear completely in spectra due to the multi-component
penumbral structure (cf. Schlichenmaier & Collados 2002). These profiles in the neutral line show not only two ![]() -components in
the circular polarization signal, but several local extrema (both minima and
maxima). To generate such complex patterns, the magnetic field has to be
complex as well. Appendix A shows how such complex profiles can be created by the addition of two regular Stokes V profiles with opposite polarities. This simple addition of profiles, however, does not tell whether the
two magnetic field components leading to the V profiles are actually located in the same pixel. If the spatial resolution of the polarimetric observations is insufficient for separating the flow filaments seen in high-resolution observations from their surroundings, field components from two different spatial locations would be added up.
-components in
the circular polarization signal, but several local extrema (both minima and
maxima). To generate such complex patterns, the magnetic field has to be
complex as well. Appendix A shows how such complex profiles can be created by the addition of two regular Stokes V profiles with opposite polarities. This simple addition of profiles, however, does not tell whether the
two magnetic field components leading to the V profiles are actually located in the same pixel. If the spatial resolution of the polarimetric observations is insufficient for separating the flow filaments seen in high-resolution observations from their surroundings, field components from two different spatial locations would be added up.
There is, however, an indicator that suggests that the field components are not spatially separated in the horizontal dimensions, but vertically interlaced, the net circular polarization (NCP). A non-zero value of NCP - as observed in the penumbra of sunspots (e.g. Müller et al. 2002; Solanki & Montavon 1993; Sánchez Almeida & Lites 1992; Martínez Pillet 2000, 2006) - indicates discontinuities, or at least strong gradients of field properties, along the line of sight inside the formation height of spectral lines.
Most of the observed properties of profiles in the penumbra of sunspots can be explained with the uncombed penumbra model suggested by Solanki & Montavon (1993). In this model, a more vertical field component winds around horizontal flow channels, which carry the Evershed flow. The success of this model is related to its being able to explain the most prominent peculiarities of sunspots: a horizontal flow field in a non-horizontal field topology, the appearances of neutral lines in total linear polarization, L, and Stokes V, and the NCP. However, the model itself gives no explanation, why its specific topology should exist in the penumbra. The simulations of Schlichenmaier et al. (1998) show that such a configuration of embedded flow channels results from the temporal evolution of magnetic flux initially located at the boundary layer between the sunspot and the field-free surroundings. Thomas & Weiss (2004) suggest that turbulent convection outside the spot pulls down field lines and thus produces the filamentary structure of the sunspot. In both cases, the penumbra consists of similar embedded flow channels, but created by different mechanisms. Spruit & Scharmer (2006) and Scharmer & Spruit (2006) have recently suggested a completely different model where the intensity filaments are related to the existence of field-free gaps below the visible surface layer.
In this paper, I want to show that a rather simple uncombed model using two depth-independent magnetic components is sufficient for reproducing simultaneous observations in infrared and visible spectral lines with their different responses to magnetic fields. The inversion setup is described after the observations and data reduction (Sect. 2). I study average field properties and their radial variation in Sect. 4 and then deduce a geometrical model of the sunspot by integrating the surface inclination of the fields (Sect. 5). The physical properties of the model, such as field strength, velocity, or field orientation, correspond to the best-fit model atmospheres needed to reproduce the observed spectra. I briefly investigate the temporal evolution in Sect. 6, with emphasis on which parts change with time and which do not. In the discussion (Sect. 7), I address the question of penumbral heat transport in the context of the results of the previous analysis. Appendix A shows how complex profiles can be created with simple assumptions. Appendix B shows an example of the integration along a single cut through the penumbra and the full 3D model from different viewing angles. Appendix C describes the analysis of a time series of speckle-reconstructed G-band images used to derive the characteristic time scale of penumbral intensity variations.
I used a simple inversion setup with field properties constant
with optical depth, corresponding to a horizontal separation of the field
components. A more sophisticated setup, taking the variations along the line of sight into account, is planned for discussion in a forthcoming paper.
| |
Figure 3: Continuum intensity maps of NOAA 10425 in the near infrared on 2003 August 7 ( left) and August 9 ( right). The distance between tick marks is 1 arcsec. |
| Open with DEXTER | |
Table 1: Spectral lines observed with POLIS ( top) and TIP ( bottom).
An integration time of around 3.5 s was used for each slit position. The slit width was 0  |
Figure 4: Comparison of the observed (+) and best-fit profiles ( solid line) for one spatial position in the neutral line of Stokes V. Left to right: IR lines at 1564.8 nm and at 1565.2 nm; visible lines at 630.15 nm, 630.25 nm, and 630.37 nm. Top to bottom: Stokes IQUV as a fraction of the continuum intensity. The black vertical lines mark the zero wavelength of the respective wavelength scales. The dispersion on the x-axis is in mÅ for all spectra. |
| Open with DEXTER | |
The data alignment was done in the same way as described in detail in Beck (2006) or the Appendix of Beck et al. (2007). The wavelength scale was also set up like in the latter, with the blue-shift values predicted by the quiet Sun (QS) model of Borrero & Bellot Rubio (2002) as a reference. The Stokes profiles of each spectral range were normalized to the continuum intensity of the quiet Sun at disk center in a two-step procedure. An average QS profile for each wavelength range was calculated from pixels located outside the sunspot. This profile was normalized to unity with its respective average continuum intensity. The off-center position was taken into account by multiplying the QS profile and all other profiles with the appropriate limb-darkening coefficient.
All model atmospheres were prescribed as a function of continuum
optical depth, ![]() ,
in the range
,
in the range
![]() to -4. For the
initial temperature stratification, I always adopted the HSRA
model (Gingerich et al. 1971). Temperature was allowed to be varied with two nodes;
i.e., perturbations of the initial model atmosphere with a straight line of arbitrary
slope were possible. A contribution of stray light to the observed profiles was
also always allowed for; as proxy for the stray light profile the average QS
profile was used.
to -4. For the
initial temperature stratification, I always adopted the HSRA
model (Gingerich et al. 1971). Temperature was allowed to be varied with two nodes;
i.e., perturbations of the initial model atmosphere with a straight line of arbitrary
slope were possible. A contribution of stray light to the observed profiles was
also always allowed for; as proxy for the stray light profile the average QS
profile was used.
I employed a two-component inversion with one magnetic and one field-free component for pixels outside the sunspot with significant polarization signal. The free parameters of the
field-free component were the temperature T and LOS
velocity v. For the magnetic atmosphere component, additional parameters were the field strength B, the LOS inclination ![]() ,
and the azimuth of the
field in the plane perpendicular to the LOS
,
and the azimuth of the
field in the plane perpendicular to the LOS ![]() .
Except for temperature, all atmospheric parameters were assumed to be constant with optical
depth. The spectra, whose polarization degree was below the threshold, were not inverted. I assumed a single magnetic component in the
umbra. For all pixels in the penumbra, the inversion setup used two independent magnetic components in each
pixel. The macroturbulent velocity was the only parameter that was forced
to be equal in both components. All quantities besides T were again constant with depth.
.
Except for temperature, all atmospheric parameters were assumed to be constant with optical
depth. The spectra, whose polarization degree was below the threshold, were not inverted. I assumed a single magnetic component in the
umbra. For all pixels in the penumbra, the inversion setup used two independent magnetic components in each
pixel. The macroturbulent velocity was the only parameter that was forced
to be equal in both components. All quantities besides T were again constant with depth.
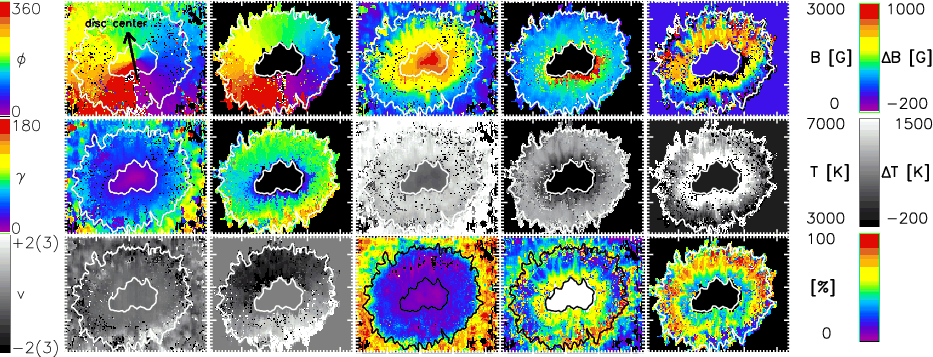 |
Figure 5: Top row, left to right: magnetic field azimuth of the background component (bg), field azimuth of the flow-channel component (fc), field strength of bg, field strength of fc, and difference of the field strengths (bg-fc). Middle row, left to right: field inclination of bg and fc, temperature of bg and fc, difference of temperatures (bg-fc). Bottom row, left to right: LOS velocity of bg and fc, stray light contribution, filling fraction of bg and fc. Inclination and azimuth are given in the LRF frame; velocities are in km s-1 with negative velocities pointing towards the observer. The velocity limits in parentheses refer to the fc component. White contour lines denote the inner and outer boundary of the penumbra. The black arrow in the azimuth map points towards disc center. |
| Open with DEXTER | |
For SIR, the two inversion components are fully equivalent, because the changes applied to their initial model atmospheres are only driven by the need to minimize the deviation between observed and synthetic profiles. In the inversion of the spectra of neighboring pixels, the roles of the two inversion components may thus be exchanged; i.e., component 1 may show a high flow velocity and component 2 is at rest in one case, whereas on the next pixel it is the opposite. The results of the inversion must thus be sorted somehow to provide a smooth spatial variation. I used the inclination to the surface as the criterion for separating the two inversion components into different maps: the more vertical component of each pixel is assumed to be the static background (bg) field of the spot, and the more inclined component to be the flow channels (fc). This selection by a single criterion can lead to ambiguities, when the inclination of the two components is similar. Near the umbra-penumbra boundary, the field inclinations of the two components were nearly identical for both observations of the sunspot (cf. Beck 2006, Fig. 5.14). In this area, I modified the criterion and used the temperature of the components: the hotter component was chosen to be the bg component, the cooler one the fc. This yielded smooth temperature maps, which otherwise showed clear indications that the identification of the components by inclination was wrong.
Figure 4 shows an example of observed and best-fit profiles for
one location on the neutral line of Stokes V. The weak Fe I line at 630.35 nm has been left out in the graphs to save some room. The inversion is not able to reproduce asymmetric profiles, and thus fails to retrieve the observed
profiles down to the finest details (e.g., Stokes Q and U of the visible
lines); however, it still catches the overall shape of the profiles quite well. Especially in Stokes V, one and the same atmosphere leads to strongly
differing profiles in, e.g., 1564.8 nm and 630.15 nm. The good agreement of observed and best-fit profiles in both wavelength
ranges using constant field properties is related to the only small
difference in formation height between the IR and visible
lines. Cabrera Solana et al. (2005) studied the properties of several
photospheric lines and conclude that the formation height
difference between the 1.56 ![]() lines and those at 630 nm is less than
100 km. The profiles shown in Fig. 4 have a non-zero NCP, which is not reproduced by the best-fit profiles. Even if the observed sunspot has a non-zero NCP with different behavior in IR and visible spectral lines (Müller et al. 2006), the main information
contained in the spectra is at first the average properties of the
magnetic field such as field strength. The NCP then
yields information on the variation along the LOS, but always around the average value. In Beck (2006), I found that the analysis of the same data
set using an uncombed inversion model yielded almost identical average field
properties; i.e., field strength or field orientation were not
influenced by the choice of the inversion setup with or without reproduction
of the NCP. This does not come as a surprise, because the inversion with
constant magnetic field properties already reproduces the observed (complex)
spectra fairly well (cf. Figs. 2 and 4).
lines and those at 630 nm is less than
100 km. The profiles shown in Fig. 4 have a non-zero NCP, which is not reproduced by the best-fit profiles. Even if the observed sunspot has a non-zero NCP with different behavior in IR and visible spectral lines (Müller et al. 2006), the main information
contained in the spectra is at first the average properties of the
magnetic field such as field strength. The NCP then
yields information on the variation along the LOS, but always around the average value. In Beck (2006), I found that the analysis of the same data
set using an uncombed inversion model yielded almost identical average field
properties; i.e., field strength or field orientation were not
influenced by the choice of the inversion setup with or without reproduction
of the NCP. This does not come as a surprise, because the inversion with
constant magnetic field properties already reproduces the observed (complex)
spectra fairly well (cf. Figs. 2 and 4).
Prior to further analysis, the inversion results were transformed from the
LOS reference frame into the local reference frame (LRF). The LRF is defined
such that z corresponds to the surface normal and increases with height, while
the x-axis points from the center of the spot towards the disc center. The
180![]() azimuth ambiguity was resolved by assuming a radial field
orientation inside the sunspot, and thus always choosing the azimuth solution
closer to radial orientation.
azimuth ambiguity was resolved by assuming a radial field
orientation inside the sunspot, and thus always choosing the azimuth solution
closer to radial orientation.
Figure 5 shows the resulting field azimuth and inclination to the
surface normal. Only the results of the observation on August 9 at
30![]() are shown here and in the following, as the other observation
yielded similar results. The two inversion components have been
separated by the criteria described in the previous section. There is an
easy way to control whether the selection is reasonable. The component selected
as ``flow'' channels should also exhibit significant flow velocities. And indeed this is the case:
the fc component shows LOS velocities up to some km s-1, whereas the bg component is almost at rest
(cf. bottom row of Fig. 5). This gives confidence that the other quantities from the inversion can really be ascribed to ``flow channels'' and a ``background component''.
are shown here and in the following, as the other observation
yielded similar results. The two inversion components have been
separated by the criteria described in the previous section. There is an
easy way to control whether the selection is reasonable. The component selected
as ``flow'' channels should also exhibit significant flow velocities. And indeed this is the case:
the fc component shows LOS velocities up to some km s-1, whereas the bg component is almost at rest
(cf. bottom row of Fig. 5). This gives confidence that the other quantities from the inversion can really be ascribed to ``flow channels'' and a ``background component''.
Figure 5 also shows that the bg component is
stronger almost throughout the whole penumbra, whereas the field strength becomes comparable at the outer boundary. The patch of increased field
strength in the fc component (red color) below and right of the umbra near
its boundary to the penumbra is co-spatial to the locations, where the field
inclinations of the two components were nearly identical. The strong
difference to the field strength further radially outwards could
indicate that no clear signatures of two
magnetic components were present in the spectra of these locations. The temperature maps (at
![]() )
in the middle row show the bg component to be hotter than the flow
channels throughout the whole penumbra. The stray light contribution to the best-fit profiles increases from 10
% in the umbra to 15% in the penumbra, and strongly increases at the outer
spot boundary. Inside the penumbra, flow channels and bg component have a
comparable filling fraction of around 50%.
)
in the middle row show the bg component to be hotter than the flow
channels throughout the whole penumbra. The stray light contribution to the best-fit profiles increases from 10
% in the umbra to 15% in the penumbra, and strongly increases at the outer
spot boundary. Inside the penumbra, flow channels and bg component have a
comparable filling fraction of around 50%.
Radially oriented structures (``spines'', Lites et al. 1993) can be seen on the center side in the bg components' field strength, in the fc temperature, and in the relative filling fraction of the bg component. The spines start with locally enhanced field strength of the bg component in the umbra, and maintain stronger and less inclined fields throughout the penumbra. The filling fraction of the fc component inside the spines is only 50%, compared to about 70% outside the spines. This indicates that the Evershed motion may be (at least partially) suppressed in the spine areas. Their continuum intensity is reduced mainly in the inner penumbra, while in the outer part the spines are less prominent in intensity.
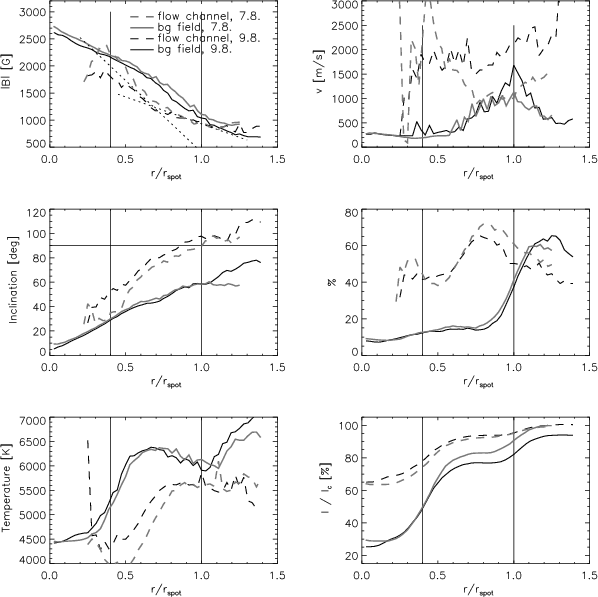 |
Figure 6:
Left column, top to bottom: radial variation of B, LRF
inclination, temperature at log |
| Open with DEXTER | |
The field strength and field inclination of both observations are similar, indicating little change in the sunspot field topology in two
days. In both observations, the bg component is stronger by 0.5 kG in the
inner and middle penumbra, whereas at the outer boundary the strength of both components is nearly identical. The slope with radius of the fc field strength
decreases in the mid penumbra at
![]() (dotted lines), but the field strength continues to drop with radius in both bg component and flow channels. The inclination of the fc component on average exceeds 90
(dotted lines), but the field strength continues to drop with radius in both bg component and flow channels. The inclination of the fc component on average exceeds 90![]() for
for
![]() ,
whereas the bg component never turns into horizontal fields. Its maximum inclination at the outer penumbral boundary is close to 60
,
whereas the bg component never turns into horizontal fields. Its maximum inclination at the outer penumbral boundary is close to 60![]() .
.
The temperature plot in the lower left panel shows that the radial variation of the temperature in the bg component follows the radial curve of intensity closely. The temperature curve of the fc component has a similar shape with reduced amplitude, but is displaced towards the outer penumbral boundary relative to the intensity or bg temperature curve. The decrease in the temperature in both components at the outer penumbral boundary is presumably connected to a trade-off between stray light and temperature in the inversion. At the outer boundary, the intensity level and shape of the profiles allows to use a larger stray light amount to reproduce the observed spectra, whereas in the umbra and penumbra the QS profile simply does not fit to the spectra. These results are in good agreement with the findings of Borrero et al. (2004) or Bellot Rubio et al. (2004), both in the absolute values of, e.g., field strength or field inclination and in their radial variation.
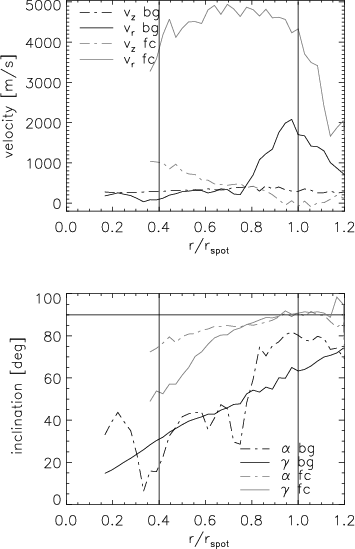 |
Figure 7:
Top: horizontal and vertical velocities for both inversion
components. Black: bg component. Grey: fc component.
Dashed: vertical velocity. Solid: horizontal velocity.
Bottom: field inclination, |
| Open with DEXTER | |
With the assumption that on large spatial scales the flow velocities in the
penumbra are only due to the radially aligned Evershed flow, the LOS
velocity can be decomposed into its horizontal,
![]() ,
and vertical component, vz(r) (e.g. Schlichenmaier & Schmidt 2000; Bellot Rubio et al. 2004,2003). This allows to derive the flow angle,
,
and vertical component, vz(r) (e.g. Schlichenmaier & Schmidt 2000; Bellot Rubio et al. 2004,2003). This allows to derive the flow angle, ![]() ;
i.e., the inclination of the flow direction to the surface at a given radius. The flow angle can be derived separately for each inversion component, and then be directly compared to the average field inclination of the component,
;
i.e., the inclination of the flow direction to the surface at a given radius. The flow angle can be derived separately for each inversion component, and then be directly compared to the average field inclination of the component, ![]() .
Figure 7 displays the corresponding results for the observation on August 9. The fc component shows upflows of around 1 km s-1 (vz > 0) in the
innermost penumbra, which turn into nearly horizontal flows with constant 4.6 km s-1 throughout the whole penumbra and finally exhibit a small downflow
component for
.
Figure 7 displays the corresponding results for the observation on August 9. The fc component shows upflows of around 1 km s-1 (vz > 0) in the
innermost penumbra, which turn into nearly horizontal flows with constant 4.6 km s-1 throughout the whole penumbra and finally exhibit a small downflow
component for
![]() .
The bg component shows a significant LOS velocity near the outer penumbral boundary, which could also be
seen already in the azimuthal averages of Fig. 6. Bellot Rubio et al. (2004) point out that this non-zero velocity of the bg component is a necessary ingredient for correctly predicting the sign of the net circular polarization in the center side. The lower panel of Fig. 7 displays that the flows in the flow channels are parallel to the field inclination to a high degree in the outer penumbra. In the inner penumbra and for the bg component, the agreement is worse, but this may also be due to the intrinsic inaccuracies of the method. The azimuthal fine structure of dark and bright filaments is ignored by assuming that the absolute flow velocity
.
The bg component shows a significant LOS velocity near the outer penumbral boundary, which could also be
seen already in the azimuthal averages of Fig. 6. Bellot Rubio et al. (2004) point out that this non-zero velocity of the bg component is a necessary ingredient for correctly predicting the sign of the net circular polarization in the center side. The lower panel of Fig. 7 displays that the flows in the flow channels are parallel to the field inclination to a high degree in the outer penumbra. In the inner penumbra and for the bg component, the agreement is worse, but this may also be due to the intrinsic inaccuracies of the method. The azimuthal fine structure of dark and bright filaments is ignored by assuming that the absolute flow velocity
![]() only depends on radius. Given these limitations, I think that the result supports the concept of field-aligned flows: upflows (downflows) are seen where the magnetic field inclination is below (above) 90
only depends on radius. Given these limitations, I think that the result supports the concept of field-aligned flows: upflows (downflows) are seen where the magnetic field inclination is below (above) 90![]() .
.
To investigate the radial structure of the fields without spatial averaging, I took the values of several quantities along a single column of the 2D maps at around 0![]() field azimuth. Figure 8 shows this column and its
surroundings. A hot upstream is
located at about the middle of the penumbra. It has a strong signature in most quantities along the cut shown in
Fig. 9. The LOS velocity in the fc component
drops from 2 km s-1 farther inwards to slightly below zero and it takes around 2 Mm to speed up again. The same is seen in the line-core
velocity of Ti I. The inclination of the field is reduced from
88
field azimuth. Figure 8 shows this column and its
surroundings. A hot upstream is
located at about the middle of the penumbra. It has a strong signature in most quantities along the cut shown in
Fig. 9. The LOS velocity in the fc component
drops from 2 km s-1 farther inwards to slightly below zero and it takes around 2 Mm to speed up again. The same is seen in the line-core
velocity of Ti I. The inclination of the field is reduced from
88![]() to 55
to 55![]() ,
but jumps to around 77
,
but jumps to around 77![]() on the next pixel (
on the next pixel (![]() 0
0
![]() 37) already. Rimmele (2004) and Rimmele & Marino (2006) also find a rapid change of upflows into horizontal outflows on scales of around 0
37) already. Rimmele (2004) and Rimmele & Marino (2006) also find a rapid change of upflows into horizontal outflows on scales of around 0
![]() 6. The temperature of the fc component increases by around 1000 K at the upstream location. In the continuum intensity, an increase is seen near the
upstream, but displaced outwards by 1 Mm. Several similar hot upstreams in the
mid penumbra with a change in temperature, flow velocity, and field inclination
can be seen in Fig. 8; two examples near the left and right borders of the section shown are highlighted by arrows.
6. The temperature of the fc component increases by around 1000 K at the upstream location. In the continuum intensity, an increase is seen near the
upstream, but displaced outwards by 1 Mm. Several similar hot upstreams in the
mid penumbra with a change in temperature, flow velocity, and field inclination
can be seen in Fig. 8; two examples near the left and right borders of the section shown are highlighted by arrows.
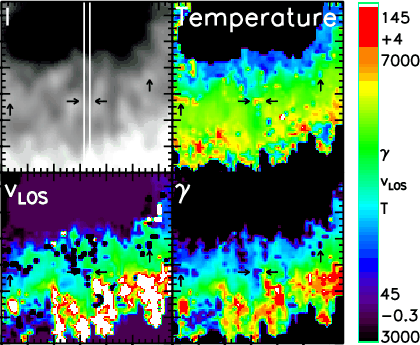 |
Figure 8: Top row: continuum intensity and temperature of the fc component. Bottom row: velocity and inclination of the fc component. The white lines mark the column, along which the parameters shown in Fig. 9 were taken. Black arrows point towards hot upstreams in the mid penumbra. |
| Open with DEXTER | |
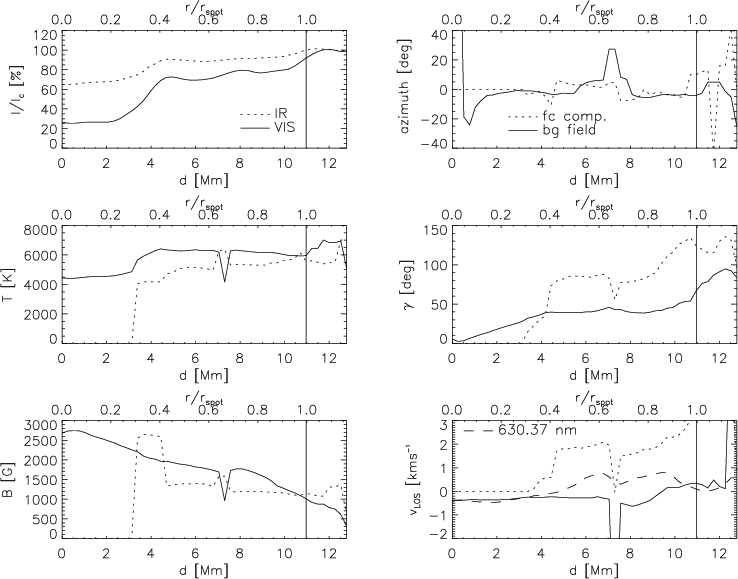 |
Figure 9: Parameters along the column marked in Fig. 8. Left column, top to bottom: continuum intensity, temperature, field strength. Right column, top to bottom: field azimuth, field inclination, LOS velocity. In all graphs besides intensity, solid lines indicate quantities of the bg field and dotted lines those of the fc component. For intensity, solid and dotted correspond to visible, respectively, IR continuum intensity. The LOS velocity of Ti I is given by the long-dashed line in the velocity graph. The vertical black line marks the outer penumbral boundary. The second hot upstream intersected by the cut at d=6.2 Mm has a similar signature in all quantities as the upflows at the inner penumbral boundary. |
| Open with DEXTER | |
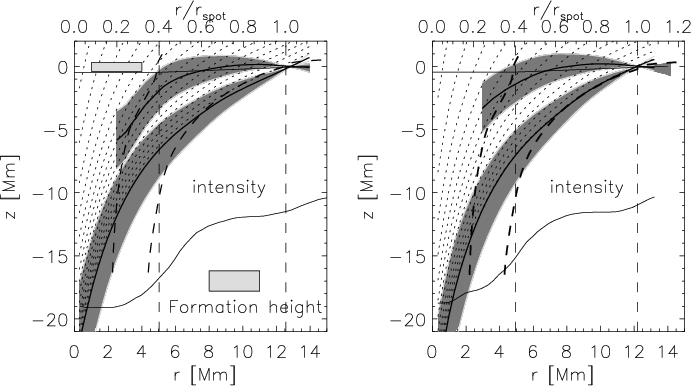 |
Figure 10:
Integrated inclination of the data from August 7 (
left) and August 9 ( right). Lower thick black line: bg
component; upper thick black line: fc component. Dark grey
shaded: same curve including inclination variations.
Thick dashed lines: the boundary layers of the spot model of JS94. Thin black line: radial variation of the IR continuum intensity. Vertical dashed lines: inner and
outer penumbral boundary. The thin black line at around z=0 km
marks the location of the |
| Open with DEXTER | |
At first sight, the inversion with two magnetic components whose properties are constant with optical depth does not contain information on the vertical structure of the magnetic fields. Taking into account that the information on the field vector is available for an extended spatial region nonetheless allows the derivation of a 3D model by integrating the field inclination. The same method has already been proposed in Schlichenmaier & Schmidt (2000) and applied to the radial variation of the flow angle derived from spectroscopy. It has also been used in Solanki et al. (2003) and Wiegelmann et al. (2005) on measurements of the magnetic field vector. Solanki et al. (2003) used the requirement that the field azimuth did not change along the integration direction, which is fulfilled for the observed sunspot.
Two additional steps were applied to the curves of h(ri) for bg
field and flow channels. The flow channels are not observed in the
umbra, so no inclination values are available there. To have a common
reference height in both integrated curves, I forced the height of bg and fc at
![]() to be identical. This was motivated by the fact that
spectra at the outer white-light boundary still showed the signatures of multiple components. Thus, both flow channels and bg component have to be present within the formation height of the spectral lines, hence, must be present at the same geometrical height as well. I also assumed
that the isosurface of
to be identical. This was motivated by the fact that
spectra at the outer white-light boundary still showed the signatures of multiple components. Thus, both flow channels and bg component have to be present within the formation height of the spectral lines, hence, must be present at the same geometrical height as well. I also assumed
that the isosurface of
![]() has a slope of 3 deg when going from
the inner towards the outer penumbral boundary (Schlichenmaier & Schmidt 2000), corresponding to a Wilson depression of 380 km in the umbra. The Wilson depression agrees with the number given by Mathew et al. (2004), who however found no smooth radial change, but instead a pronounced jump of 280 km at the umbral-penumbral boundary. Figure 10 displays the finally resulting curves for both observations on August 7 and 9. Both observations yield very similar results.
has a slope of 3 deg when going from
the inner towards the outer penumbral boundary (Schlichenmaier & Schmidt 2000), corresponding to a Wilson depression of 380 km in the umbra. The Wilson depression agrees with the number given by Mathew et al. (2004), who however found no smooth radial change, but instead a pronounced jump of 280 km at the umbral-penumbral boundary. Figure 10 displays the finally resulting curves for both observations on August 7 and 9. Both observations yield very similar results.
The integrated inclination curve of the fc
component yields a slightly elevated arched loop. The apex height above the
![]() level is around 300-400 km. With the height fixed to 0 km at
the spot radius, the curve intersects the
level is around 300-400 km. With the height fixed to 0 km at
the spot radius, the curve intersects the ![]() level at around
level at around
![]() .
Outside the sunspot, the field lines point
downwards. As the bg component inclination never reaches
horizontal fields, the integration yields a much steeper curve than for the
flow channels. If taken at face value, the curve reaches a depth of 2 (4) Mm
at
.
Outside the sunspot, the field lines point
downwards. As the bg component inclination never reaches
horizontal fields, the integration yields a much steeper curve than for the
flow channels. If taken at face value, the curve reaches a depth of 2 (4) Mm
at
![]() (0.6), implying a thick penumbra, not a shallow surface
layer. For the bg component, fortunately a direct comparison with a
theoretical model is possible. I overplotted the boundary layers between
umbra and penumbra and between penumbra and surroundings from the
magnetostatic sunspot model of Jahn & Schmidt (1994, JS94) in
Fig. 10. I reduced the radius in their original calculation to 93
% and 95%, respectively, of its value, to fit with the dimensions of the
sunspot in the observations, and shifted the curves in height to be at z=0 km at
(0.6), implying a thick penumbra, not a shallow surface
layer. For the bg component, fortunately a direct comparison with a
theoretical model is possible. I overplotted the boundary layers between
umbra and penumbra and between penumbra and surroundings from the
magnetostatic sunspot model of Jahn & Schmidt (1994, JS94) in
Fig. 10. I reduced the radius in their original calculation to 93
% and 95%, respectively, of its value, to fit with the dimensions of the
sunspot in the observations, and shifted the curves in height to be at z=0 km at
![]() like the integrated inclination curves. For
like the integrated inclination curves. For
![]() between 0.6 and 1, the agreement between the integrated bg curve and the magnetostatic model is astonishingly good, whereas for smaller
radii the JS94 model is steeper than the integrated curve.
between 0.6 and 1, the agreement between the integrated bg curve and the magnetostatic model is astonishingly good, whereas for smaller
radii the JS94 model is steeper than the integrated curve.
The good agreement in the mid to outer penumbra comes a bit as a surprise: the
JS94 model gives the location (and thus also the field inclination) of the
boundary layer between spot and surroundings at depths up to some Mm, whereas
the integrated curve uses the inclination observed at the surface close
to the ![]() level. The observed surface inclination thus seems to be
identical to the inclination in the deeper layers, which was simply an
assumption in the derivation of the integrated curves. The deviation between
the curves also points in the correct direction: if the inclination changes
with depth, the fields should get more vertical in the deeper layers, as the
expansion of flux concentrations happens near the surface layer. Thus, the
surface inclination should be greater than in the deep layers, leading exactly to the shallower integrated curve as obtained.
level. The observed surface inclination thus seems to be
identical to the inclination in the deeper layers, which was simply an
assumption in the derivation of the integrated curves. The deviation between
the curves also points in the correct direction: if the inclination changes
with depth, the fields should get more vertical in the deeper layers, as the
expansion of flux concentrations happens near the surface layer. Thus, the
surface inclination should be greater than in the deep layers, leading exactly to the shallower integrated curve as obtained.
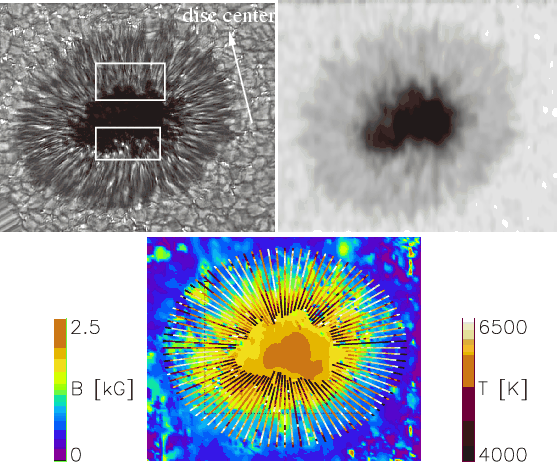 |
Figure 11: Top left: image of NOAA 10425 in the G-band from the DOT on La Palma, taken on August 9 about half an hour after the observations at the VTT. The white arrow points towards disc center. The white rectangles mark regions with an identically structured umbra-penumbra boundary in both intensity maps. Top right: IR continuum map. Bottom: top view of the 3D model. See text for the description. |
| Open with DEXTER | |
As an intermediate step towards the full 3D model, Fig. 11 shows a top view of the model. This view corresponds to the commonly used 2D maps of physical quantities. For comparison, I also show a speckle-reconstructed image of NOAA 10425 in the G-band taken with the Dutch Open Telescope (DOT) on 2003 August 9 about half an hour later than the observation analyzed here. The figure serves as a comparison of the spatial resolution of the polarimetric to speckle-reconstructed data. The boundary between umbra and penumbra has the same shape in both observations (cf. inside the white rectangles), even with the time difference of half an hour. Bright penumbral grains can be seen in the DOT map near the umbral boundary, but only on the limb side.
Figure B.2 shows the full 3D model for both observations
for three different viewing directions![]() . I emphasize that the model is derived more or less
straightforwardly from the observed spectra, with the single assumption that the integration of the field inclination is reasonable. If the model properties are projected to the surface at z=0 km, one has exactly the vector field and
thermodynamic properties that gave the best fit to the observed Stokes
profiles in - including the weak line blends - 3 infrared and 4 visible spectral lines. The model(s) show some interesting peculiarities and give rise to several
interesting questions that could be addressed by analyzing them. The
observation close to disc center (2003 Aug. 7, 6
. I emphasize that the model is derived more or less
straightforwardly from the observed spectra, with the single assumption that the integration of the field inclination is reasonable. If the model properties are projected to the surface at z=0 km, one has exactly the vector field and
thermodynamic properties that gave the best fit to the observed Stokes
profiles in - including the weak line blends - 3 infrared and 4 visible spectral lines. The model(s) show some interesting peculiarities and give rise to several
interesting questions that could be addressed by analyzing them. The
observation close to disc center (2003 Aug. 7, 6![]() heliocentric angle) is very uniform all around the spot, whereas in the other case
there is a much larger difference between the center and the limb side, where the flow
channels appear to be much more elevated. The bg component exhibits a
ragged subsurface structure, where less inclined and steeper fields coincide
with an increased field strength. This could be closely related to the
question if these ``spines'' (Lites et al. 1993) are co-spatial to darker or
brighter filaments. In general, a study of the relation of intensity to this
specific geometry would be interesting, because both positive and negative
correlations between field strength, inclination, and intensity have been
found up to now. Before an intense study of the question of the
validity of the integration of inclination has been performed, I refrain from
speculating further at this point. The 3D models show some similarity to the artist's sketch of a sunspot in Fig. 4 of Weiss et al. (2004), but I note that they are derived (directly) from observations here.
heliocentric angle) is very uniform all around the spot, whereas in the other case
there is a much larger difference between the center and the limb side, where the flow
channels appear to be much more elevated. The bg component exhibits a
ragged subsurface structure, where less inclined and steeper fields coincide
with an increased field strength. This could be closely related to the
question if these ``spines'' (Lites et al. 1993) are co-spatial to darker or
brighter filaments. In general, a study of the relation of intensity to this
specific geometry would be interesting, because both positive and negative
correlations between field strength, inclination, and intensity have been
found up to now. Before an intense study of the question of the
validity of the integration of inclination has been performed, I refrain from
speculating further at this point. The 3D models show some similarity to the artist's sketch of a sunspot in Fig. 4 of Weiss et al. (2004), but I note that they are derived (directly) from observations here.
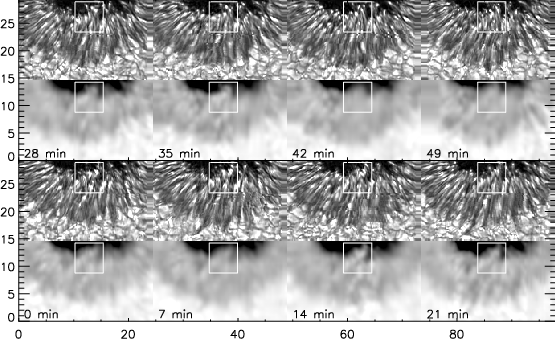 |
Figure 12: The temporal evolution of the penumbra with 7 min cadence. Data of NOAA 10425 on 2003 August 9. The lower row shows the IR continuum intensity, the upper row the co-temporal and co-spatial map in the G-band from the DOT. Tick marks are arcsec; time increases from left to right in each row. |
| Open with DEXTER | |
The penumbra has been the subject of many studies, which in most cases did not agree in their results. The observational findings are converging in some points, which I think I can substantiate further by the results of this investigation. The observations agree that the topology of the penumbra is complex. The Evershed flow happens along the nearly horizontal flow channels, whereas the average field inclination is not horizontal (e.g. Bellot Rubio et al. 2004). The Stokes Vprofiles of Figs. 2 and 4 clearly show that at a resolution of 1'' at least two independent magnetic components are present in each pixel. This could be an artifact due to the spatial resolution, but if the picture of the uncombed penumbra is valid, it will be the case even if the flow channels were fully resolved. As long as the flow channels are not optically thick and are located inside the formation height of a spectral line, both horizontal and more vertical fields would be seen at the same time. Stokes spectra with higher spatial resolution from, e.g., the recently launched HINODE satellite could be used to see if the signature of multiple components disappears at high spatial resolution.
Some results turn out to be identical regardless of the inversion method employed, whether in a simple or complex model. If polarimetric profiles are analyzed in terms of two components (or also one component but with gradients, Borrero et al. 2004), one retrieves a stronger, less inclined component with slow flow velocities and a strongly inclined one, which harbors large flows. The flow is located inside the magnetic fields, as the flow velocity is derived from the Doppler shifts in the polarization signal. The same classification into a less inclined static field and more inclined flow channels was obtained by Langhans et al. (2005) from magnetograms. All recent inversions performed agree that the more inclined component bends downwards in the outer penumbra (Westendorp Plaza et al. 2001; Bellot Rubio et al. 2004; Borrero et al. 2004). Finally, hot upflows were found at the inner penumbral boundary in some other recent studies (Rimmele & Marino 2006; Borrero et al. 2005; Bellot Rubio et al. 2006; Tritschler et al. 2004; Schlichenmaier et al. 2004).
With respect to the topology of the fields, I introduced the concept of
integrating the surface inclination. This approach relies on the assumption
that the field inclination does not depend on depth or height
in the solar atmosphere, or only slightly does. Even if the validity of the assumption has not been
addressed at all in this work, the method yields reasonable
results. For the bg component, I find surprisingly good
agreement of the integrated curve with the outer boundary layer between the
sunspot and its surroundings in the magnetostatic model of JS94. This is especially unexpected, as their boundary
line gives the field inclination in deep layers of some Mm, whereas I used
the inclination on the surface. The integration of the fc
inclination yields slightly elevated arched loops.
| |
Figure 13: The effects of the inclined LOS on observations of the limb or center side. Thick black: integrated LRF inclination of the 2-component inversion as in Fig. 10, fc component (upper line) and bg component (lower line). The LOS is overplotted in purple for the center side and in orange for the limb side. |
| Open with DEXTER | |
Another peculiarity refers to the behavior of the inversion results at around
![]() .
At this location, the fill factor of the flow channels increases strongly. Westendorp Plaza et al. (2001) found a local maximum of intensity at
.
At this location, the fill factor of the flow channels increases strongly. Westendorp Plaza et al. (2001) found a local maximum of intensity at
![]() -0.7; Bellot Rubio et al. (2004) found a change in the inversion results in the mid penumbra, a jump in the quantities of their more vertical component, and an increasing filling fraction of the fc component. Interestingly, an intersection point of the surface with
the integrated curve is located near that radius. The inversion is performed
pixel-by-pixel on only the spectra from a single location, whereas the
integration uses the inclination results along a radial cut to create the curve
of the field lines. As these two procedures are fully independent of each
other, I think that this co-spatiality is not entirely pure coincidence. Taking
the integrated curve at face value, the obvious explanation is that flow
channels on average cross the surface around
-0.7; Bellot Rubio et al. (2004) found a change in the inversion results in the mid penumbra, a jump in the quantities of their more vertical component, and an increasing filling fraction of the fc component. Interestingly, an intersection point of the surface with
the integrated curve is located near that radius. The inversion is performed
pixel-by-pixel on only the spectra from a single location, whereas the
integration uses the inclination results along a radial cut to create the curve
of the field lines. As these two procedures are fully independent of each
other, I think that this co-spatiality is not entirely pure coincidence. Taking
the integrated curve at face value, the obvious explanation is that flow
channels on average cross the surface around
![]() and then have
a stronger signature in the observed spectra.
and then have
a stronger signature in the observed spectra.
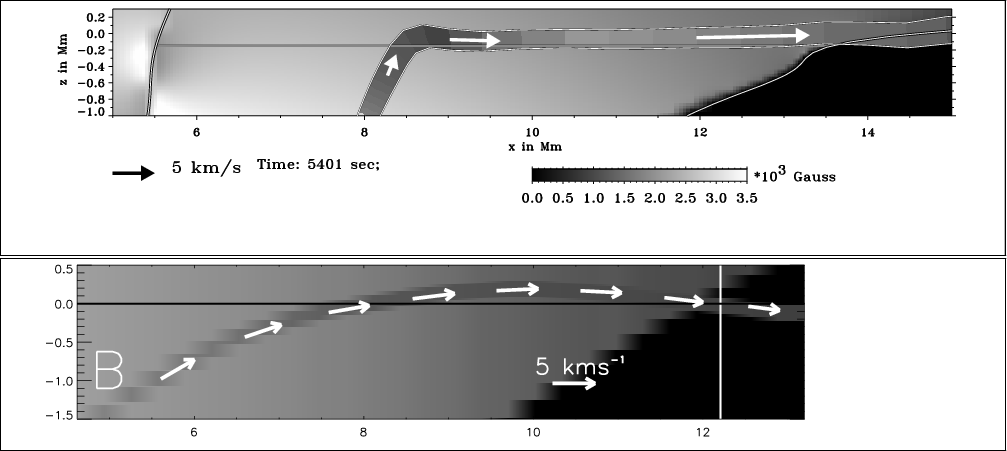 |
Figure 14: Comparison of a snapshot of the moving tube model ( top panel, courtesy of R. Schlichenmaier) with the flow channels' geometry from the observation ( lower panel). The plots have been arranged to have the same scaling and position in the horizontal axis that gives the distance from the spot center in Mm. Both panels display the fc component and the bg component with their respective field strength as color coding. The color bar gives the color coding for the field strength in both graphs. Velocities are overplotted as arrows, whose length gives the absolute velocity. The direction of the arrows for the lower plot is the field inclination. |
| Open with DEXTER | |
Scharmer & Spruit (2006) argue that the inversion of polarimetric data has
a high degree of ambiguity, as similar profiles can result from different
atmosphere stratifications. Using the IR lines at 1.5 ![]() m, I think that
most of the ambiguities are removed. In Beck (2006) and Beck et al. (2007)
I investigated the influence of the spectral lines on the parameters
retrieved by the inversion. I found that e.g. field strength is restricted by
the splitting of the 1564.8 nm line within a limit of around
m, I think that
most of the ambiguities are removed. In Beck (2006) and Beck et al. (2007)
I investigated the influence of the spectral lines on the parameters
retrieved by the inversion. I found that e.g. field strength is restricted by
the splitting of the 1564.8 nm line within a limit of around ![]() G. Most
average quantities of the field topology (field strength, field orientation)
are more or less uniquely restricted by the spectra, with the main source of
error actually the spectra themselves: spatial resolution,
signal-to-noise ratio, polarimetric sensitivity, and the polarimetric
calibration. The question that remains open, however, is the 3D organization of the magnetic fields. The present inversion yields field strength and
orientation inside the formation height of the spectral lines, but is not able to differentiate between a vertical or horizontal interweavement of field
lines. The approach of the integration of the field inclination assumes
coherent structures from one pixel to the next in the radial direction,
which is highly probable in my opinion, but need not be the case.
G. Most
average quantities of the field topology (field strength, field orientation)
are more or less uniquely restricted by the spectra, with the main source of
error actually the spectra themselves: spatial resolution,
signal-to-noise ratio, polarimetric sensitivity, and the polarimetric
calibration. The question that remains open, however, is the 3D organization of the magnetic fields. The present inversion yields field strength and
orientation inside the formation height of the spectral lines, but is not able to differentiate between a vertical or horizontal interweavement of field
lines. The approach of the integration of the field inclination assumes
coherent structures from one pixel to the next in the radial direction,
which is highly probable in my opinion, but need not be the case.
The most prominent spectral feature inside the penumbra, the Evershed effect,
is not present in the gappy model. I note that all velocities derived
here (besides the line-core velocity of Ti I) always refer to
velocities inside magnetic fields. To create the multi-lobed profiles
in the neutral line of Stokes V, two components of magnetic fields with
different orientations and bulk velocities are needed. If the gappy model
solves the penumbral heat transport problems, an explanation for the
Evershed flow is still needed. The inclination of the bg field shows an azimuthal variation that leads to a
``gappy'' structure (cf. Fig. B.2). However, the spatial scale of the variation is larger than
predicted by Scharmer & Spruit (2006). If the integrated curves are
taken at face value, this also happens in layers far below the surface layer
of ![]() = 1.
= 1.
Another argument in favor of the gappy model is that the spatial
resolution of the observations I used may not be high enough to detect the
signatures of the structuring suggested by Scharmer & Spruit. In the other
direction, it should be possible to construct a sunspot model based on their
suggestions, calculate the resulting spectra in the 1.5 ![]() m and 630 nm
lines, reduce the spatial resolution to around 1
m and 630 nm
lines, reduce the spatial resolution to around 1
![]() ,
and then
invert the spectra with two depth-independent magnetic components. The results for the bg component could be compared with the present inversion results. Contrary to the regrettable sentence of Scharmer & Spruit (2006) that ``the agreement with observations obtained with such [uncombed] models is of unquantifiable significance'', I think it necessary to show that their model successfully reproduces spectroscopic or spectropolarimetric observations to support its validity.
,
and then
invert the spectra with two depth-independent magnetic components. The results for the bg component could be compared with the present inversion results. Contrary to the regrettable sentence of Scharmer & Spruit (2006) that ``the agreement with observations obtained with such [uncombed] models is of unquantifiable significance'', I think it necessary to show that their model successfully reproduces spectroscopic or spectropolarimetric observations to support its validity.
On the one hand, the findings of Sect. 6 support the static behavior of the sunspot fields: the shape of the umbral-penumbral boundary and some especially dark patches inside the penumbra stay the same during around 1 h. On the other hand, the intensity pattern of, e.g., the penumbral grains is completely changed after less than half an hour (cf. Appendix C). The time scales in the MTM model are of a comparable order. The snapshot shown in Fig. 14 was taken at 1 1/2 h after the start of the simulation and reflects the final steady-state solution. The flow channel in the MTM evolves rapidly in the beginning and spans around half of the penumbra after 30 min (Schlichenmaier et al. 1998).
Langhans et al. (2005) used LOS magnetograms of the center side penumbra. These LOS magnetograms are not suitable for tracing the dynamic evolution of the penumbra. On the center side, the field of the bg component is parallel to the line of sight, whereas the dynamic flow channels are strongly inclined to it. Thus, the lifetimes measured there reflect the slow evolution of the bg component. The same applies to the findings of Sect. 6: the stronger field component will dominate the topology, and thus, the small amount of change in the geometry seen in Fig. 12 implies that the background component does evolve but only slowly.
The conclusion about the impossibility of interchange convection due to the lack of submerging flow channels needs some more explanations. To be convinced by the argument, one would have to agree that the penumbra is deep (some Mm), that flow channels originate from magnetic flux located initially on the boundary layer between the sunspot and its surroundings, and that this magnetic flux can become buoyant by heat input from the fully convective surroundings outside the spot![]() . The first point is suggested by the observations, while the last two are mainly based on the MTM. If one can agree on the ingredients above, I believe the penumbral heat transport can be achieved by hot rising flow channels in full agreement with the observations. If magnetic flux becomes buoyant at the outer sunspot boundary due to heating, this is necessarily a repetitive process. As soon as the hot flux bundle has risen from the boundary layer, new different magnetic flux will form the boundary layer. This new magnetic flux would come from the bg component, in the terminology used throughout this paper. After a time span on the order of 30 min it would also have to become buoyant, and follow the previously risen magnetic flux upwards. Due to the depth of the penumbra, several flow channels could be stacked on top of each other at the same time. The inversion results along a single column (cf. Sect. 4.4 and Appendix B.1) suggest exactly this configuration: two flow channels are seen along a radial cut at the same time at different locations in the penumbra.
. The first point is suggested by the observations, while the last two are mainly based on the MTM. If one can agree on the ingredients above, I believe the penumbral heat transport can be achieved by hot rising flow channels in full agreement with the observations. If magnetic flux becomes buoyant at the outer sunspot boundary due to heating, this is necessarily a repetitive process. As soon as the hot flux bundle has risen from the boundary layer, new different magnetic flux will form the boundary layer. This new magnetic flux would come from the bg component, in the terminology used throughout this paper. After a time span on the order of 30 min it would also have to become buoyant, and follow the previously risen magnetic flux upwards. Due to the depth of the penumbra, several flow channels could be stacked on top of each other at the same time. The inversion results along a single column (cf. Sect. 4.4 and Appendix B.1) suggest exactly this configuration: two flow channels are seen along a radial cut at the same time at different locations in the penumbra.
The question of penumbral heating then changes to the question of whether the penumbral energy losses can be replenished by more than one hot flow channel with a characteristic repetition time around 30 min. It has been shown by Schlichenmaier et al. (1999) and Schlichenmaier & Solanki (2003) that the final state of the MTM is not able to supply the penumbral heat requirements. The final state of the MTM is also, however, not in agreement with the temporal evolution of penumbral fine structure. Penumbral grains do not persist for hours, but fade away after reaching the umbral boundary, or turn into umbral dots without a visible connection to the penumbra (e.g. Sobotka et al. 1995). The MTM never reaches this point, probably due to its boundary condition, which fixes the lower foot point of the flow channel to the outer boundary layer between spot and surroundings. If the source of heat input is the convective surroundings outside the spot, it is easily conceivable that a flow channel would start to disappear, if it detaches completely from the boundary layer.
The repeated ascent of flow channels of course would on the long term move all magnetic flux away from the boundary layer, leading to the disappearance of the penumbra after a short time. To replace the magnetic flux, no submerging flow channels are needed. The replacement of the boundary layer can be achieved by a gradual re-arrangement of the magnetic flux of the bg component. The open question then is whether a flow channel can become part of the bg component after reaching the umbra. This should not be impossible: the inclination difference between flow channels and bg component in the innermost penumbra is only around 20![]() on average. Furthermore, the inner, more vertical foot point of the flow channel will contribute to the magnetic field pressure term in the inner penumbra, pushing other field lines of the bg field radially outwards towards the magnetopause.
on average. Furthermore, the inner, more vertical foot point of the flow channel will contribute to the magnetic field pressure term in the inner penumbra, pushing other field lines of the bg field radially outwards towards the magnetopause.
| |
Figure 15: Schematical model of the sunspot structure. |
| Open with DEXTER | |
I have analyzed two spectropolarimetric observations of NOAA 10425, taken two days apart, at heliocentric angles of 6![]() and 30
and 30![]() ,
respectively. The observations consisted of Stokes vector polarimetry of four
visible spectral lines around 630 nm and three infrared spectral
lines at 1.5
,
respectively. The observations consisted of Stokes vector polarimetry of four
visible spectral lines around 630 nm and three infrared spectral
lines at 1.5 ![]() m, taken with POLIS and TIP. I inverted the spectra with the
SIR code, using two independent magnetic model components. The field
properties were assumed to be constant with optical depth. I sorted the two
magnetic components by their inclination to the surface normal and refer to
the more (less) inclined component as flow channels (background
component). In the innermost penumbra, the inclinations of the two
components were nearly identical, and I used the temperature as the criterion instead.
m, taken with POLIS and TIP. I inverted the spectra with the
SIR code, using two independent magnetic model components. The field
properties were assumed to be constant with optical depth. I sorted the two
magnetic components by their inclination to the surface normal and refer to
the more (less) inclined component as flow channels (background
component). In the innermost penumbra, the inclinations of the two
components were nearly identical, and I used the temperature as the criterion instead.
The inversions of the same spot on the two days agree that the more inclined
component is weaker by around 0.5 kG in the innermost penumbra, but it has the same strength as the more vertical bg component at the outer spot boundary due to less of a decrease in field strength with distance from the spot center, as also found by Borrero et al. (2004) or Bellot Rubio et al. (2004). I find hot upstreams in the mid penumbra, and they appear in the more
inclined component. The hot upflows show,
however, more vertical fields in the fc component than in
neighboring pixels. The more inclined field component shows high flow velocities up to
5 km s-1 throughout the whole penumbra, which I find to be roughly aligned with the field direction. At the outer spot boundary, the flow channels on average bend slightly downwards to return to the surface (or submerge below it),
whereas the bg component never exceeds an inclination of 60-70![]() .
Both inverted sunspot maps show a change in the relative filling fraction of
bg component and fc component at around
.
Both inverted sunspot maps show a change in the relative filling fraction of
bg component and fc component at around
![]() ,
where the filling fraction of the fc component increases.
,
where the filling fraction of the fc component increases.
To generate a geometrical model of the penumbral field topology, I integrated
the surface inclination in the radial direction. This approach is valid, if the
field inclination (not field strength!) is independent of or only slightly
dependent on depth in the solar atmosphere. This method can, on the one hand, be used as a powerful visualization tool, as it allows the geometry and all other field properties to be easily set in context. On the other hand, separately integrating the inclination
of bg component and fc component, it allows construction of a 3D
model of the sunspot that is basically the best-fit atmosphere model for the observed
profiles. In this 3D model, the bg component shows steeper ridges of
enhanced field strength, which may be identical to the ``spines'' of
Lites et al. (1993). The azimuthally averaged fc component yields
arched loops that cross the ![]() = 1 surface at around
= 1 surface at around
![]() ,
where the filling fraction changes in favor of the flow channels. There is no
obvious reason why these two things happen at the same location, because the inversion is done pixel-by-pixel
without any information from neighboring pixels, whereas the integration uses
all inclination values in the radial direction. I thus conclude that it is highly
probable that on average the flow channels do cross the surface at this
radius.
,
where the filling fraction changes in favor of the flow channels. There is no
obvious reason why these two things happen at the same location, because the inversion is done pixel-by-pixel
without any information from neighboring pixels, whereas the integration uses
all inclination values in the radial direction. I thus conclude that it is highly
probable that on average the flow channels do cross the surface at this
radius.
In general, the inversion results agree with the simulations of the moving tube model of Schlichenmaier et al. (1998) in several aspects (geometry of bg component and flow channels, radial variation of physical quantities). With a characteristic penumbral time scale of intensity variations below 30 min and a depth of the penumbra of some Mm as suggested by the integrated inclination, I think that nothing found in the present observations would contradict a penumbral heat transport by a series of hot, consecutively rising flow channels, as depicted in Fig. 15. An analysis of a time series of sunspot observations using a two-component inversion and the integration of the field inclination may be able to give more direct proof if this scenario is actually happening in the penumbra. I will attempt this task as the next step using either the data shown in Fig. 12 or observations from later times that were taken with the help of an adaptive optics system (e.g., Cabrera Solana et al. 2006).
Acknowledgements
The VTT is operated by the Kiepenheuer-Institut für Sonnenphysik (KIS) at the Spanish Observatorio del Teide of the Instituto de Astrofísica de Canarias (IAC). The DOT is operated by Utrecht University at the Spanish Observatorio del Roque de los Muchachos of the IAC. This work has been partly supported by the Deutsche Forschungsgemeinschaft under grant SCHL 512/2-1. The POLIS instrument is a joint development of the High Altitude Observatory (Boulder, USA) and the KIS. Discussions and advice from L. R. Bellot Rubio, R. Schlichenmaier, and especially the supervisor of my thesis at the KIS, W. Schmidt, are gratefully acknowledged. I thank the referee for pointing out the problems with the identification of the two components in the inner penumbra.
The Stokes V profiles in the neutral line on the limb side (Fig. 2) show a complex multi-lobed structure. Although the profiles strongly differ from those originating from a simple atmosphere with constant magnetic field properties in the formation height of the spectral lines, only a few ingredients are needed to reproduce their shapes to first order. Figure A.1 shows a simple experiment: the regular profile from the center side (rightmost graph of Fig. 2) is taken to be component A; a second component B is constructed as -90% of A. Adding these two profiles again generates a regular two-lobed profile with reduced amplitude (left column of Fig. A.1). If component B is displaced in wavelength - corresponding to the Doppler shift induced by a flow field of 2 km s-1 - the addition yields peculiar multi-lobed profiles like those observed in the neutral line of Stokes V.
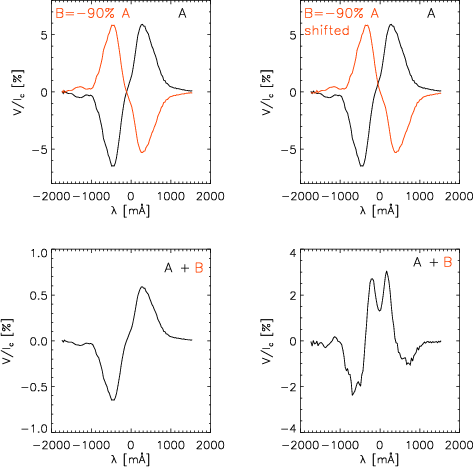 |
Figure A.1: A simple method of producing peculiar V profiles. The addition of the two profiles A and B in the top row yields the profiles in the bottom row. Left column: profile B equals -90% of A and is located at the same wavelength. Right column: B equals -90% of A, but now shifted in wavelength. |
| Open with DEXTER | |
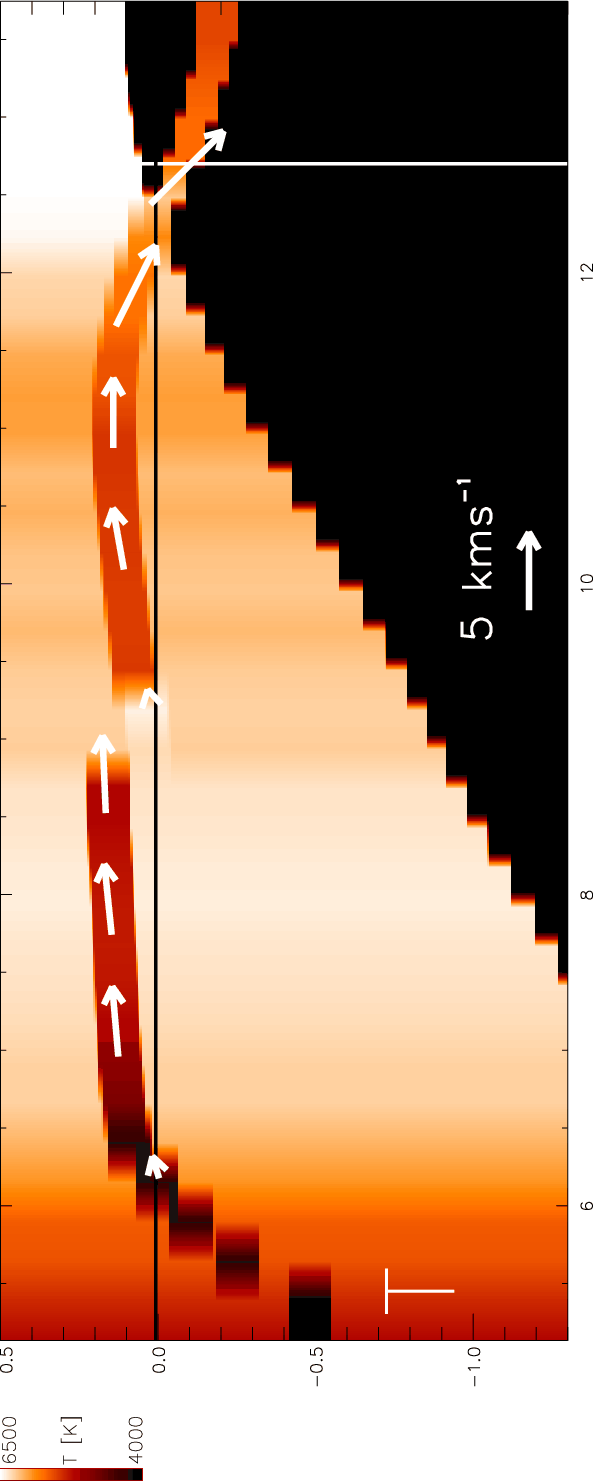 |
Figure B.1: The integrated inclination values along the single column marked in Fig. 8. Similar to Fig. 14, but using temperature for the color coding. The integrated curve has been shifted down at x = 7 Mm, where the hot upstream appears. |
| Open with DEXTER | |
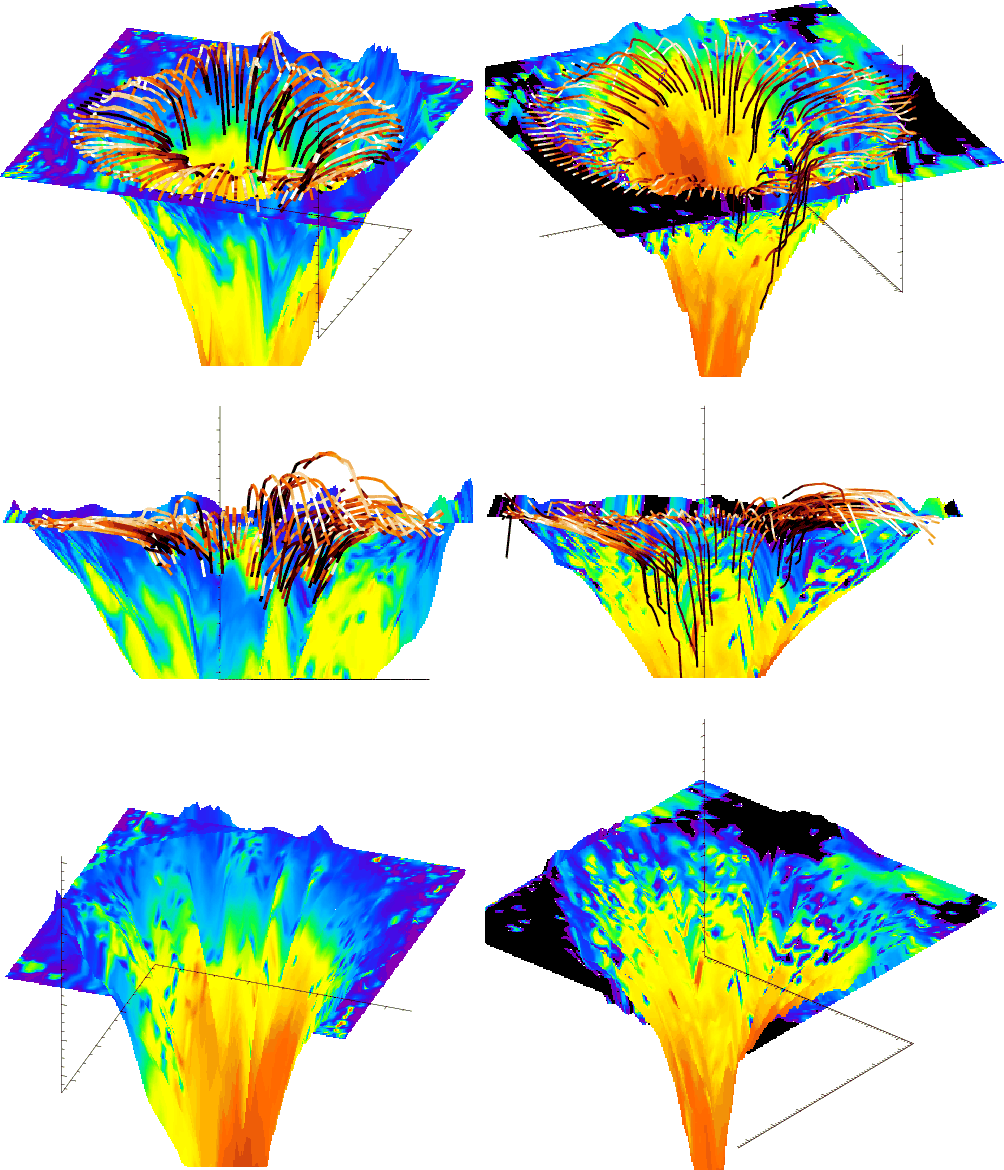 |
Figure B.2: The 3D models from the integration of the inclinations to the surface averaged over 4 degree bins. Left column: data of August 9. Right column: data of August 7. Top to bottom: view from above, side view, view from below. The color coding is identical to Fig. 11. The plot of the flow channels was switched off for the view from below. |
| Open with DEXTER | |
To follow the properties in a spatial cut without averaging, I took the
inversion results along a single column of the 2D maps
(cf. Sect. 4.4). The inclination of the cut can also be integrated in the radial direction. In Fig. B.1, I display the result in the same way
as in Fig. 14, but this time with the temperature as color
coding. The hot upstream is located at x = 9 Mm. The integrated
curve was corrected to meet z=0 km at the outer sunspot boundary. Then I suggestively have shifted the integrated curve for x > 9 Mm
down by 150 km to meet the ![]() level at x = 9 Mm. As
the formation height covers some hundred kilometers, the geometry depicted
would still agree with the observed spectra, even if of course I
have no proof that the second channel is below the first one.
level at x = 9 Mm. As
the formation height covers some hundred kilometers, the geometry depicted
would still agree with the observed spectra, even if of course I
have no proof that the second channel is below the first one.
To quantify the amount of dynamics in the penumbra, I used a 2-h time
series of speckle-reconstructed images in the G-band from the DOT telescope,
taken on 2003 August 9 after the map used for the present investigation (30![]() heliocentric angle).
To derive the boundaries of the penumbra, I used the temporal average of the
time series (cf. Fig. C.1). To avoid counting brightenings at the
outer white-light boundary as penumbral grains (PGs), I further restricted the area to all points inside an
ellipse centered on the spot, but with a smaller radius than the average
penumbra. I created a mask of all points inside the penumbra above a
threshold of 1.2 times the continuum intensity outside the spot for each of
the 214 images of the time series. The number and area of the PGs were taken
from the statistics of the individual masks.
heliocentric angle).
To derive the boundaries of the penumbra, I used the temporal average of the
time series (cf. Fig. C.1). To avoid counting brightenings at the
outer white-light boundary as penumbral grains (PGs), I further restricted the area to all points inside an
ellipse centered on the spot, but with a smaller radius than the average
penumbra. I created a mask of all points inside the penumbra above a
threshold of 1.2 times the continuum intensity outside the spot for each of
the 214 images of the time series. The number and area of the PGs were taken
from the statistics of the individual masks.
On a single radial cut starting at the center and ending at the outer
penumbral boundary, usually two or three individual PGs can be detected, even
if they do not always all exceed the threshold used. The temporal average of the
masks clearly shows the dependence of the PGs on the azimuthal position inside
the spot: on the limb side, the PGs appear roundish and have a much higher
frequency than for azimuths of 90![]() ,
respectively, 270
,
respectively, 270![]() ,
where
they usually appear as thin streaks. On the center side, they are almost
completely missing. As in a single image, usually two or more PGs can be seen
for any radial cut in the temporal average. The intensity of all points inside
the boundaries defined above during the time series yielded the histogram of
Fig. C.2, which shows that around 10% of all points are on average brighter than the outside continuum intensity.
,
where
they usually appear as thin streaks. On the center side, they are almost
completely missing. As in a single image, usually two or more PGs can be seen
for any radial cut in the temporal average. The intensity of all points inside
the boundaries defined above during the time series yielded the histogram of
Fig. C.2, which shows that around 10% of all points are on average brighter than the outside continuum intensity.
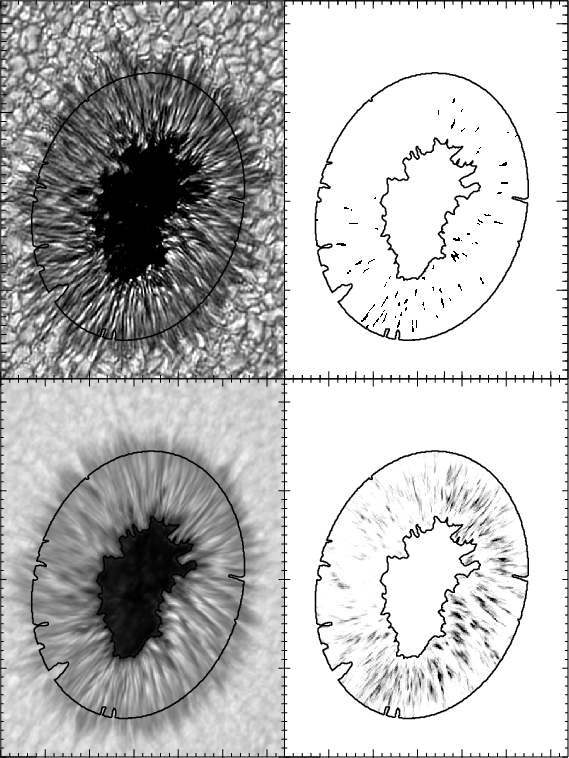 |
Figure C.1: Overview of the DOT data set. Top row: single intensity image ( left) with corresponding mask of brightenings ( right). Bottom row: temporal averages over the time series. The black contours outline the area considered to be the penumbra. Tick marks are in arcsec. |
| Open with DEXTER | |
| |
Figure C.2: Average histogram of penumbral intensities in the time series. |
| Open with DEXTER | |
| |
Figure C.3: Autocorrelation functions of the intensity in the penumbra and a quiet Sun reference area. |
| Open with DEXTER | |
All subsequent statistics and quantities were derived from the full
time series in the area defined as belonging to the penumbra. On average, in each image of the time series I found around 90 penumbral grains with an intensity above 1.2 times the continuum
intensity outside the spot. The average size of the PGs was 16 pixels, which
would correspond to a square area of
![]() km2. They covered an area
fraction of around 3% of the whole penumbra. Points with an intensity above
a continuum intensity of unity covered 10% of the full area.
km2. They covered an area
fraction of around 3% of the whole penumbra. Points with an intensity above
a continuum intensity of unity covered 10% of the full area.
The intensity patterns in the penumbra disappear after a lifetime of around 30 min; the autocorrelation drops to zero around that time (cf. Fig. C.3). For comparison, I used a granulation area outside the spot, which shows a characteristic correlation time of below 15 min. I used two types of autocorrelation with the same result: autocorrelation of the full images (restricted to the penumbra), and pixel-by-pixel autocorrelation, where only the intensity of one spatial position with time was used in the derivation of the autocorrelation. The number of PGs is, however, constant to a high degree. Thus, I conclude that the rate of the appearance of PGs should also have a characteristic timescale of around 30 min.