A&A 480, 551-561 (2008)
DOI: 10.1051/0004-6361:20077934
R. Reche - H. Beust - J.-C. Augereau - O. Absil
Laboratoire d'Astrophysique de Grenoble, CNRS, Université Joseph-Fourier, UMR 5571, Domaine Universitaire, 38400 Saint-Martin d'Hères, France
Received 24 May 2007 / Accepted 18 December 2007
Abstract
Context. The observed clumpy structures in debris disks are commonly interpreted as particles trapped in mean-motion resonances with an unseen exo-planet. Populating the resonances requires a migrating process of either the particles (spiraling inward due to drag forces) or the planet (moving outward). Because the drag time-scale in resolved debris disks is generally long compared to the collisional time-scale, the planet migration scenario might be more likely, but this model has so far only been investigated for planets on circular orbits.
Aims. We present a thorough study of the impact of a migrating planet on a planetesimal disk, by exploring a broad range of masses and eccentricities for the planet. We discuss the sensitivity of the structures generated in debris disks to the basic planet parameters.
Methods. We perform many N-body numerical simulations, using the symplectic integrator SWIFT, taking into account the gravitational influence of the star and the planet on massless test particles. A constant migration rate is assumed for the planet.
Results. The effect of planetary migration on the trapping of particles in mean motion resonances is found to be very sensitive to the initial eccentricity of the planet and of the planetesimals. A planetary eccentricity as low as 0.05 is enough to smear out all the resonant structures, except for the most massive planets. The planetesimals also initially have to be on orbits with a mean eccentricity of less than than 0.1 in order to keep the resonant clumps visible.
Conclusions. This numerical work extends previous analytical studies and provides a collection of disk images that may help in interpreting the observations of structures in debris disks. Overall, it shows that stringent conditions must be fulfilled to obtain observable resonant structures in debris disks. Theoretical models of the origin of planetary migration will therefore have to explain how planetary systems remain in a suitable configuration to reproduce the observed structures.
Key words: method: N-body simulations - celestial mechanics - stars: planetary systems - stars: individual: Vega
![\begin{figure}
\par\resizebox{8.8cm}{!}{\includegraphics[angle=-90]{7934f01.eps}}
\end{figure}](/articles/aa/full/2008/11/aa7934-07/img14.gif) |
Figure 1: Example of a planetesimal disk without outward planet migration, nor inward P-R drag migration of the test particles, according to our numerical simulations as explained in Sect. 2. The star and planet locations, projected onto the orbital plane of the planet, are represented by large red points, and the planet orbit by a thin green line. The initial planetesimal disk consists of 50 000 planetesimals distributed between 40 and 75 AU, with the surface density distribution proportional to r-1. Although some planetesimals are trapped in MMRs with the planet, they are not sufficiently numerous to generate spatial structures (besides the 1:1 MMR). (See the electronic edition of the Journal for a color version of this figure.) |
For clumps due to MMRs to be observed, the population of resonant particles must be significantly enhanced by an additional physical process. Two mechanisms can account for this: Poynting-Robertson (P-R) drag and planet migration. Dust particles that are too large to be ejected from the system by radiation pressure can spiral inward into the star due to P-R drag and to some other minor forces like stellar wind drag (e.g. Augereau & Beust 2006). In the course of its inward migration, a dust particle can be trapped into exterior MMRs with a planet, hence increasing the contrast of their asymmetric patterns (Deller & Maddison 2005; Kuchner & Holman 2003). Planet migration, on the other hand, involves particles of all sizes, except those ejected by radiation pressure. Many particles can be trapped in MMRs by a planet migrating outward in the disk. Each non-resonant particle crossing an MMR has a chance trapped and subsequently migrating, following the resonance (Wyatt 2003).
Several authors have studied either the effect of P-R drag, or of planet migration, on disk structures, using different methods (analytic, semi-analytic or numerical) and various planet parameters (mass and orbital eccentricity). A summary of the main previous studies is provided in Table 1. The P-R drag scenario has been extensively studied for a wide range of parameters, while the migrating planet scenario has been investigated only for a planet on a circular orbit by Wyatt (2003). It is thus important to better characterize the latter scenario in order to distinguish which of the two dominates the morphology of debris disks. Moreover, a number of studies (Lecavelier Des Etangs et al. 1996; Krivov et al. 2007; Wyatt 2005b) have shown that collisions may prevent MMRs from being populated by P-R drag since the collision timescale in massive debris disks might be much shorter than the P-R drag migration timescale.
Therefore, we propose in this paper to extensively study the planet migration scenario, using numerical modeling, by generating a synthetic catalog similar to what has been done for the P-R drag scenario using analytical (Kuchner & Holman 2003) or numerical studies (Deller & Maddison 2005). We extend the pioneering work done by Wyatt (2003) in studying the influence of the planet eccentricity on the visibility of the resonant patterns. In Sect. 3, we discuss the case of a planet migrating on a circular or low-eccentricity orbit. In Sect. 4, we extend this study to planets on orbits with eccentricities up to 0.7. This study is generalized to various migration rates and disk initial states in Sect. 5, and compared to previous studies in Sect. 6. The limitations of our approach are discussed in Sect. 7.
| Authors | Method | Planet parameters | Migration | Notes | |
| Mass ratioa | eccentricity | ||||
| Wyatt (2003) | semi-analytic | 0.0003 to 3 | 0 | planet | Forced migration |
| Wyatt (2006) | semi-analytic | none | This work extends the previous one | ||
| to smaller particles sensitive to radiation pressure | |||||
| Kuchner & Holman (2003) | analytic | 0.005 to 15 | 0 to 0.6 | particles | Only resonant particles trapped |
| during migration due to P-R drag | |||||
| Deller & Maddison (2005) | numerical | 0.01 to 3 | 0 to 0.7 | particles | Particles migrate due to P-R drag and solar wind |
| Moro-Martín & Malhotra (2002) | numerical | 0.05 | 0 | particles | Study of the Kuiper Belt. |
| This paper | numerical | 0.001 to 3 | 0 to 0.7 | planet | Only planetesimals disk, forced migration |
a Planetary mass in Jovian mass divided by stellar mass in solar mass.
In this model, the planet keeps a Keplerian orbit around the star, or migrates at a constant rate without modification of its eccentricity. This basic model is easy to implement and to analyze, and corresponds to the case described by Wyatt (2003). The goal of this paper is to extend this initial work to a wider range of planet eccentricities by a numerical study. We start by studying planets on low-eccentricity orbits (e<0.1), and then extend our work to larger eccentricities.
To perform our simulations we have used the symplectic package
SWIFT (Wisdom & Holman 1991; Levison & Duncan 1994), to which we have added
planetary migration. To do this, we plugged in the
Wyatt (2003) prescription. This method consists of adding an acceleration in the direction
of the orbital motion of the planet, with an intensity equal to:
![]() ,
where G is the
gravitational constant,
,
where G is the
gravitational constant, ![]() the stellar mass and
the stellar mass and
![]() the
variation rate of the planet semi-major axis
the
variation rate of the planet semi-major axis ![]() .
This causes a change in the planet semi-major axis
without modifying its eccentricity (for a planet on a low-eccentricity
orbit; for a planet on a higher eccentricity orbit the change is not
significant) or its inclination. We do not discuss here the origin
of the migration. It can be due either to the migration of a large
internal planet, or to the gravitational influence of the planetesimals themselves. The most
important here is that we keep
.
This causes a change in the planet semi-major axis
without modifying its eccentricity (for a planet on a low-eccentricity
orbit; for a planet on a higher eccentricity orbit the change is not
significant) or its inclination. We do not discuss here the origin
of the migration. It can be due either to the migration of a large
internal planet, or to the gravitational influence of the planetesimals themselves. The most
important here is that we keep
![]() constant during each
simulation, generally at 0.5 AU Myr-1, to match the
Wyatt (2003) model for the Vega disk. We have used the
RMVS3 version of the SWIFT integrator, in order to have a better
modeling of the close encounters between the planet and the
planetesimals. In all the simulations, the system evolution is followed for
40 Myr.
constant during each
simulation, generally at 0.5 AU Myr-1, to match the
Wyatt (2003) model for the Vega disk. We have used the
RMVS3 version of the SWIFT integrator, in order to have a better
modeling of the close encounters between the planet and the
planetesimals. In all the simulations, the system evolution is followed for
40 Myr.
![\begin{figure}
\par\makebox[\textwidth]{
\includegraphics[angle=-90,width=0.33\t...
...includegraphics[angle=-90,width=0.33\textwidth]{7934f25.eps} } \\\end{figure}](/articles/aa/full/2008/11/aa7934-07/img22.gif) |
Figure 3: Same simulations as in Fig. 2, with the planetesimals represented in a (semi-major axis, eccentricity) plane. The plotting conventions are the same as in Fig. 2. (See the electronic edition of the Journal for a color version of this figure.) |
The scenario of a planet on a low-eccentricity orbit is the most studied
case (see Table 1), for several reasons. First, planets were
originally expected to be on almost circular orbits because, during the protoplanetary
phase, circumstellar gas forces the planets to remain on very low eccentricity
orbits. A planet on such an orbit therefore corresponds to the ``standard
scenario''. Also, a low or zero planetary eccentricity simplifies an
analytical analysis (Kuchner & Holman 2003). Nevertheless, it must be noted that many of the
extrasolar planets detected so far have high
eccentricities![]() , and we will therefore extend our
study to high eccentricities in Sect. 4.
, and we will therefore extend our
study to high eccentricities in Sect. 4.
Although this standard scenario has already been well studied, all its aspects have not yet been investigated. Wyatt (2003) studied the case of an outward migrating planet on a strictly circular orbit, while Kuchner & Holman (2003) and Deller & Maddison (2005) studied the case of planets on fixed low-eccentricity orbits, considering only inward dust migration due to P-R drag. We propose in this section to numerically study a migrating planet on a circular or low-eccentricity orbit to search for possible differences with respect to previous studies.
Figures 2 to 5 show examples of results obtained with our numerical model. It appears that, with a planet on a low-eccentricity orbit, the planetesimals trapped in MMRs are numerous and dominate the shape of the disk. Four important factors must be taken into account to determine which resonances govern the aspect of the structures in the disk:
Most of the structures discussed in Sect. 3.2 disappear as the planet eccentricity increases (Fig. 4). The libration amplitude of resonant planetesimals indeed increases, smoothing the density waves along the orbit. For eccentricities between 0.05 and 0.1, the disk looks like a ring with a hole at the location of the planet, or no longer shows structures for the lower mass planets. The rings are not only due to the 1:1resonant planetesimals corotating with the planet, but are also populated by other major resonances (e.g., 2:1, 3:2). Massive planets (last row of Fig. 4) are less sensitive to this effect because they can more efficiently eject planetesimals during close encounters, even if they are in the MMRs. Only resonant planetesimals with low libration amplitudes can survive and the disk remains structured as in the strictly circular case.
According to previous works, three phenomena should change in our simulations with respect to the low-eccentricity orbit case. First, close encounters between the planet and the planetesimals are more frequent, increasing the depletion rate of the disk. As the probability of ejection increases with the planetary mass, the more massive the planet, the more depleted the disk. Second, even the non-resonant planetesimals see their eccentricities rise significantly due to the gravitational perturbation of the planet. Finally, the trapping probability is also modified (Quillen 2006): increasing the planetary eccentricity decreases the trapping probability of the first order resonances but can increase it for higher order resonances. With a planet on an eccentric orbit, the resonant planetesimals are also not well protected against close encounters, which limits even more the number of planetesimals in MMRs. The migration thus cannot populate the MMRs enough to generate detectable patterns: for structures generated by a planet on a moderate or high eccentricity orbit, the MMRs, and thus the migration of the planet, is no longer an important factor whatever the planet mass as the non-resonant dynamics dominates the shape of the disk.
The depletion rate is so efficient that the disk is almost entirely depleted during our 40 Myr simulations, except in the case of an Earth mass or Neptune mass planet on moderate eccentric orbits (below 0.2 or 0.3). An Earth mass planet on a more eccentric orbit (above 0.5) can also produce transient collective non-resonant effects, spatially fixed, in the azimuthal distribution of the planetesimals (Fig. 9) before the disk is depleted, as explained below.
The theoretical background for the dynamics of the planetesimals in our
simulations is the restricted three-body problem, i.e., a problem
where a mass-less test particle orbiting a star is perturbed by a
planet orbiting the star on an unperturbed Keplerian orbit.
We restrict ourselves to the planar case for simplicity.
In this framework,
the Hamiltonian of the problem is (see, for instance Morbidelli & Moons 1993)
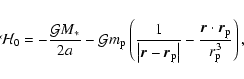 |
(1) |
Two examples for
![]() and
and
![]() are shown in Fig. 8.
They both correspond to
are shown in Fig. 8.
They both correspond to
![]() (
(![]() is the semi-major axis of
the planet). The whole dynamical problem obviously simply
scales with
is the semi-major axis of
the planet). The whole dynamical problem obviously simply
scales with ![]() ,
so that a only needs to be given in units of
,
so that a only needs to be given in units of
![]() .
The present case (
.
The present case (
![]() )
corresponds to a planetesimal orbiting outside the
planet's orbit, like those we are simulating. Note also that
the topology of the Hamiltonian is independent of the mass
)
corresponds to a planetesimal orbiting outside the
planet's orbit, like those we are simulating. Note also that
the topology of the Hamiltonian is independent of the mass ![]() of the
planet, because the non-constant part of
of the
planet, because the non-constant part of
![]() is proportional to
is proportional to
![]() .
Hence the plots in Fig. 8 hold for any planetary mass. The planetary mass
.
Hence the plots in Fig. 8 hold for any planetary mass. The planetary mass ![]() only affects the
speed at which the planetesimal
moves along the Hamiltonian level curves (the speed is
only affects the
speed at which the planetesimal
moves along the Hamiltonian level curves (the speed is ![]()
![]() ).
).
The plots in Fig. 8 hold for
![]() ,
but for other values
of a, we have similar plots. Conversely, the shape of the phase portrait
depends critically on
,
but for other values
of a, we have similar plots. Conversely, the shape of the phase portrait
depends critically on ![]() .
We see that for a small
.
We see that for a small ![]() ,
a planetesimal
with a small initial e will keep e small for ever. For a large
,
a planetesimal
with a small initial e will keep e small for ever. For a large
![]() however, any planetesimal with a small initial e will be driven
to high e values and
however, any planetesimal with a small initial e will be driven
to high e values and
![]() .
Starting from a population of
planetesimals with negligible eccentricities, we end up after a certain
delay with many highly eccentric planetesimals with their lines of apsides
more or less aligned with that of the planet
.
Starting from a population of
planetesimals with negligible eccentricities, we end up after a certain
delay with many highly eccentric planetesimals with their lines of apsides
more or less aligned with that of the planet
![]() .
This naturally generates a clump of planetesimals close to the apoastron
of their orbits, as due to Kepler's second law, the planetesimals
spend most of their time near apoastron. This is the origin of the
clumps we obtain in our simulations with low-mass planets
(Fig. 9).
.
This naturally generates a clump of planetesimals close to the apoastron
of their orbits, as due to Kepler's second law, the planetesimals
spend most of their time near apoastron. This is the origin of the
clumps we obtain in our simulations with low-mass planets
(Fig. 9).
So, why does this not hold for more massive planets? The secular dynamics described above
is valid as long as the planetesimal does not undergo any close encounter
with the planet. In the case of a close encounter, the orbit of the planetesimal
is suddenly changed, and it is often ejected. Many regions in
Fig. 8 correspond to a planet crossing orbit. The probability of
having a close encounter with the planet within a given timespan
is higher if the planet is more massive. It scales
as
![]() ,
because the Hill radius
,
because the Hill radius ![]() of the planet scales as
of the planet scales as
![]() ,
and the encounter cross-section is expected to scale as
,
and the encounter cross-section is expected to scale as
![]() .
The mass ratio between a 3 Jupiter mass planet and
an Earth-sized planet is
.
The mass ratio between a 3 Jupiter mass planet and
an Earth-sized planet is ![]() 1000. We thus expect a planetesimal to
undergo 100 times more encounters with the first planet than
with the second. Finally, with massive planets, most of the planetesimals
are subject to a close encounter with the planet within the timespan
of the simulation described in Fig. 6.
This is why the disk appears so depleted at the end.
Conversely, for low-mass planets, the close encounter probability
is so low that many planetesimals keep following the secular dynamics
until the end of the run. Therefore, they have enough time to generate
a strong asymmetric clump.
1000. We thus expect a planetesimal to
undergo 100 times more encounters with the first planet than
with the second. Finally, with massive planets, most of the planetesimals
are subject to a close encounter with the planet within the timespan
of the simulation described in Fig. 6.
This is why the disk appears so depleted at the end.
Conversely, for low-mass planets, the close encounter probability
is so low that many planetesimals keep following the secular dynamics
until the end of the run. Therefore, they have enough time to generate
a strong asymmetric clump.
We stress here that this clump is not due to any mean-motion resonance. There is thus no need for planet migration in this case and this may appear as an alternative scenario to mean-motion resonance for generating transient clumps. Nevertheless, even with an Earth mass planet, these clumps do not last as long as the resonant clumps. Planetesimals are not protected against close encounters with the planet, which finally deplete most of the disk after 35 Myr, in our simulations.
![\begin{figure}
\resizebox{8.8cm}{!}{\includegraphics[angle=-90]{7934f76.eps}}
\end{figure}](/articles/aa/full/2008/11/aa7934-07/img45.gif) |
Figure 9:
An Earth mass planet on a very eccentric orbit
(
|
As explained in the previous sections, we have run many simulations in order to sample correctly the parameter space of planetary eccentricity versus planetary mass. We can thus address the question of the visibility of asymmetric structures in a disk. As already mentioned, the shape of a disk is dominated either by resonant or by non-resonant planetesimals. The region where MMRs dominate the disk shape corresponds to planets on low-eccentricity orbits. In this region, two situations can occur: planets can generate clear resonant patterns with several visible clumps in the disk (generally while on circular or very low eccentric orbits) or produce smooth patterns, with only a hole at the planet location as the visible structure (generally while on an orbit with an eccentricity between 0.05 and 0.1). Concerning the non-resonant planetesimals, Earth mass planets on eccentric orbits can generate observable structures by secular perturbations. Outside these regions, the disks do not show any observable structures, when they are not totally depleted. The results for all these simulations are summarized in Table 2 and Fig. 10. Three main regions can be identified. In zones I and II, observable structures in the disk are generated by MMRs while in zone III, transient structures are generated by non-resonant mechanisms. In the remaining region, the disk does not show any structure. In zone I, MMRs create clumpy disks while in zone II they generate a smooth disk with a hole at the planet location. This figure also shows the fraction of planetesimals still bound to the system after 40 Myr (background color). However, this quantity is sensitive to several parameters (stellar mass, duration of the simulation, initial distribution of the planetesimals ...) while the limits of the three zones are quite independent.
However, we have assumed for these simulations a constant migration rate of 0.5 AU Myr-1 and a disk of planetesimals initially on circular orbits. With different assumptions the outcomes of the simulations could be changed: we have thus investigated these two parameters in order to discuss the robustness of our conclusions. For a given planetary mass and eccentricity, we expect the structures to change, as the trapping probability depends on the migration rate and on the planetesimal eccentricity. But, again, our main focus is to determinate if the resonant structures are visible or not. For instance, in the low-eccentricity orbit case, Neptune mass and Jupiter mass planets do not produce the same structures but they have the same sensitivity to the planet eccentricity. Here, we investigate if the migration rate or the initial planetesimal eccentricity change these conclusions. The results of these additional simulations are summarized in Tables 3 and 4, in the same manner as in Table 2 for the nominal case. Table 3 corresponds to simulations with different migration rates but unexcited initial planetesimal disks. Table 4 describes simulations with initially excited disks.
![\begin{figure}
\par\includegraphics[angle=-90,width=12cm,origin=br]{7934f77.eps}
\end{figure}](/articles/aa/full/2008/11/aa7934-07/img46.gif) |
Figure 10: Overview of the simulation outputs for planetesimal disks, in a (planet mass, planet eccentricity) plane. All simulations shown in this figure concern a planet with a constant migration rate of 0.5 AU Myr-1. Color scale indicates the fraction of planetesimals still bound after 40 Myr. The fraction of surviving planetesimals is linearly interpolated between the simulations of the Table 2. In zones I and II, observable structures in the disk are generated by MMRs while in zone III, transient structures are generated by non-resonant mechanisms. In the remaining region, the disk does not show any structure. In zone I, MMRs create clumpy disks while in zone II they generate a smooth disk with a hole at the planet location. (See the electronic edition of the Journal for a color version of this figure.) |
In our work, the migration rate parameter was chosen to match the best fit obtained by Wyatt (2003) for the Vega debris disk to allow direct comparison. In his paper, Wyatt discussed the impact of the migration rate in the restrictive case of a planet on a circular orbit, and has shown that the trapping probability in an MMR increases with decreasing migration rates (or when the star is less massive).
We have thus performed simulations with a lower (0.05 AU Myr-1) and a higher (5 AU Myr-1) migration rate than previously (Table 3). Overall, our results are in good agreement with those of Wyatt (2003), even for eccentric orbits: the trapping probability increases when the migration rate decreases. For example, with a low migration rate, a Neptune mass planet traps planetesimals in the 2:1 MMR, while a Saturn mass planet populates the second libration center of the 2:1 resonance.
Although the disk resonant shape is modified because the populated MMRs change with the migration rate, the dependence on the mass and eccentricity of the planet remains unchanged: non-resonant planetesimals always dominate at moderate eccentricity and clear resonant patterns are only visiblewith a planet on a quasi circular orbit. We still note some subtle changes between the different migration rates. With a higher migration rate, low mass planets have less time to increase the eccentricities of the non-resonant planetesimals which perturb less the resonant structures. With a very low migration rate, planets have more time, during close encounters, to eject non-resonant planetesimals, and resonant planetesimals in the eccentric planet orbit case. Nevertheless, as these changes are small, it is possible to summarize our simulations in the (planet eccentricity; planet mass) parameter space and to discuss the visibility of resonant clumps using only these two parameters, as in Fig. 10.
It appears that an initially warm disk does not differ much from a cold
disk in the case of a planet on a moderate or high eccentricity
orbit. The secular perturbations, or the close encounters, due to such
a planet raise the planetesimal
eccentricities on a timescale shorter than the migration time. A
cold disk therefore becomes warm in the course of planetary
migration. However, with a
planet migrating on a circular orbit, the disk structures are
different depending on the initial eccentricities of the
planetesimals. A warm disk (
![]() )
with a planet on a circular orbit is actually
roughly equivalent to a cold disk with a planet on a low-eccentricity
orbit (0.05 or 0.1): the MMRs trap many planetesimals but the
clumps are smoothed by the large libration amplitude (Fig. 11). From our simulations, it appears that, for a
Saturn mass or Jupiter mass planet on a circular orbit, an
)
with a planet on a circular orbit is actually
roughly equivalent to a cold disk with a planet on a low-eccentricity
orbit (0.05 or 0.1): the MMRs trap many planetesimals but the
clumps are smoothed by the large libration amplitude (Fig. 11). From our simulations, it appears that, for a
Saturn mass or Jupiter mass planet on a circular orbit, an
![]() of 0.1 is already
too high to keep the resonant clumps visible. On the other hand,
planets above 2 Jupiter masses have a large enough depletion rate
to keep the resonant clumps visible with an
of 0.1 is already
too high to keep the resonant clumps visible. On the other hand,
planets above 2 Jupiter masses have a large enough depletion rate
to keep the resonant clumps visible with an
![]() up
to 0.2. These results show that the resonant structures are as
sensitive to the planet eccentricity as to the planetesimals eccentricity.
up
to 0.2. These results show that the resonant structures are as
sensitive to the planet eccentricity as to the planetesimals eccentricity.
In practice, the differences between our results and those of Kuchner & Holman (2003) are more due to the initial planetesimal distribution in the disk than to the physical process. In their P-R drag scenario, the authors assume that the dust starts migrating inwards far away from the planet, outside the 2:1 resonance, while our planetary migration scenario assumes the planetesimals to be initially closer to the planet. If we started with planetesimals at a larger distance, we would have expected to see, as in the P-R drag scenario, more differences in the resonant structures for planets of different masses.
Our results show that, with the forced planetary migration scenario, it is easy to distinguish a planet on a circular orbit from another on a low-eccentricity orbit, except for very low mass planets or very massive planets, because the resonant structures are drastically different. Constraining the planetary mass is more difficult than in the P-R drag scenario and only an order of magnitude can be expected.
![\begin{figure}
\par\resizebox{8.8cm}{!}{\includegraphics[angle=-90,width=0.48\te...
...}{!}{\includegraphics[angle=-90,width=0.48\textwidth]{7934f79.eps}}
\end{figure}](/articles/aa/full/2008/11/aa7934-07/img50.gif) |
Figure 11: A Saturn mass planet on a circular orbit migrating outward a dynamically warm disk. Initial eccentricities of planetesimals are uniformly distributed between 0 and 0.2. The plotting conventions are the same as in Figs. 2 and 3. (See the electronic edition of the Journal for a color version of this figure.) |
Wyatt (2003) used this scenario to reproduce Vega disk observations at submillimetric wavelengths (Holland et al. 1998). We must take into account that, with the large SCUBA PSF, only the two major clumps can be observed. However, this is enough to distinguish between our three planet mass examples, at least for a migration rate of 0.5 AU Myr-1:
Contradictions however appear between our simulation results and this
previous study. The asymmetry in
the emission of the two observed clumps was interpreted as the migration
of a Neptune mass planet by Wyatt (2003). In his model, a Neptune can trap
planetesimals in the 3:2 and 2:1 resonances and generate two asymmetric
clumps, like a Saturn mass planet in our simulations. With our
numerical model, we have found that a Neptune mass planet cannot trap planetesimals
in the 2:1 resonance, but only in the 3:2 resonance: the two clumps are thus
symmetric and cannot reproduce the Vega
disk. A Neptune mass planet at a migration rate of about 0.5 AU Myr-1 lies at the sharp transition between a 0 and a ![]() trapping probability (Wyatt 2003, Fig. 4a). A small change in the planetary mass or the migration
rate in this configuration produces a large modification in the
population of this resonance. As Wyatt (2003) uses a
scaling law to predict the trapping probability, differences between our results may be explained by the approximation of this scaling law.
trapping probability (Wyatt 2003, Fig. 4a). A small change in the planetary mass or the migration
rate in this configuration produces a large modification in the
population of this resonance. As Wyatt (2003) uses a
scaling law to predict the trapping probability, differences between our results may be explained by the approximation of this scaling law.
Nevertheless, the 2:1 resonance has an interesting behavior in the Neptune mass planet case: it perturbs all the planetesimals that cross it, but as soon as they reach an eccentricity of about 0.02 (in 0.25 Myr), most of them escape. While a Saturn mass planet (or a more massive one) cleans up the space between the initial and final position of the 2:1 resonance during the migration by trapping all the planetesimals, a Neptune mass planet only slightly rises the eccentricity of planetesimals entering the 2:1 resonance during the migration process (Fig. 12).
This phenomenon is better seen when the planetesimal trajectories are drawn in a semi-major axis, eccentricity diagram where the semi-major axis of the planetesimals are in units of that of the planet, in order to hide the migration, as in Fig. 13. All the planetesimals initially have roughly the same trajectory (they move from right to left because they do not migrate), but the small variations have a strong impact when the planetesimals cross the resonance. Some planetesimals remain trapped in the MMR, while others escape after being temporarily perturbed. However, within each of these two subgroups, nearly all planetesimals have similar behavior: the permanently trapped planetesimals have the same libration amplitude and the temporarily perturbed planetesimals escape the resonance roughly at the same eccentricity.
The width (in semi-major axis) of an
MMR is proportional to the square root of the planetary mass (Beust & Morbidelli 1996). A Saturn
mass planet therefore has wider resonances than a Neptune mass planet:
its trapping probability is thus larger because it is less sensitive
to the orbital parameters of the planetesimals which cross the MMR.
![\begin{figure}
\par\begin{tabular}{c}
\resizebox{8.5cm}{!}{\includegraphics[angl...
...graphics[angle=-90,width=0.48\textwidth]{7934f82.eps}}\end{tabular}
\end{figure}](/articles/aa/full/2008/11/aa7934-07/img52.gif) |
Figure 12: Capture in the 2:1 resonance for a Neptune mass planet ( top), en Earth mass planet ( middle) and a Saturn mass planet ( bottom), all on a circular orbit, after 5 Myr. Dashed lines show the position of the resonance at the beginning and at the end of the simulations. In those simulations, an Earth mass planet does not capture at all planetesimals while a Saturn mass planet traps all of them. A Neptune mass planet only traps a fraction of the planetesimals but gives a small kick in eccentricity for the others. The plotting conventions are the same as in Fig. 3. (See the electronic edition of the Journal for a color version of this figure.) |
In this paper, we have only discussed the spatial distribution of the planetesimals. However, it is the dust produced by collisions between these planetesimals, and not the planetesimals themselves, that contributes to the emitted flux and therefore to the observed disk shape. One has to investigate the influence of the collisions on the dust spatial distribution in order to reproduce the observations. Collisions can have several consequences for the dust particles:
These questions can be resolved by better modeling the origin and the evolution of planetary migration. In any realistic simulation, the orbit of the planet will be subject to secular evolution. There is even no need for other planets for this. The interaction with the disk particles themselves can be sufficient to significantly affect the planetary orbit. Thus taking into account the influence of the disk on the planets is necessary to derive realistic simulations. Several studies have already discussed the origin of planetary migration either by ``planet-planetesimals'' (Gomes et al. 2004; Ida et al. 2000) interactions or by ``planet-planet'' interactions (Morbidelli et al. 2006). Depending on the scenario and on the initial conditions, one can observe migration on low-eccentricity orbit or more chaotic migration after a short time on an eccentric orbit.
We have studied the problem of the presence of observable structures in planetesimal disks due to mean motion resonance with an unseen planet migrating outward in the disk. Using numerical simulations, we have explored a large range of parameters for the planet (mass and orbital eccentricity) and the disk (initial distribution of planetesimal eccentricities). In the case of a planet on a circular orbit migrating inside a dynamically cold disk, our results are in agreement with previous analytical studies.
In the cases not already addressed, namely planets on eccentric orbits or dynamically warm disks, we have found that the observability of resonant structures demands very specific orbital configurations. The clumps produced by MMRs with a planet on a circular orbit are smoothed in the case of a planet on an even moderately eccentric orbit. An eccentricity as low as 0.05 is enough to smooth all the resonant structures, except for the most massive planets. These results indicate that although trapping planetesimals in MMRs is an efficient mechanism to generate clumpy disks, stringent conditions must be fulfilled for this scenario to occur. Theoretical modeling of the origin of theplanetary migration therefore will have to explain how planetary systems can remain under these conditions. Moreover, we only consider a planet migrating at a constant rate. A more realistic model with a variable, stochastic migration rate can reduce the population of resonances and thus their observability. A better model of planet migration thus should be developed in future studies.
Acknowledgements
We are grateful to Philippe Thebault, Alexander V. Krivov and Martina Queck for enlightening discussions about dust collisions in debris disk. We also thank Alessandro Morbidelli, Jens Rodmann and the anonymous referee for helpful comments on this paper. Most of the computations presented in this paper were performed at the Service Commun de Calcul Intensif de l'Observatoire de Grenoble (SCCI).
![\begin{figure}\makebox[\textwidth]{
\includegraphics[angle=-90,width=0.33\textwi...
...il
\includegraphics[angle=-90,width=0.33\textwidth]{7934f37.eps} }\end{figure}](/articles/aa/full/2008/11/aa7934-07/img55.gif) |
Figure 4:
Same as Fig. 2, for
similar planets, but on a low-eccentricity orbit (
|
![\begin{figure}\makebox[\textwidth]{
\includegraphics[angle=-90,width=0.33\textwi...
...includegraphics[angle=-90,width=0.33\textwidth]{7934f49.eps} } \\\end{figure}](/articles/aa/full/2008/11/aa7934-07/img56.gif) |
Figure 5:
Same as Fig. 3, for
similar planets, but on a low-eccentricity orbit (
|
![\begin{figure}\makebox[\textwidth]{
\includegraphics[angle=-90,width=0.33\textwi...
...includegraphics[angle=-90,width=0.33\textwidth]{7934f61.eps} } \\\end{figure}](/articles/aa/full/2008/11/aa7934-07/img57.gif) |
Figure 6:
Same as Fig. 2, for
similar planets, but on a moderate eccentricity orbit (
|
![\begin{figure}\makebox[\textwidth]{
\includegraphics[angle=-90,width=0.33\textwi...
...includegraphics[angle=-90,width=0.33\textwidth]{7934f73.eps} } \\\end{figure}](/articles/aa/full/2008/11/aa7934-07/img58.gif) |
Figure 7:
Same as Fig. 3, for
similar planets, but on a moderate eccentricity orbit (
|
| Mig. ratea | Massb | Ecc. | Surv. planetesimalsc | Disk shaped | Mig. ratea | Massb | Ecc. | Surv. planetesimalsc | Disk shaped |
| 0.5 | 0.0035 | 0.0 | None | 0.5 | 0.05 | 0.0 | I | ||
| 0.01 | None | 0.01 | I | ||||||
| 0.05 | None | 0.05 | II | ||||||
| 0.1 | None | 0.1 | None | ||||||
| 0.2 | None | 0.2 | None | ||||||
| 0.3 | None | 0.3 | None | ||||||
| 0.4 | III | 0.4 | None | ||||||
| 0.5 | III | 0.5 | None | ||||||
| 0.6 | III | 0.6 | None | ||||||
| 0.7 | III | 0.7 | None | ||||||
| 0.5 | 0.33 | 0.0 | I | 0.5 | 1 | 0.0 | I | ||
| 0.01 | I | 0.01 | I | ||||||
| 0.05 | II | 0.05 | II | ||||||
| 0.1 | None | 0.1 | II | ||||||
| 0.2 | None | 0.2 | None | ||||||
| 0.3 | None | 0.3 | None | ||||||
| 0.4 | None | 0.4 | None | ||||||
| 0.5 | None | 0.5 | None | ||||||
| 0.6 | None | 0.6 | None | ||||||
| 0.7 | None | 0.7 | None | ||||||
| 0.5 | 2 | 0.0 | I | 0.5 | 3 | 0.0 | I | ||
| 0.01 | I | 0.01 | I | ||||||
| 0.05 | I | 0.05 | I | ||||||
| 0.1 | II | 0.1 | I | ||||||
| 0.2 | None | 0.2 | None | ||||||
| 0.3 | None | 0.3 | None | ||||||
| 0.4 | None | 0.4 | None | ||||||
| 0.5 | None | 0.5 | None | ||||||
| 0.6 | None | 0.6 | None | ||||||
| 0.7 | None | 0.7 | None |
|
a In AU Myr-1. b In Jovian mass. c Fraction of surviving planetesimals at the end of the simulation, i.e. 40 Myr. d As in Fig. 10. |
| Mig. ratea | Massb | Ecc. | Surv. planetesimalsc | Disk shaped | Mig. ratea | Massb | Ecc. | Surv. planetesimalsc | Disk shaped |
| 5 | 0.035 | 0.0 | None | 5 | 0.05 | 0.0 | I | ||
| 0.01 | None | 0.01 | II | ||||||
| 0.05 | None | 0.05 | II | ||||||
| 0.1 | None | 0.1 | None | ||||||
| 0.2 | None | 0.2 | None | ||||||
| 5 | 0.33 | 0.0 | I | 5 | 1 | 0.0 | I | ||
| 0.01 | I | 0.01 | I | ||||||
| 0.05 | II | 0.05 | II | ||||||
| 0.1 | II | 0.1 | II | ||||||
| 0.2 | None | 0.2 | None | ||||||
| 5 | 2 | 0.0 | I | 5 | 3 | 0.0 | I | ||
| 0.01 | I | 0.01 | I | ||||||
| 0.05 | I | 0.05 | I | ||||||
| 0.1 | II | 0.1 | I | ||||||
| 0.2 | None | 0.2 | None | ||||||
| 0.05 | 0.035 | 0.0 | II | 0.05 | 0.05 | 0.0 | I | ||
| 0.01 | II | 0.01 | I | ||||||
| 0.05 | None | 0.05 | II | ||||||
| 0.1 | None | 0.1 | II | ||||||
| 0.2 | None | 0.2 | None | ||||||
| 0.05 | 0.33 | 0.0 | I | 0.05 | 1 | 0.0 | I | ||
| 0.01 | I | 0.01 | I | ||||||
| 0.05 | II | 0.05 | II | ||||||
| 0.1 | II | 0.1 | II | ||||||
| 0.2 | None | 0.2 | None | ||||||
| 0.05 | 2 | 0.0 | I | 0.05 | 3 | 0.0 | I | ||
| 0.01 | I | 0.01 | I | ||||||
| 0.05 | I | 0.05 | I | ||||||
| 0.1 | II | 0.1 | None | ||||||
| 0.2 | None | 0.2 | None |
|
a In AU Myr-1. b In Jovian mass. c Fraction of surviving planetesimals at the end of the simulation, i.e. 4 Myr for 5 AU Myr-1 migration rate and 200 Myr for 0.05 AU Myr-1. d As in Fig. 10. |
| Max. ecc.a | Massb | Ecc. | Surv. planetesimalsc | Disk shaped | Max. ecc.a | Massb | Ecc. | Surv. planetesimalsc | Disk shaped |
| 0.1 | 0.035 | 0.0 | None | 0.1 | 0.05 | 0.0 | II | ||
| 0.01 | None | 0.01 | None | ||||||
| 0.05 | None | 0.05 | None | ||||||
| 0.1 | None | 0.1 | None | ||||||
| 0.2 | None | 0.2 | None | ||||||
| 0.1 | 0.33 | 0.0 | II | 0.1 | 1 | 0.0 | I | ||
| 0.01 | II | 0.01 | II | ||||||
| 0.05 | II | 0.05 | II | ||||||
| 0.1 | None | 0.1 | II | ||||||
| 0.2 | None | 0.2 | None | ||||||
| 0.1 | 2 | 0.0 | I | 0.1 | 3 | 0.0 | I | ||
| 0.01 | I | 0.01 | I | ||||||
| 0.05 | I | 0.05 | I | ||||||
| 0.1 | II | 0.1 | I | ||||||
| 0.2 | None | 0.2 | None | ||||||
| 0.2 | 2 | 0.0 | I | 0.2 | 3 | 0.0 | I | ||
| 0.01 | I | 0.01 | I | ||||||
| 0.05 | I | 0.05 | I | ||||||
| 0.1 | I | 0.1 | I | ||||||
| 0.2 | None | 0.2 | None |
|
a For planetesimals. b In Jovian mass. c Fraction of surviving planetesimals at the end of the simulation, i.e. 40 Myr. d As in Fig. 10. |
![\begin{figure}
\par\makebox[\textwidth] {
\includegraphics[angle=-90,width=0.33\...
...includegraphics[angle=-90,width=0.33\textwidth]{7934f13.eps} } \\\end{figure}](/articles/aa/full/2008/11/aa7934-07/img21.gif)
![\begin{figure}
\par\makebox[12truecm]{
\includegraphics[width=5.9truecm]{7934f74.eps}\hfil
\includegraphics[width=5.9truecm]{7934f75.eps} }\end{figure}](/articles/aa/full/2008/11/aa7934-07/img29.gif)
![\begin{figure}
\par\resizebox{8.8cm}{!}{\includegraphics[angle=-90,width=0.48\textwidth]{7934f83.eps}}\\\end{figure}](/articles/aa/full/2008/11/aa7934-07/img53.gif)