A&A 480, 115-131 (2008)
DOI: 10.1051/0004-6361:20066733
J.-U. Pott1,2 - A. Eckart1 - A. Glindemann2 - R. Schödel1 - T. Viehmann1 - M. Robberto3
1 - I. Physikalisches Institut, University of Cologne, Zülpicher Str. 77, 50937 Köln, Germany
2 -
European Southern Observatory (ESO),
Karl-Schwarzschildstr. 2, 85748 Garching bei
München, Germany
3 -
Space Telescope Science Institute, 3700 San Martin Drive,
Baltimore, MD 21218, USA
Received 10 November 2006 / Accepted 26 October 2007
Abstract
Context. GCIRS 3 is the most prominent MIR-source in the central parsec of the Galaxy. NIR spectroscopy has failed to solve the enigma of its nature. The properties and peculiarities of extreme individual objects in the central stellar cluster contribute to our knowledge of star and dust formation close to a supermassive black hole.
Aims. We initiated an unprecedented interferometric experiment to understand the nature of GCIRS 3, where we investigate its properties as a spectroscopic and interferometric reference star at 10 ![]() m.
m.
Methods. VLT/VISIR imaging separates a compact source from diffuse, surrounding emission. The VLTI/MIDI instrument was used to measure spectroscopically resolved visibility moduli at an angular resolution of ![]() 10 mas of that compact 10
10 mas of that compact 10 ![]() m source, still unresolved by a single VLT. Recent NIR/MIR photometry data were added to enable simple SED- and full radiative transfer-modeling of the data.
m source, still unresolved by a single VLT. Recent NIR/MIR photometry data were added to enable simple SED- and full radiative transfer-modeling of the data.
Results. The luminosity and size estimates show that IRS 3 is probably a cool carbon star enshrouded by a complex dust distribution. Blackbody temperatures were derived. The coinciding interpretation of single telescope and interferometric data confirm dust emission from several different spatial scales. The interferometric data resolve the inner rim of dust formation. Despite observed deep silicate absorption towards GCIRS 3, we favor a carbon-rich circumstellar dust shell. The silicate absorption most probably takes place in the outer diffuse dust, which is mostly ignored by MIDI measurements, but very observable in complementary VLT/VISIR data. This indicates physically and chemically distinct conditions of the local dust, changing with the distance to GCIRS 3.
Conclusions. We have demonstrated that optical long baseline interferometry at infrared wavelengths is an indispensable tool for investigating sources at the Galactic center. Our findings suggest further studies of the composition of interstellar dust and the shape of the 10 ![]() m silicate feature in this extraordinary region.
m silicate feature in this extraordinary region.
Key words: Galaxy: center - ISM: dust, extinction - stars: supergiants - instrumentation: interferometers
At a distance of ![]() 7.6 kpc
(Eisenhauer et al. 2005), the center of the Milky Way is by far the closest center of a large
spiral galaxy.
Its astrophysical properties can be studied on a unique angular scale of
7.6 kpc
(Eisenhauer et al. 2005), the center of the Milky Way is by far the closest center of a large
spiral galaxy.
Its astrophysical properties can be studied on a unique angular scale of
![]() 40 mpc/arcsec, which is two orders of magnitude smaller than the
angular scale at the nucleus of M 31, the next comparable
galaxy (McConnachie et al. 2005).
Star formation and the kinematics of
the central stellar cluster can be studied in the region of direct
influence of the supermassive black hole (SMBH) at the
dynamic center of the Milky Way
(Eckart & Genzel 1996; Schödel et al. 2002; Ghez et al. 2000).
40 mpc/arcsec, which is two orders of magnitude smaller than the
angular scale at the nucleus of M 31, the next comparable
galaxy (McConnachie et al. 2005).
Star formation and the kinematics of
the central stellar cluster can be studied in the region of direct
influence of the supermassive black hole (SMBH) at the
dynamic center of the Milky Way
(Eckart & Genzel 1996; Schödel et al. 2002; Ghez et al. 2000).
![\begin{figure}
\par\includegraphics[width=8.8cm]{6733fi01.eps}
\end{figure}](/articles/aa/full/2008/10/aa6733-06/img23.gif) |
Figure 1:
Flux-calibrated Lucy-Richardson deconvolved image at
8.59 |
| Open with DEXTER | |
The recent advent of mid infrared![]() (MIR) instruments on 8 m class
telescopes enables us to study in detail the thermal dust at the Galactic
center (GC) at unprecedented angular resolution.
The investigation of the
circum- and interstellar dust distribution at the GC uncovers
stellar mass loss, zones of wind interaction, formation history, evolution, and kinematics.
(MIR) instruments on 8 m class
telescopes enables us to study in detail the thermal dust at the Galactic
center (GC) at unprecedented angular resolution.
The investigation of the
circum- and interstellar dust distribution at the GC uncovers
stellar mass loss, zones of wind interaction, formation history, evolution, and kinematics.
Photometric and spectral properties of dusty stars at the
GC have recently been published by Moultaka et al. (2004) and Viehmann et al. (2006,2005).
Despite an average optical extinction of
![]() (Viehmann et al. 2005; Scoville et al. 2003), near-infrared
spectroscopy and imaging reveal the nature
of the underlying dust-embedded stars in most cases, since the dust extinction
is wavelength-dependent and decreases from the optical towards longer wavelengths.
(Viehmann et al. 2005; Scoville et al. 2003), near-infrared
spectroscopy and imaging reveal the nature
of the underlying dust-embedded stars in most cases, since the dust extinction
is wavelength-dependent and decreases from the optical towards longer wavelengths.
This article focuses on the most prominent of the MIR bright dusty sources,
IRS 3, the
embedded stellar source, which still
eludes any spectral classification
(Tanner et al. 2006; Paumard et al. 2006).
It is located within the central 20
![]() .
A recent state-of-the-art narrow-band MIR image at 8.6
.
A recent state-of-the-art narrow-band MIR image at 8.6 ![]() m with an angular resolution of
only 250 mas is shown in Fig. 1.
The extended and diffuse dust
emission surrounding IRS 3 is visible at unprecedented angular resolution in this image.
m with an angular resolution of
only 250 mas is shown in Fig. 1.
The extended and diffuse dust
emission surrounding IRS 3 is visible at unprecedented angular resolution in this image.
The NIR extinction studies
reveal a spatial variation of
only ![]() 10% (
10% (
![]() )
of the interstellar
extinction over this region
(Schödel et al. 2007a; Scoville et al. 2003; Moultaka et al. 2004).
)
of the interstellar
extinction over this region
(Schödel et al. 2007a; Scoville et al. 2003; Moultaka et al. 2004).
In contrast, narrow-band, N-band photometry and spectroscopic
observations are interpreted to indicate a significant amount of
additional 10 ![]() m silicate absorption along the line of sight towards
IRS 3 with respect to other parts of the central 20
m silicate absorption along the line of sight towards
IRS 3 with respect to other parts of the central 20
![]() (Becklin et al. 1978; Roche & Aitken 1985; Viehmann et al. 2006).
The published intrinsic optical depths of about
(Becklin et al. 1978; Roche & Aitken 1985; Viehmann et al. 2006).
The published intrinsic optical depths of about
![]() ,
in addition to the average
,
in addition to the average
![]() (e.g. Roche & Aitken 1985), still underestimate the true
value due to source confusion problems. While our new high-resolution VISIR data clearly
indicate that more than 50% of the N-flux is diffuse, extended
emission at 0.3
(e.g. Roche & Aitken 1985), still underestimate the true
value due to source confusion problems. While our new high-resolution VISIR data clearly
indicate that more than 50% of the N-flux is diffuse, extended
emission at 0.3
![]() resolution, one byproduct of the MIDI observations
is the calibrated, low-resolution spectra of the compact emission, which show
resolution, one byproduct of the MIDI observations
is the calibrated, low-resolution spectra of the compact emission, which show
![]() (IRS 3)
to be much larger than the value given above.
(IRS 3)
to be much larger than the value given above.
Rieke et al. (1978) found the spectro-photometric MIR
properties of IRS 3 to resemble either young stars or OH/IR stars.
The latter interpretation is opposed by the lack of OH-maser emission.
With an MIR color temperature of ![]() 400 K, the central emission of IRS 3 was found to be
(together with the nearby GCIRS 7) the hottest and most compact of
the sources dominating the thermal dust irradiation from the GC (Rieke et al. 1978; Smith et al. 1990; Gezari et al. 1985).
Extended dust emission around IRS 3 interacting with external
stellar winds has been found in recent L- and M-band observations (Viehmann et al. 2005).
While hot star hypotheses are given by some authors
(Tanner et al. 2003; Krabbe et al. 1995), the lack of ionizing gas leads Roche & Aitken (1985) to the
assumption of IRS 3 being a cool dust-enshrouded star.
400 K, the central emission of IRS 3 was found to be
(together with the nearby GCIRS 7) the hottest and most compact of
the sources dominating the thermal dust irradiation from the GC (Rieke et al. 1978; Smith et al. 1990; Gezari et al. 1985).
Extended dust emission around IRS 3 interacting with external
stellar winds has been found in recent L- and M-band observations (Viehmann et al. 2005).
While hot star hypotheses are given by some authors
(Tanner et al. 2003; Krabbe et al. 1995), the lack of ionizing gas leads Roche & Aitken (1985) to the
assumption of IRS 3 being a cool dust-enshrouded star.
Within the past two years we collected a unique dataset of optical
long-baseline interferometric (OLBI) data of IRS 3 at 10 ![]() m.
These constitute the first successful OLBI observation of an object
within the central parsec of our galaxy, opening the window to NIR/MIR
GC observations at highest angular
resolution (Pott et al. 2005a).
In this article we show that the OLBI data strongly support the
former hypothesis of a cool dust-enshrouded star. Furthermore our
results shed light on the amount and spectral shape of the
interstellar 10
m.
These constitute the first successful OLBI observation of an object
within the central parsec of our galaxy, opening the window to NIR/MIR
GC observations at highest angular
resolution (Pott et al. 2005a).
In this article we show that the OLBI data strongly support the
former hypothesis of a cool dust-enshrouded star. Furthermore our
results shed light on the amount and spectral shape of the
interstellar 10 ![]() m extinction towards IRS 3 at unprecedented
angular resolution.
Since MIDI is a relatively new instrument, the
achievable precision of visibility measurements of such distant, challenging
targets is not common knowledge yet.
In Sect. 2 we therefore describe the
observations, the extensive data-reduction and calibration efforts,
and the evaluation of different data reduction techniques in some detail to
ease and stimulate similar experiments and the comparison of their outcomes.
Then the immediate observational results are given
(Sect. 3), followed by a detailed discussion of the results in the astrophysical context (Sect. 4) and a summary of our conclusions in Sect. 5.
m extinction towards IRS 3 at unprecedented
angular resolution.
Since MIDI is a relatively new instrument, the
achievable precision of visibility measurements of such distant, challenging
targets is not common knowledge yet.
In Sect. 2 we therefore describe the
observations, the extensive data-reduction and calibration efforts,
and the evaluation of different data reduction techniques in some detail to
ease and stimulate similar experiments and the comparison of their outcomes.
Then the immediate observational results are given
(Sect. 3), followed by a detailed discussion of the results in the astrophysical context (Sect. 4) and a summary of our conclusions in Sect. 5.
In 2004 we started an observing campaign to study the brightest MIR-excess sources in the central parsec with MIDI at the highest angular resolution available today.
The MID-Infrared interferometric instrument (MIDI) combines the light of two 8.2 m unit telescopes of the ESO Paranal Observatory in Chile (Leinert et al. 2003).
We used the standard
![]() slit and dispersed the light over the entire N-band (8-13
slit and dispersed the light over the entire N-band (8-13 ![]() m) with the prism providing a spectral resolution of
m) with the prism providing a spectral resolution of ![]() .
The first MIR fringes of IRS 3 were recorded successfully
on the night of 7 July 2004.
The whole dataset comprises 14 independent visibility measurements of
IRS 3 with interlaced calibration measurements.
The projected baseline length (PB) and position angle (PA) of each measurement are given in Table 1
for the beginning of the fringe measurement. The last column gives
the median relative uncertainty obtained for the calibrated
visibility outside the low-flux region of the silicate absorption.
.
The first MIR fringes of IRS 3 were recorded successfully
on the night of 7 July 2004.
The whole dataset comprises 14 independent visibility measurements of
IRS 3 with interlaced calibration measurements.
The projected baseline length (PB) and position angle (PA) of each measurement are given in Table 1
for the beginning of the fringe measurement. The last column gives
the median relative uncertainty obtained for the calibrated
visibility outside the low-flux region of the silicate absorption.
In Table 2 we list the used calibrators with their main features.
The angular diameter ascertainments result from fitting A TLAS9 and
M ARCS model atmosphere spectral energy distributions (SEDs) to optical and NIR photometry.
The chosen models (Kurucz 1994,1992; Plez et al. 1992) adopt solar metallicity.
Details of the model fitting are given in van Boekel (2004, Chap. 5).
The modeled 12 ![]() m flux densities listed in Table 2 are consistent within
m flux densities listed in Table 2 are consistent within ![]() 5% with the work of Cohen et al. (1999), who present a list of absolutely calibrated infrared spectra.
Furthermore, none of those calibrators shows an MIR-excess, defined as having a measured 12
5% with the work of Cohen et al. (1999), who present a list of absolutely calibrated infrared spectra.
Furthermore, none of those calibrators shows an MIR-excess, defined as having a measured 12 ![]() m flux density more than 3
m flux density more than 3![]() above the synthetic spectra fitted to the optical-NIR data.
Such an MIR-excess would indicate the existence of (extended) dust shells.
Dust shells, which can be expected to exist around K-M giants, radiate
the stellar flux at longer wavelengths and decrease the visibility
amplitudes of the entire object; i.e., they deteriorate the calibrator properties.
The absence of an MIR-excess also makes all visibility calibrators usable as potential photometric calibrators, down to the 5% uncertainty, which is often not reached due to atmospheric and instrumental variability.
The photometric variability and the fitting uncertainty of the angular diameter of all the calibration stars in Table 2 affect the accuracy of the derived transfer functions by less then 1% at all VLTI baselines (
above the synthetic spectra fitted to the optical-NIR data.
Such an MIR-excess would indicate the existence of (extended) dust shells.
Dust shells, which can be expected to exist around K-M giants, radiate
the stellar flux at longer wavelengths and decrease the visibility
amplitudes of the entire object; i.e., they deteriorate the calibrator properties.
The absence of an MIR-excess also makes all visibility calibrators usable as potential photometric calibrators, down to the 5% uncertainty, which is often not reached due to atmospheric and instrumental variability.
The photometric variability and the fitting uncertainty of the angular diameter of all the calibration stars in Table 2 affect the accuracy of the derived transfer functions by less then 1% at all VLTI baselines (![]() 200 m).
200 m).
Table 1:
Observing log of IRS 3. The wavelength
dependent ![]() has been estimated for each night on
the basis of regularly conducted calibrator measurements, typically
about once per hour (Sect. 2). The number of calibrators used per night is
given, and the applied parameters are given in Table 2.
has been estimated for each night on
the basis of regularly conducted calibrator measurements, typically
about once per hour (Sect. 2). The number of calibrators used per night is
given, and the applied parameters are given in Table 2.
Table 2: Parameters of the calibrators used for estimating the transfer function.
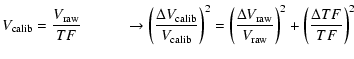
The immediate measurand, the raw visibility
![]() ,
is the ratio of measured correlated (
,
is the ratio of measured correlated (![]() )
and total flux (
)
and total flux (![]() ).
The final quantity of interest is the calibrated visibility (
).
The final quantity of interest is the calibrated visibility (
![]() ), which is computed by dividing the raw visibility (
), which is computed by dividing the raw visibility (
![]() )
by the interferometric transfer function (
)
by the interferometric transfer function (![]() )
of the observation.
Propagation of errors relates the uncertainties
)
of the observation.
Propagation of errors relates the uncertainties ![]() to each other:
to each other:
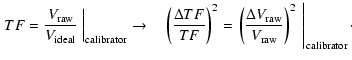
All constant defects of
![]() are corrected for by
multiplication with
are corrected for by
multiplication with ![]() and thus have only a minor influence on the final accuracy; e.g., the time delay between the measurement of
and thus have only a minor influence on the final accuracy; e.g., the time delay between the measurement of ![]() and
and ![]() is only used a few minutes in the high-sensitivity mode of MIDI.
This reduces the variation of atmospheric transmission in the thermal
infrared, due to airmass difference and temporal fluctuations, to such a
level that a small and time-constant impact on the quotient
is only used a few minutes in the high-sensitivity mode of MIDI.
This reduces the variation of atmospheric transmission in the thermal
infrared, due to airmass difference and temporal fluctuations, to such a
level that a small and time-constant impact on the quotient ![]() /
/![]() can be assumed.
We prove this by the following test, visualized in
Fig. 5. If the atmospheric and instrumental flux
transmission change randomly at a significant level between the
can be assumed.
We prove this by the following test, visualized in
Fig. 5. If the atmospheric and instrumental flux
transmission change randomly at a significant level between the ![]() and
and ![]() measurements, the orders of magnitude of
measurements, the orders of magnitude of
![]() and the
resulting
and the
resulting ![]() are affected and the absolute accuracy of the calibrated
visibility is worse than the relative spectral accuracy.
To derive this spectral accuracy we linearly normalize each individual
are affected and the absolute accuracy of the calibrated
visibility is worse than the relative spectral accuracy.
To derive this spectral accuracy we linearly normalize each individual ![]() of
a night by dividing through the integral over a fixed part of the
N-band and estimate the maximum scatter in each spectral
channel. If this scatter is significantly smaller than the scatter
of the normalization factors, a strong transmission variability has
been observed (assuming constant intrinsic
visibility). Figure 5 shows that
this is not the case. Note in the same figure the increase in the shape error around the
atmospheric ozone absorption band at 9.7
of
a night by dividing through the integral over a fixed part of the
N-band and estimate the maximum scatter in each spectral
channel. If this scatter is significantly smaller than the scatter
of the normalization factors, a strong transmission variability has
been observed (assuming constant intrinsic
visibility). Figure 5 shows that
this is not the case. Note in the same figure the increase in the shape error around the
atmospheric ozone absorption band at 9.7 ![]() m and at the borders
of the N-band, where the applicability of simple linear normalization decreases.
m and at the borders
of the N-band, where the applicability of simple linear normalization decreases.
Faulty and unequal background suppression during reduction of both data sets also does not vary on a significant level for the bright calibrator stars. The influence of background noise for faint science targets is discussed at the end of the section.
As a matter of fact, Leinert et al. (2004) state that the accuracy of
![]() is dominated by the accuracy of the overlap between the
interfering beams, which critically relies on the wavefront
corrections during observations.
This is difficult to quantify and thus cannot be easily incorporated into the
is dominated by the accuracy of the overlap between the
interfering beams, which critically relies on the wavefront
corrections during observations.
This is difficult to quantify and thus cannot be easily incorporated into the ![]() .
Usually the quality of the
beam overlap does not vary statistically during one observation.
This means that there is no mean overlap accuracy to correctly describe a
single observation and that the
.
Usually the quality of the
beam overlap does not vary statistically during one observation.
This means that there is no mean overlap accuracy to correctly describe a
single observation and that the ![]() ,
if derived from one calibrator
measurement, may not be applicable to a subsequent science observation.
We confirm this on the basis of our dataset.
A single observation of both
,
if derived from one calibrator
measurement, may not be applicable to a subsequent science observation.
We confirm this on the basis of our dataset.
A single observation of both ![]() and
and ![]() consists of
several frames that are averaged during data reduction.
We estimate
the standard deviation of the subsequent scans and analyze the
background in chopped photometry data to derive a statistical
uncertainty for each measurement of
consists of
several frames that are averaged during data reduction.
We estimate
the standard deviation of the subsequent scans and analyze the
background in chopped photometry data to derive a statistical
uncertainty for each measurement of
![]() .
The resulting total statistical uncertainty
.
The resulting total statistical uncertainty
![]() is similar for the individual calibrator observations, but it
cannot fully explain the larger scatter of individually
estimated
is similar for the individual calibrator observations, but it
cannot fully explain the larger scatter of individually
estimated ![]() over the respective observing night.
Figure 4 demonstrates that the standard deviation over several calibrators is only as small as expected from the estimated uncertainty of the individual measurements (
over the respective observing night.
Figure 4 demonstrates that the standard deviation over several calibrators is only as small as expected from the estimated uncertainty of the individual measurements (![]() 5%), if outliers are rejected from the average.
That means that the absolute accuracy of the visibility measurement
can change significantly with each new pointing.
5%), if outliers are rejected from the average.
That means that the absolute accuracy of the visibility measurement
can change significantly with each new pointing.
Furthermore, the overnight scatter of ![]() is significantly reduced in the 2005
data due to the more stable VLTI feeding by the higher-order AO-system
M ACAO instead of the earlier tip-tilt-only correction of the
S TRAP units (Arsenault et al. 2003). This also confirms the
dominating influence of varying beam overlap and flux concentration
between different pointings on the visibility accuracy.
is significantly reduced in the 2005
data due to the more stable VLTI feeding by the higher-order AO-system
M ACAO instead of the earlier tip-tilt-only correction of the
S TRAP units (Arsenault et al. 2003). This also confirms the
dominating influence of varying beam overlap and flux concentration
between different pointings on the visibility accuracy.
The above given tests and considerations underline the origin of the
accuracy of the
![]() measurement and justify the accuracy of a single measurement only being given by the
measurement and justify the accuracy of a single measurement only being given by the ![]() statistics of several calibrator measurements.
We calculated the mean and standard deviation of the different
statistics of several calibrator measurements.
We calculated the mean and standard deviation of the different ![]() to quantify
to quantify ![]() and
and
![]() .
Note that the presented estimation of errors even holds for an extended
calibrator with visibilities significantly lower than one, provided
that the diameter of the calibrator is known at sufficient precision. Although
.
Note that the presented estimation of errors even holds for an extended
calibrator with visibilities significantly lower than one, provided
that the diameter of the calibrator is known at sufficient precision. Although
![]() will systematically change over the night with changing projected baseline length, this effect is annihilated by calculating
will systematically change over the night with changing projected baseline length, this effect is annihilated by calculating ![]() (Eq. (2)).
(Eq. (2)).
Since the number of calibrators per night is typically around 8, one ![]() strongly deviating from the others can influence the mean and standard deviation significantly.
To avoid this situation we did not use the median, but rejected the anomalous
strongly deviating from the others can influence the mean and standard deviation significantly.
To avoid this situation we did not use the median, but rejected the anomalous ![]() manually (on average one per night, Fig. 4).
This has the advantage that the mean and standard deviation of the
resulting sample better represents the spectral shape of the
manually (on average one per night, Fig. 4).
This has the advantage that the mean and standard deviation of the
resulting sample better represents the spectral shape of the ![]() reducing the probability of artificial spectral features in the calibrated visibility spectrum.
reducing the probability of artificial spectral features in the calibrated visibility spectrum.
To complete Eq. (1), we have to know the relative uncertainty of
![]() of the measured target.
Qualitatively the origin is similar, as discussed above for the calibrators,
but the flux of the science targets can be significantly smaller than the calibrator fluxes.
Since our calibrators cover a range of 5-35 Jy, we searched for any flux dependence of
of the measured target.
Qualitatively the origin is similar, as discussed above for the calibrators,
but the flux of the science targets can be significantly smaller than the calibrator fluxes.
Since our calibrators cover a range of 5-35 Jy, we searched for any flux dependence of
![]() on the basis of our data.
We checked for every night whether on average the scatter of
the
on the basis of our data.
We checked for every night whether on average the scatter of
the ![]() of
the fainter calibrators is greater than the scatter of the
of
the fainter calibrators is greater than the scatter of the ![]() of brighter ones, but did not find any such flux dependence.
Thus we assume a flux-independent relative uncertainty of
of brighter ones, but did not find any such flux dependence.
Thus we assume a flux-independent relative uncertainty of
![]() resulting in the uncertainty of the calibrated visibility:
resulting in the uncertainty of the calibrated visibility:
If the correlated flux drops significantly below 5 Jy and
approaches the sensitivity limits, an increase in the relative
uncertainties will probably occur due to the increased influence of
noise; but outside the deep silicate absorption, the correlated spectrum of IRS 3 is above this limit.
Furthermore, imperfect background subtraction has an increasing
influence on the final accuracy with decreasing source flux.
To account for this, we estimated the background level by reducing
sky-frames without the source.
Typically the background randomly varies between zero and a value
close to
![]() ,
where
,
where
![]() is the sum of the mean and
standard deviation of all spectral channels of the background frames.
This leads to a maximum background induced error interval of
is the sum of the mean and
standard deviation of all spectral channels of the background frames.
This leads to a maximum background induced error interval of
 |
(4) |
We used the data reduction package M IA+E WS provided by
the MIDI consortium![]() .
This package offers two different methods for reducing the data: incoherent averaging of the fringe power in each spectral bin over several scans, and coherent averaging of the single dispersed scans.
In the N-band, the latter method can provide the differential phase
information in addition to the visibility amplitude, if the atmospheric and instrumental delay and dispersion have been removed properly.
A more detailed description of both methods and their realization in M IA+E WS is given by Leinert et al. (2004) and Jaffe (2004), respectively.
Since noise always contributes positively to the power spectrum,
it is not automatically reduced by averaging incoherently over
several scans. In contrast, the coherent integration reduces the
statistical noise of the fringe data by averaging, which makes this
method favorable at very low correlated flux (below about 1 Jy) and
low SNR.
Correlated fluxes down to 0.1 Jy could be estimated by this method (Jaffe, private communication).
Since our MIDI data is usually well above this limit, we found consistent results of both reduction algorithms throughout the complete dataset (Fig. 2).
.
This package offers two different methods for reducing the data: incoherent averaging of the fringe power in each spectral bin over several scans, and coherent averaging of the single dispersed scans.
In the N-band, the latter method can provide the differential phase
information in addition to the visibility amplitude, if the atmospheric and instrumental delay and dispersion have been removed properly.
A more detailed description of both methods and their realization in M IA+E WS is given by Leinert et al. (2004) and Jaffe (2004), respectively.
Since noise always contributes positively to the power spectrum,
it is not automatically reduced by averaging incoherently over
several scans. In contrast, the coherent integration reduces the
statistical noise of the fringe data by averaging, which makes this
method favorable at very low correlated flux (below about 1 Jy) and
low SNR.
Correlated fluxes down to 0.1 Jy could be estimated by this method (Jaffe, private communication).
Since our MIDI data is usually well above this limit, we found consistent results of both reduction algorithms throughout the complete dataset (Fig. 2).
The constantly changing baseline projection due to earth rotation
limits the integration times of the ![]() measurement.
To reduce the noise
level, which is intrinsically high in the thermal infrared, only the pixels with the highest SNR should be considered by the
reduction algorithm. This is achieved by detector aperture masks,
which can lead to reduced SNR if the chosen aperture is too large,
too small, or misplaced with respect to the incident source photons.
This effect is strongly enhanced by beam distortions and motions that are only partially corrected by the AO system, which
holds especially for our data since we had to lock the AO on an off-axis guide star 35
measurement.
To reduce the noise
level, which is intrinsically high in the thermal infrared, only the pixels with the highest SNR should be considered by the
reduction algorithm. This is achieved by detector aperture masks,
which can lead to reduced SNR if the chosen aperture is too large,
too small, or misplaced with respect to the incident source photons.
This effect is strongly enhanced by beam distortions and motions that are only partially corrected by the AO system, which
holds especially for our data since we had to lock the AO on an off-axis guide star 35
![]() away from the GC.
Therefore we reduced the full dataset four times: with both coherent
and incoherent fringe averaging and by applying two different
apertures (or detector masks), a wide standard one with fixed location and width
and a narrower one that is chosen dynamically for the PSF of every
observation to trace the beam maximum and to
have an optimized width (this is the narrow mask in Fig. 2).
away from the GC.
Therefore we reduced the full dataset four times: with both coherent
and incoherent fringe averaging and by applying two different
apertures (or detector masks), a wide standard one with fixed location and width
and a narrower one that is chosen dynamically for the PSF of every
observation to trace the beam maximum and to
have an optimized width (this is the narrow mask in Fig. 2).
After calibrating the data and estimating its accuracy as described in Sect. 2.2, the four spectra
![]() were averaged.
To estimate the accuracy conservatively, we selected a maximum
were averaged.
To estimate the accuracy conservatively, we selected a maximum
![]() including all four uncertainty intervals
(Fig. 2).
including all four uncertainty intervals
(Fig. 2).
![\begin{figure}
\par\includegraphics[width=8.8cm]{6733fi02.eps}
\end{figure}](/articles/aa/full/2008/10/aa6733-06/img51.gif) |
Figure 2: Part of the science data taken on 2005-05-25. We overplot the different reduction methods (coherent and incoherent fringe averaging and static and dynamic detector apertures) to demonstrate the different results. The labelling indicates the artificial wavelength shifts successively applied to increase the readability of the plot. The relative errors of each method is given. The rightmost error bars present the merged, maximum error bars. We based our analysis on these merged data. |
| Open with DEXTER | |
![\begin{figure}
\includegraphics[width=8.8cm]{6733fi03.eps}
\end{figure}](/articles/aa/full/2008/10/aa6733-06/img52.gif) |
Figure 3:
The influence of faulty background estimation on the final
accuracy for data from 2005-05-25. The
standard reduction is plotted (solid line) with respective uncertainties (small errorbars to the right of larger ones).
It suggests a significant
deviation from a smooth, flat visibility spectrum (dotted line: weighted quadratic fit over the silicate absorption
feature). In particular the visibility increase (solid line) at
|
| Open with DEXTER | |
![\begin{figure}
\par\includegraphics[width=8.5cm]{6733fi04.eps}
\end{figure}](/articles/aa/full/2008/10/aa6733-06/img53.gif) |
Figure 4:
Transfer functions in gray, derived
from the individual calibrator measurements of 2005-05-25. The error
bars around 5% indicate the statistical error of the single
data frames of one measurement, which is slightly smaller than the absolute variation in the |
| Open with DEXTER | |
![\begin{figure}
\par\includegraphics[width=8.5cm]{6733fi05.eps}
\end{figure}](/articles/aa/full/2008/10/aa6733-06/img54.gif) |
Figure 5:
Different analyses of the |
| Open with DEXTER | |
Note that the apparent correlation between systematically higher visibilities and the use of the narrower mask in this figure is not a general systematic effect, but depends on the data set. Other data show an apparent correlation between visibility and averaging method, independent of the chosen mask. Consequently we do not prefer one single reduction method over another but use the merged data. Furthermore, the differences are significant with respect to the intrinsic uncertainties, resulting in clearly increased uncertainties of the merged data. The mean final relative accuracy of each merged scientific dataset is given in Table 1.
The Gaussian detector masks (Sect. 2.3) that are typically applied do not affect the visibility calculation but only the photometry. If the science target is not completely unresolved by the single telescope PSF (Fig. 14) or if such a weighting mask is not well-centered on the brightest pixels, the measured flux is decreased. We reduced the photometry separately without applying any mask to take care of any such bias. Furthermore, it turned out that a lot of datasets on the target have at least one beam of significantly lower quality than the other one. Since the calibrator measurements do not show such a strong beam variation, this effect is assumed to result from the use of an off-axis AO guide star during the observations of IRS 3, decreasing the accuracy of the wave-front correction (Sect. 2.3). A manual selection of good datasets facilitates a final photo-spectrometric accuracy of less than 10%, which is decreased towards low fluxes due to the remaining background. The result is shown in the lower spectrum in Fig. 10).
Table 3:
Measured mean visibility moduli below and above the
silicate absorption, centered at 9.8 ![]() m.
m.
![\begin{figure}
\par\includegraphics[width=8.8cm]{6733fi06.eps}
\end{figure}](/articles/aa/full/2008/10/aa6733-06/img56.gif) |
Figure 6: Calibrated visibility spectra ordered following the interferometric resolution to show the dependence on the projected baseline length (given to the right). Each curve is plotted in a different style. For the sake of clarity we plotted only errorbars for the solid curves, and the other curves have uncertainties on a similar relative scale. The gray dotted lines show the used linear interpolation over the deep silicate absorption, where we do not have reliable data. Note the different scaling of the panels. |
| Open with DEXTER | |
The measured visibility moduli are given in Table 3. Following Sect. 2.2 we did not find within the uncertainties any deviation from a smooth visibility slope over the full N-band. Since no correlated fluxes have been measured at the center of the silicate absorption, we give the mean visibility and its accuracy for two adjacent wavelength intervals in Table 3. The fully calibrated visibility spectra are shown in Fig. 6. Note the two outliers at the bottom of the upper and the middle panels. With respect to their projected baseline length, they show visibilities too low to be consistent with the other data. This is most probably an artefact due to bad beam overlap at those observing times.
![\begin{figure}
\par\includegraphics[width=8cm]{6733fi07.eps}
\end{figure}](/articles/aa/full/2008/10/aa6733-06/img57.gif) |
Figure 7:
uv-coverage of all our observations. The overplotted ring
indicates a uv-radius of 5 M |
| Open with DEXTER | |
| |
Figure 8:
Measured visibilities at a uv-radius of 5 M |
| Open with DEXTER | |
![\begin{figure}
\par\includegraphics[width=8.8cm]{6733fi09.eps}\par\includegraphics[width=8.8cm]{6733fi10.eps}
\end{figure}](/articles/aa/full/2008/10/aa6733-06/img59.gif) |
Figure 9:
Azimuthal data average in both panels. Upper panel: error bars represent the data taken at 8.5 (gray) and 12.5 |
| Open with DEXTER | |
Circular symmetry in uv-space implies circular symmetry of the
brightness distribution.
To probe the variation in the measured visibility with changing position angle (PA), we compared our
data at a fixed uv-radius, where most data were obtained.
In Fig. 7 we show the uv-coverage of the entire dataset,
overplotted with a ring of constant uv-radius (5 M![]() ).
Note that the definition of uv-radius (=projected
baselinelength/observing wavelength) leads to radial lines in the figure and to the situation where along the circle datapoints at different PA might be observed at different wavelengths.
The uv-radius gives the angular resolution and should
show similar visibilities at different PA in the case of
circular symmetry.
In Fig. 8 the mean visibilities at
).
Note that the definition of uv-radius (=projected
baselinelength/observing wavelength) leads to radial lines in the figure and to the situation where along the circle datapoints at different PA might be observed at different wavelengths.
The uv-radius gives the angular resolution and should
show similar visibilities at different PA in the case of
circular symmetry.
In Fig. 8 the mean visibilities at
![]() 5 M
5 M![]() of each dataset are plotted.
The overplotted horizontal indicates that the full dataset still conforms
to total circular symmetry.
Although some data points do not perfectly coincide with circular
symmetry, it has to be remembered that the shown error bars of single
measurements may be underestimated, since their estimation relies on
averaging several calibrator measurements of the observing night,
leading to an average uncertainty that may be exceeded in individual cases.
of each dataset are plotted.
The overplotted horizontal indicates that the full dataset still conforms
to total circular symmetry.
Although some data points do not perfectly coincide with circular
symmetry, it has to be remembered that the shown error bars of single
measurements may be underestimated, since their estimation relies on
averaging several calibrator measurements of the observing night,
leading to an average uncertainty that may be exceeded in individual cases.
On the other hand, the drawn horizontal shows that a slight deviation
from circular symmetry is possible.
The values around PA = (
![]() )
appear to lie on average
below the values at smaller PA.
Possible reasons for such circular asymmetry are discussed in
Sect. 4.4.
)
appear to lie on average
below the values at smaller PA.
Possible reasons for such circular asymmetry are discussed in
Sect. 4.4.
But it has to be mentioned that the data points with the best photometric quality (used to fit the horizontal in Fig. 8) have nearly identical visibilities at different PA. And a comparison with the uv-coverage (Fig. 7) shows that the longer wavelength spectral channels have been considered at those PA with a tendency towards lower visibilities (Fig. 8), i.e. the possibly indicated deviation from circular symmetry in Fig. 8 might in fact derive from the slightly wavelength-dependent size of IRS 3. We do not expect to observe wavelength-dependent sizes due to line emission or absorption of a certain layer, since the visibility spectrum over the N-band is apparently free of spectral line features within the uncertainties.
But a slight change in the shape and the size scale of the brightness distribution of the dust can be expected due to typically lower temperatures of larger, outer dust layers dominating at longer wavelengths. This interpretation can easily explain the deviations from perfect circular symmetry in Fig. 8 and is further backed up by a slight increase of size with wavelength indicated by the wavelength dependent analysis of the data (Sect. 3.4.2).
Circular symmetry implies a vanishing differential phase, which remains in the data after coherent
averaging and calibration. We did not find differential phases
along the N-band spectrum larger than the remaining scatter of less than ![]() 5
5![]() around zero. Based on the circular symmetry found, we show the PA-averaged data plotted
over the uv-radius in the lower panel of Fig. 9.
Also the black solid line in both panels is the wavelength average of all data and lies smoothly between data sets at 8.5
around zero. Based on the circular symmetry found, we show the PA-averaged data plotted
over the uv-radius in the lower panel of Fig. 9.
Also the black solid line in both panels is the wavelength average of all data and lies smoothly between data sets at 8.5 ![]() and 12.5
and 12.5 ![]() m (upper panel).
This instead indicates a slight size increase in the brightness distribution with wavelength than a qualitative change because the overall trend of the visibility with baseline length coding the brightness distribution is similar over the N-band.
m (upper panel).
This instead indicates a slight size increase in the brightness distribution with wavelength than a qualitative change because the overall trend of the visibility with baseline length coding the brightness distribution is similar over the N-band.
Naturally the merged data represent an average brightness distribution at the cost of losing the slight wavelength-dependence but gaining additional and more accurate datapoints, since we can use all spectral channels together.
Note in the lower panel in Fig. 9 that statistical data averaging at one uv-radius normally reduces the errorbars with respect to the original data.
The wavelength-averaged data is used only in Sect. 3.4.1 to derive an overall description of the underlying brightness distribution, which itself is used as a basis for describing the wavelength dependence of IRS 3 by fitting the average model to the wavelength-dependent data (Sect. 3.4.2).
The three datasets of highest photometric quality are
highlighted.
This suggests that, beyond ![]() 6 M
6 M![]() ,
the averaged uv-data
(black solid line) indicate visibilities, which are too low since they lie below the best
data.
,
the averaged uv-data
(black solid line) indicate visibilities, which are too low since they lie below the best
data.
![\begin{figure}
\par\includegraphics[width=8.8cm]{6733fi11.eps}
\end{figure}](/articles/aa/full/2008/10/aa6733-06/img62.gif) |
Figure 10:
Flux-calibrated and dereddened photometry. The upper
spectrum is dereddened with
|
| Open with DEXTER | |
In Fig. 10, the flux-calibrated spectrum of IRS 3 is shown based on the reduction described in Sect. 2.4. Only the data of best photometric quality and AO correction have been taken into account. The three resulting data sets, observed in July 2004, May 2005, and June 2005, do not show significant photometric variability beyond the general uncertainties. This agrees with the study of flux-variable sources in the GC by Ott et al. (1999), who find no variability for IRS 3.
| |
Figure 11: Best-fit models of the brightness distribution with a single component model; left panel shows a uniform disc, right panel shows a Gaussian. The angular diameter is indicated. |
| Open with DEXTER | |
![\begin{figure}
\par\includegraphics[width=8.8cm]{6733fi13.eps}\par\includegraphics[width=8.8cm]{6733fi14.eps}
\end{figure}](/articles/aa/full/2008/10/aa6733-06/img64.gif) |
Figure 12: Best-fit models of the brightness distribution with a two-component model. Up: two uniform disc components; bottom: two Gaussian components. The error bars are the azimuthally averaged data (Fig. 9, Sect. 3.4.1). In addition, the probed spatial scales are indicated by vertical lines. To the right of each of these lines, the visibility of a Gaussian component of the indicated FWHM would contribute less than 10% of its flux. The dashed line stems from a model adding a third Gaussian of arbitrary size larger than 80 mas and illustrates that up to 40% of the total flux could have been resolved out by the interferometer. |
| Open with DEXTER | |
In this section we explain the MIDI data by a model for the brightness distribution, which is as simple as possible, but as complex as needed. Although the results cannot compete with detailed radiative transfer models, they summarize the average order-of-magnitude properties in terms of morphological shape, size, and flux. Such a heuristic model is therefore an important check and starting point for further analysis, discussion, and interpretation of the data (Sect. 4). Thanks to the large multi-wavelength data set, we get a non-trivial model of the dust distribution around IRS 3.
Following the results of Sect. 3.2, we assume a circularly symmetric brightness distribution, at first of a wavelength-independent size, to derive the general shape of the brightness distribution. The full dataset is shown in a radial uv-plot in Fig. 9. The two simplest, but often applicable, circularly symmetric brightness distributions are a uniform disc and a Gaussian. Figure 11 demonstrates that the visibility moduli cannot be described by such a simple single component. Despite the conservative error estimates, neither model can reproduce the data even approximately.
In contrast, two superposed components of different
sizes and flux ratios are sufficient to model the data (Fig. 12).
Both two uniform discs and two Gaussians
fit the
error bars satisfactorily, but the Gaussians are closer to the measured data: the
reduced best-fit ![]() is about ten times smaller for the two-Gaussian model.
Furthermore, the data reduction indicates that the visibility at low uv-radii (
is about ten times smaller for the two-Gaussian model.
Furthermore, the data reduction indicates that the visibility at low uv-radii (![]() 2.5 M
2.5 M![]() )
is probably overestimated and should be expected to
lie in
the lower half of the indicated error bars.
This would favor a Gaussian shape for the larger component.
But as shown by the dashed line in the lower panel of Fig. 12, the intermediate 50 mas spatial scales are relatively loosely constrained to contribute between 20% and 70% of the total flux detected by MIDI. Up to 40% of the total flux could have been resolved out by the interferometer due to the lack of shorter baseline information.
Since with the current visibility dataset there are no means to further constrain the outer flux contributions, we stay with the two component model representing the data and outline where further analysis suggest that indeed some source flux could have been resolved out (Sect. 4.3).
However, the measured correlated flux at the higher spatial frequencies (the smaller component of the model), which is most important for the further analysis and contributes about one third of the total flux, are not significantly influenced by this uncertainty.
)
is probably overestimated and should be expected to
lie in
the lower half of the indicated error bars.
This would favor a Gaussian shape for the larger component.
But as shown by the dashed line in the lower panel of Fig. 12, the intermediate 50 mas spatial scales are relatively loosely constrained to contribute between 20% and 70% of the total flux detected by MIDI. Up to 40% of the total flux could have been resolved out by the interferometer due to the lack of shorter baseline information.
Since with the current visibility dataset there are no means to further constrain the outer flux contributions, we stay with the two component model representing the data and outline where further analysis suggest that indeed some source flux could have been resolved out (Sect. 4.3).
However, the measured correlated flux at the higher spatial frequencies (the smaller component of the model), which is most important for the further analysis and contributes about one third of the total flux, are not significantly influenced by this uncertainty.
At longer uv-radii the smaller component dominates.
A closer coincidence with the data suggests a Gaussian shape for the
smaller component, too.
But the final distinction between Gaussian and disc shape of the smaller
component requires additional data at longer baselines.
In the case of a uniform disc, the visibility would increase again around
![]() 10 M
10 M
![]() as indicated by the overplotted model in
Fig 12 (upper panel).
We investigated the uv-space
as indicated by the overplotted model in
Fig 12 (upper panel).
We investigated the uv-space ![]() 12 M
12 M
![]() with the
longest UT-baseline (UT1-4: 130 m) without fringe detection.
This might support a Gaussian shape for the smaller component.
But it is also possible that the visibility increase, indicative of a
uniform disc shape of the inner component, was too small to be
detected with these long baselines. However, this non-detection at the long baseline supports the primary finding of our source modeling that the spatial scales of the smaller component are also resolved by the VLTI leading to significant constraints on the physical interpretation of the data (Sect. 4).
with the
longest UT-baseline (UT1-4: 130 m) without fringe detection.
This might support a Gaussian shape for the smaller component.
But it is also possible that the visibility increase, indicative of a
uniform disc shape of the inner component, was too small to be
detected with these long baselines. However, this non-detection at the long baseline supports the primary finding of our source modeling that the spatial scales of the smaller component are also resolved by the VLTI leading to significant constraints on the physical interpretation of the data (Sect. 4).
At this point there is no indication that the two Gaussian components used to represent the data must stand for two physically distinct entities, such as two dust layers of different radii. At the moment they simply appear convenient for describing the data, and the larger Gaussian can be seen as representing the wings of the observed brightness distribution. In the later sections, physical parameters such as flux-calibrated spectra and derived temperatures support the idea of several physical components, but a more complicatedly shaped single structure cannot be completely excluded. In general the situation is similar to analyzing the uv-data of radio-interferometric observations (e.g. of a quasar radio jet in Pott et al. 2005b), where Gaussian components are used to represent mean properties of the observed structure, such as size, flux, and location. To avoid confusion we simply keep referring to the two Gaussians as being two components. This understanding is further supported by the later analysis.
The spectroscopically resolved MIDI data allow the investigation of wavelength dependence of the observed brightness distribution. We base this analysis on the two-Gaussian model of the previous section, since it fits the wavelength-averaged data set perfectly. A model-independent analysis of the observed brightness distribution by Fourier-transforming the data (based on the fundamental van Cittert-Zernike theorem of interferometry, e.g. Labeyrie et al. 2006) confirms of our model approach, but the limited spatial frequency coverage hampers further model-independent conclusions from such an analysis. We describe the existing wavelength-dependence of the data in terms of changing sizes and relative flux contributions of the two Gaussians, keeping the comment at the end of the previous section in mind. Furthermore, the change of the fit parameters with wavelength turns out to be reasonably smooth (Fig. 13). This finding backs the application of the wavelength-independent model of Sect. 3.4.1 as a basis for fitting the wavelength dependence.
We fit intensity and size of two superposed Gaussians to the data
(Fig. 13).
We bin the data to a 0.5 ![]() m sampling, using error-weighted
visibility averages.
The unreliable data around the center of the silicate absorption are
interpolated using a
m sampling, using error-weighted
visibility averages.
The unreliable data around the center of the silicate absorption are
interpolated using a ![]() -fit of a quadratic curve to the spectral channels of good
SNR.
In Fig. 6 the individual regions of reliable data are indicated by
error bars. The interpolated data are used in the central
wavelength interval only, which is devoid of error bars.
The respective dependence of the
visibilities on the
position angle is more visible in Fig. 8.
-fit of a quadratic curve to the spectral channels of good
SNR.
In Fig. 6 the individual regions of reliable data are indicated by
error bars. The interpolated data are used in the central
wavelength interval only, which is devoid of error bars.
The respective dependence of the
visibilities on the
position angle is more visible in Fig. 8.
In Fig. 13 the resulting best-fit parameters are shown.
Using ![]() -minimization, the uncertainties of the fit are nearly the same as the scatter of the data around the overplotted linear correlations.
A slightly larger systematic uncertainty might be introduced by the
estimated errors of the individual data points.
To address this, we re-fit the data with increased weighting of the
three datasets of best photometric quality.
The overall trends are similar, but the size of the larger component in the two-component model approach may be
underestimated in Fig. 13 by 5-10 mas, which indicates more flux on low spatial frequencies. The
FWHM of the smaller component,
-minimization, the uncertainties of the fit are nearly the same as the scatter of the data around the overplotted linear correlations.
A slightly larger systematic uncertainty might be introduced by the
estimated errors of the individual data points.
To address this, we re-fit the data with increased weighting of the
three datasets of best photometric quality.
The overall trends are similar, but the size of the larger component in the two-component model approach may be
underestimated in Fig. 13 by 5-10 mas, which indicates more flux on low spatial frequencies. The
FWHM of the smaller component,
![]() ,
may
show a slight size-increase with wavelength by about 3 mas, and the
flux ratio increases towards the smaller component (
,
may
show a slight size-increase with wavelength by about 3 mas, and the
flux ratio increases towards the smaller component (
![]() ).
This increased flux ratio can be understood by lower
photometric quality, typically decreasing the average visibility due to
an imperfect beam overlap.
But a decreased visibility means increased relative brightness of the larger component.
Thus, probably a few of the data sets of lower photometric quality systematically show visibilities that are too small, thus
artificially implying structures that are less concentrated than the real ones
(see the bottom curves of the upper and central panel of Fig. 6, which apparently do not follow the visibility trend of the other curves with respect to the baseline lengths).
).
This increased flux ratio can be understood by lower
photometric quality, typically decreasing the average visibility due to
an imperfect beam overlap.
But a decreased visibility means increased relative brightness of the larger component.
Thus, probably a few of the data sets of lower photometric quality systematically show visibilities that are too small, thus
artificially implying structures that are less concentrated than the real ones
(see the bottom curves of the upper and central panel of Fig. 6, which apparently do not follow the visibility trend of the other curves with respect to the baseline lengths).
The most intriguing result is that the smaller component (
![]() )
shows a roughly constant
FWHM of about 18 mas, while the larger
shows a significant linear size increase with wavelength.
This might be an indication that we directly resolve the inner
zone of dust formation at all
wavelengths, which has a fixed size, and that the dust
shell might be carbon-rich (Ivezic & Elitzur 1996b).
)
shows a roughly constant
FWHM of about 18 mas, while the larger
shows a significant linear size increase with wavelength.
This might be an indication that we directly resolve the inner
zone of dust formation at all
wavelengths, which has a fixed size, and that the dust
shell might be carbon-rich (Ivezic & Elitzur 1996b).
![\begin{figure}
\par\includegraphics[width=8.8cm]{6733fi15.eps}\par\includegraphics[width=8.8cm]{6733fi16.eps}
\end{figure}](/articles/aa/full/2008/10/aa6733-06/img70.gif) |
Figure 13:
Wavelength-dependent model consisting of two Gaussians.
The trends are discussed in the
text. Around 10 |
| Open with DEXTER | |
Furthermore, the relative flux contribution of the larger component increases with wavelength, suggesting that the larger component represents the outer, cooler dust around the central object. Again this is a more qualitative statement. The second component stands for the more extended flux of IRS 3, its properties average over the conditions at the outer parts, but a smooth transition between the inner and outer regions around the star cannot be excluded. Temperatures and luminosities of dust on the size scales of both components are derived in Sect. 4.3 based purely on the interferometric data.
![\begin{figure}
\par\includegraphics[width=17cm]{6733fi17.eps}
\end{figure}](/articles/aa/full/2008/10/aa6733-06/img71.gif) |
Figure 14:
Our VISIR 8.6 |
| Open with DEXTER | |
Following the most recent published results, we assume a spectral profile of
the interstellar absorption towards the GC, as published by
Moneti et al. (2001), and an average visual extinction of
![]() towards the GC
(Viehmann et al. 2005; Scoville et al. 2003). Moneti et al. (2001) incorporated
into their model that the mean interstellar dust towards
sources in the central 2 pc of the Galaxy shows a relatively stronger silicate absorption than in
the solar neighborhood (Roche & Aitken 1985).
towards the GC
(Viehmann et al. 2005; Scoville et al. 2003). Moneti et al. (2001) incorporated
into their model that the mean interstellar dust towards
sources in the central 2 pc of the Galaxy shows a relatively stronger silicate absorption than in
the solar neighborhood (Roche & Aitken 1985).
In the NIR no strong local increase in the interstellar extinction towards the region of IRS 3 is found (e.g. most recently confirmed by Schödel et al. 2007a). However, several authors claim additional silicate absorption in the N-band only along the line of sight to IRS 3, possibly intrinsic to the source (e.g. Roche & Aitken 1985; Viehmann et al. 2006).
A first glimpse of the probable location of this additional
extinction is given by our high-resolution single-telescope N-band
imaging with the new VLT/VISIR instrument.
In Fig. 14 the
complete emission of IRS 3 (left panel), unresolved by earlier imaging, is
clearly resolved into a diffuse and a compact component (central and right panels, respectively).
Although the
total diffuse flux is even larger than the compact flux, its surface
brightness is very low and hidden in the noise of all MIDI
data due to the shorter integration times.
Thus most of the diffuse flux is not included in the single-telescope MIDI photometry (
![]() ), although it is observed
at similar spatial resolution to the VISIR data.
Therefore the flux-calibrated MIDI
), although it is observed
at similar spatial resolution to the VISIR data.
Therefore the flux-calibrated MIDI ![]() spectrum (Fig. 10) fits the unresolved flux shown in the right panel.
The two components, fitted to the interferometric data
(including the possible fraction of fully resolved flux; Sect. 3.4) and discussed in the following sections,
together make up the unresolved emission in the right panel of Fig. 14, since the single-telescope observations provide an angular resolution of about 250 mas.
To clarify the situation, we speak of local, interstellar silicate
absorption in addition to the GC average, if the absorbing silicate
is located in the dust, which radiates the diffuse
emission that is directly visible only in the VISIR data. In contrast, absorption in the inner dust components,
resolved by the MIDI flux and visibility estimates, is labeled as intrinsic, circumstellar absorption.
spectrum (Fig. 10) fits the unresolved flux shown in the right panel.
The two components, fitted to the interferometric data
(including the possible fraction of fully resolved flux; Sect. 3.4) and discussed in the following sections,
together make up the unresolved emission in the right panel of Fig. 14, since the single-telescope observations provide an angular resolution of about 250 mas.
To clarify the situation, we speak of local, interstellar silicate
absorption in addition to the GC average, if the absorbing silicate
is located in the dust, which radiates the diffuse
emission that is directly visible only in the VISIR data. In contrast, absorption in the inner dust components,
resolved by the MIDI flux and visibility estimates, is labeled as intrinsic, circumstellar absorption.
Our MIDI spectro-photometry confirms the existence of a broad 9.8 ![]() m silicate absorption feature
remaining in the data after correction for standard
GC extinction.
We show the measured spectrum in Fig. 10 (lower curve).
For the dereddening of the spectrum, we used the
m silicate absorption feature
remaining in the data after correction for standard
GC extinction.
We show the measured spectrum in Fig. 10 (lower curve).
For the dereddening of the spectrum, we used the ![]() Cep emission profile of
the silicate feature, as realized in the extinction law by
Moneti et al. (2001) for lines of sight to the GC.
Several authors state that this profile matches both
the local ISM absorption and the GC interstellar silicate absorption
profile best
(although at different relative optical depths; Roche & Aitken 1985; Chiar & Tielens 2006; Roche & Aitken 1984).
Cep emission profile of
the silicate feature, as realized in the extinction law by
Moneti et al. (2001) for lines of sight to the GC.
Several authors state that this profile matches both
the local ISM absorption and the GC interstellar silicate absorption
profile best
(although at different relative optical depths; Roche & Aitken 1985; Chiar & Tielens 2006; Roche & Aitken 1984).
Our IRS 3 spectrum of a spectral resolution of R=30 shows this
coincidence perfectly.
We reddened a single blackbody of variable temperature with an
absorption spectrum of the normalized shape of the silicate feature
seen in emission towards ![]() Cep (see Moneti et al. 2001)
and a variable optical depth
Cep (see Moneti et al. 2001)
and a variable optical depth
![]() .
The shapes of the observed and dereddened spectra coincide with the
spectra shown by Roche & Aitken (1985) (Fig. 10).
The best
.
The shapes of the observed and dereddened spectra coincide with the
spectra shown by Roche & Aitken (1985) (Fig. 10).
The best ![]() -fitted parameters are a blackbody temperature of
-fitted parameters are a blackbody temperature of
![]() and
and
![]() .
This temperature resembles other N-band measurements (e.g. Gezari et al. 1985, found a
color-temperature of about 400 K), but is below the 800 K derived from
K-
and L-band data (Moultaka et al. 2004).
This indicates that a single blackbody may not be appropriate for describing the
complete NIR-MIR SED.
Although the hotter component, dominating the K- and L-band, cannot be
resolved against the cooler outer dust shell by the single telescope
spectrum or image at 10
.
This temperature resembles other N-band measurements (e.g. Gezari et al. 1985, found a
color-temperature of about 400 K), but is below the 800 K derived from
K-
and L-band data (Moultaka et al. 2004).
This indicates that a single blackbody may not be appropriate for describing the
complete NIR-MIR SED.
Although the hotter component, dominating the K- and L-band, cannot be
resolved against the cooler outer dust shell by the single telescope
spectrum or image at 10 ![]() m with additional SED information, our interferometric 10
m with additional SED information, our interferometric 10 ![]() m data alone can resolve it (Sect. 4.3).
m data alone can resolve it (Sect. 4.3).
![\begin{figure}
\par\includegraphics[width=8cm]{6733fi18.eps}
\end{figure}](/articles/aa/full/2008/10/aa6733-06/img75.gif) |
Figure 15:
Zoom of the lower spectrum in Fig. 10 into the wavelength interval of
the 11.3 |
| Open with DEXTER | |
Since the center of the absorption feature is hidden in the noise of
the background subtraction, a certain level of uncertainty remains
in the estimation of
![]() ,
but the spectrophotometric quality
of the wings is good enough to exclude
,
but the spectrophotometric quality
of the wings is good enough to exclude
![]() .
Assuming
.
Assuming
![]() ,
this means
,
this means
![]() .
This is a remarkable result, since it doubles the silicate MIR
optical depth towards IRS 3 with respect to the average of the
GC region
(
.
This is a remarkable result, since it doubles the silicate MIR
optical depth towards IRS 3 with respect to the average of the
GC region
(
![]() ;
Roche & Aitken 1985), which itself is twice as deep as
;
Roche & Aitken 1985), which itself is twice as deep as
![]() in the solar neighborhood.
This is shown by the middle spectrum in Fig. 10, which
is the measured spectrum corrected for standard GC values of extinction
(
in the solar neighborhood.
This is shown by the middle spectrum in Fig. 10, which
is the measured spectrum corrected for standard GC values of extinction
(
![]() and
and
![]() ). The remaining
silicate absorption is obvious.
The aforementioned authors quantify for the first time an extra
). The remaining
silicate absorption is obvious.
The aforementioned authors quantify for the first time an extra
![]() for IRS 3 in addition to already enhanced the GC-average.
Although the spectral resolution of both datasets is comparable, the
spatial resolution of the MIDI photometry data
for IRS 3 in addition to already enhanced the GC-average.
Although the spectral resolution of both datasets is comparable, the
spatial resolution of the MIDI photometry data![]() is increased by at least an order
of magnitude.
is increased by at least an order
of magnitude.
In addition, at 11.3 ![]() m a significant drop in the data below the fit
is suggested (Fig. 15), even on the logarithmic scale shown in Fig. 10.
This further absorption feature, in addition to the dominating broad
silicate absorption, can be attributed to SiC,
which peaks around 11.3
m a significant drop in the data below the fit
is suggested (Fig. 15), even on the logarithmic scale shown in Fig. 10.
This further absorption feature, in addition to the dominating broad
silicate absorption, can be attributed to SiC,
which peaks around 11.3 ![]() m and has a much narrower spectral width than the
interstellar silicate feature.
If we exclude the data from the wavelength region around 11.3
m and has a much narrower spectral width than the
interstellar silicate feature.
If we exclude the data from the wavelength region around 11.3 ![]() m for the
m for the ![]() minimization, the discrepancy
between data and fit around the center of the SiC feature
becomes even stronger, although the fitted temperature
and
minimization, the discrepancy
between data and fit around the center of the SiC feature
becomes even stronger, although the fitted temperature
and
![]() remain constant in the given interval of uncertainties. This
further supports the existence of a SiC absorption feature towards
IRS 3, but the sampling of the applied extinction law, which does not contain the SiC feature, is with
0.5
remain constant in the given interval of uncertainties. This
further supports the existence of a SiC absorption feature towards
IRS 3, but the sampling of the applied extinction law, which does not contain the SiC feature, is with
0.5 ![]() m at MIR wavelengths not high enough to properly sample the SiC
feature. The kink of the blackbody fit at 11.5
m at MIR wavelengths not high enough to properly sample the SiC
feature. The kink of the blackbody fit at 11.5 ![]() m is probably an artificial feature. Thus a definitive answer regarding the existence of absorbing SiC cannot be given.
m is probably an artificial feature. Thus a definitive answer regarding the existence of absorbing SiC cannot be given.
Arguments against an intrinsic silicate absorption in the immediate circumstellar dusty environment of IRS 3, which could be evoked by a deep O-rich dust shell, are:
Such a lack of an intrinsic, circumstellar silicate-rich dust shell and the deep interstellar silicate absorption would favor the bright IRS 3 to be the primary target for estimating the true spectral shape of the interstellar absorption in the N-band towards central GC sources at the high spatial and spectral resolution now available at ground-based 8 m class telescopes.
![\begin{figure}
\par\includegraphics[width=8.8cm]{6733fi19.eps}
\end{figure}](/articles/aa/full/2008/10/aa6733-06/img83.gif) |
Figure 16:
SED temperature fit (solid line) as the superposition of two spatially unresolved blackbody
SED (dashed lines). The dotted line close to
the cooler and presumably larger |
| Open with DEXTER | |
The MIR regime is dominated by thermal dust emission.
We have shown
in the previous section that the N-band spectrum of IRS 3 can be
fitted convincingly by a single reddened blackbody.
But published studies of stellar dust shells show that the
full infrared photometric information is required to describe the
optical and physical properties of the shells.
Accordingly, we investigated the complete infrared wavelength range from
1.6-20 ![]() m,
available at a spatial resolution sufficient for distinguishing IRS 3 from
other sources.
The corresponding dereddened SED is shown in
Fig. 16.
The bolometric flux ratio indicated in the figure is better
constrained by the MIDI visibility estimates (Sect. 4.3).
m,
available at a spatial resolution sufficient for distinguishing IRS 3 from
other sources.
The corresponding dereddened SED is shown in
Fig. 16.
The bolometric flux ratio indicated in the figure is better
constrained by the MIDI visibility estimates (Sect. 4.3).
A second star close to IRS 3 has recently been classified as a Wolf-Rayet star
(Paumard et al. 2006).
It is unresolved in the published medium-resolution NACO data
(Viehmann et al. 2005), but we confirm this secondary star on
high-resolution NACO images, showing about 30% and less than 10% of
the IRS 3 H- and K-band fluxes, respectively. For our SED fit in
Fig. 16 we used the accordingly reduced published
H magnitude.
Since the companion is located about 120 mas east of IRS 3, its MIR flux
could also contribute to the MIDI data.
But a significant contribution should show up as a binary pattern in
the visibility data (Sect. 4.4), which was not observed.
Thus we assume negligible contamination of the flux of
IRS 3 longward of 2 ![]() m by the WR-star, which is further supported by
the bluer NIR SED of the secondary as measured with NACO and expected for a hot WR.
m by the WR-star, which is further supported by
the bluer NIR SED of the secondary as measured with NACO and expected for a hot WR.
To account for the uncertainties in the amount of interstellar
silicate absorption towards IRS 3 (Sect. 4.1), we used only the MIDI fluxes at 8 and 13 ![]() m outside the 9.8
m outside the 9.8 ![]() m absorption
feature for the
MIR-SED.
All data were dereddened with the Moneti extinction law scaled to
m absorption
feature for the
MIR-SED.
All data were dereddened with the Moneti extinction law scaled to
![]() .
As for the N-band, a broad interstellar silicate
absorption feature is located in the Q-band.
At 20
.
As for the N-band, a broad interstellar silicate
absorption feature is located in the Q-band.
At 20 ![]() m, only narrow-band photometry inside the silicate
absorption was available.
We dereddened this Q-band data by an optical depth of
m, only narrow-band photometry inside the silicate
absorption was available.
We dereddened this Q-band data by an optical depth of
![]() ,
which is derived from scaling the interstellar extinction law to fit our measured
enhanced
,
which is derived from scaling the interstellar extinction law to fit our measured
enhanced
![]() towards IRS 3, exceeding the average
GC values. At least
the
plotted SED data for
towards IRS 3, exceeding the average
GC values. At least
the
plotted SED data for
![]() m should be free of any
significant flux contribution of the diffuse VISIR component, because of
its low surface brightness (Sect. 4.1) and presumably cool temperature. Only the
VISIR Q-band data may contain a fraction of the diffuse flux; although
similar to the MIDI spectra, these Q-band data do not reach
the low noise level of the 8.6
m should be free of any
significant flux contribution of the diffuse VISIR component, because of
its low surface brightness (Sect. 4.1) and presumably cool temperature. Only the
VISIR Q-band data may contain a fraction of the diffuse flux; although
similar to the MIDI spectra, these Q-band data do not reach
the low noise level of the 8.6 ![]() m VISIR imaging data.
m VISIR imaging data.
We successfully fit the extinction-corrected SED with two
blackbody spectra.
The lower temperature, which we attribute to the outer component
(
![]() K), coincides with the single blackbody temperature
fitted to the N-band spectrum alone (Sect. 4.1).
This single blackbody SED is overplotted in Fig. 16, which shows immediately that for
K), coincides with the single blackbody temperature
fitted to the N-band spectrum alone (Sect. 4.1).
This single blackbody SED is overplotted in Fig. 16, which shows immediately that for
![]() m additional flux by hotter dust is required to explain
the measured infrared SED.
This is consistent with the findings of Moultaka et al. (2004), who fitted a blackbody temperature of 800 K to their 2-4
m additional flux by hotter dust is required to explain
the measured infrared SED.
This is consistent with the findings of Moultaka et al. (2004), who fitted a blackbody temperature of 800 K to their 2-4 ![]() m data. That hotter dust emission appears at shorter wavelengths limits the optical depth of the outer cooler dust, assuming that the hotter dust is located inside the cooler dust (see also Sect. 4.3).
The calibration of the Q-band emission, apparently too faint to fit the model,
was very difficult and the deviations can be fully attributed to calibration
errors (Viehmann, priv. communication) including the uncertain amount
of interstellar silicate extinction in that band.
m data. That hotter dust emission appears at shorter wavelengths limits the optical depth of the outer cooler dust, assuming that the hotter dust is located inside the cooler dust (see also Sect. 4.3).
The calibration of the Q-band emission, apparently too faint to fit the model,
was very difficult and the deviations can be fully attributed to calibration
errors (Viehmann, priv. communication) including the uncertain amount
of interstellar silicate extinction in that band.
We can state, summarizing these considerations, that no further blackbody component is needed to model the full near- and mid-infrared SED. In particular this excludes any significant stellar contribution to the NIR fluxes of the SED, emerging from IRS 3 itself or a second star inside the PSF. This leads to two possible interpretations: either the inner and hotter dust component is optically thick at NIR wavelengths avoiding any direct detection of stellar light or the enshrouded star has a very hot continuum emission. The absence of any stellar photospheric lines in NIR spectra of IRS 3 (Tanner et al. 2006) supports the optical thickness of the circumstellar dust at these wavelengths.
In contrast to the previous section, here we present a derivation of temperatures from the spatially resolved MIDI observations in MIR as a further step in interpreting this (and similar) interferometric data.
The simplest morphological interpretation of the data consists of two
circular symmetric Gaussian components enshrouding the same central
object (Sect. 3.4). One-dimensional radiative transfer calculations confirm bell-shaped brightness distributions of circumstellar dust shells
(Ivezic & Elitzur 1996b).
That we can distinguish at least two dust components suggests the outer one is optically thin in the respective wavelengths range and physically separated.
That is, the observed total
flux constitutes of the sum of the flux of both components, adjusted by the optical depth ![]() .
From the observed total fluxes and flux ratios, we calculate the component
fluxes as
.
From the observed total fluxes and flux ratios, we calculate the component
fluxes as
In Table 4 the component fluxes and FWHM-sizes for the
two-Gaussian model of Sect. 3.4 and the temperatures derived here are given:
![]() is the brightness temperature of a spherical blackbody of radius
is the brightness temperature of a spherical blackbody of radius ![]() at GC distance emitting the observed flux, and
at GC distance emitting the observed flux, and
![]() the blackbody color temperature derived solely from the
8-13
the blackbody color temperature derived solely from the
8-13 ![]() m color of each component. We corrected both
component fluxes for an optical depth of the outer shell of
m color of each component. We corrected both
component fluxes for an optical depth of the outer shell of
![]() .
Since typically the optical depths at 8 and 13
.
Since typically the optical depths at 8 and 13 ![]() m
are comparable, the color temperature does not change with
m
are comparable, the color temperature does not change with ![]() .
.
Furthermore, RT calculations of spherical dust shells as used in Sect. 4.5 indicate that a black body spectrum of
![]() often convincingly fits the MIR total spectrum of a dust embedded star, particularly well for carbon-rich dust shells. But the respective
often convincingly fits the MIR total spectrum of a dust embedded star, particularly well for carbon-rich dust shells. But the respective
![]() of such models, calculated again with a Gaussian brightness distribution approximation, is often significantly higher than
of such models, calculated again with a Gaussian brightness distribution approximation, is often significantly higher than
![]() of the same RT model. This is in line with the findings presented in Table 4 showing that the temperatures derived here only give general trends and temperature ranges without imposing tight constraints on the physical temperature.
of the same RT model. This is in line with the findings presented in Table 4 showing that the temperatures derived here only give general trends and temperature ranges without imposing tight constraints on the physical temperature.
We find:
Table 4:
Temperatures from the N-band MIDI data based on size and relative flux estimates of the two-Gaussian model and
![]() of the outer dust.
of the outer dust.
![\begin{figure}
\par\includegraphics[width=8.8cm]{6733fi20.eps}
\end{figure}](/articles/aa/full/2008/10/aa6733-06/img110.gif) |
Figure 17: Visibility patterns for a 120 mas east-west binary at severaluv-radii. The individual components are not resolved. |
| Open with DEXTER | |
In their spectroscopic survey of the central cluster, Paumard et al. (2006) classify the star IRS 3E, only 120 mas east of IRS 3, as a Wolf-Rayet star of type WC 5/6. Since Wolf-Rayet stars of this spectral type are known to be (often strong) dust formers, it is possible that IRS 3E is still visible in the N-band. Additionally its spectral classification as a carbon-rich WC-star does not conflict with our interpretation of the spectral data in terms of a lack of silicate emission.
The visibility pattern of such a binary system with 120 mas separation
and east-west orientation is shown in Fig. 17 for
several
![]() .
The shown pattern has been calculated for two stars of equal
brightness, and both are individually unresolved by the interferometer.
IRS 3 is resolved by MIDI, which would decrease the amplitude of the
variation shown in Fig. 17, but
the variation per PA is defined by the binary separation only;
i.e., the imprint of a 120 mas binary system should show several
ripples over 180
.
The shown pattern has been calculated for two stars of equal
brightness, and both are individually unresolved by the interferometer.
IRS 3 is resolved by MIDI, which would decrease the amplitude of the
variation shown in Fig. 17, but
the variation per PA is defined by the binary separation only;
i.e., the imprint of a 120 mas binary system should show several
ripples over 180![]() rotation, which cannot be confirmed with our
data (Fig. 8).
Furthermore, we did not observe neither photometric
variability beyond the calibration uncertainties (Sect. 3.3)
or any non-zero differential phases (Sect. 3.2).
rotation, which cannot be confirmed with our
data (Fig. 8).
Furthermore, we did not observe neither photometric
variability beyond the calibration uncertainties (Sect. 3.3)
or any non-zero differential phases (Sect. 3.2).
The simplest deviation from circular symmetry is an elliptical morphology or, more generally, a brightness distribution of different apparent
extension in orthogonal directions.
The analysis of Fig. 8 allows such an
interpretation: towards
![]() the
measured visibilities appear to be slightly lower than in orthogonal
direction, necessitating a larger extension of the
brightness distribution in this direction.
Such a lateral contraction could be evoked by the strong stellar wind
of a nearby star, but more probably this deviation from circular
symmetry can be attributed to a wavelength dependent size (cf. Sect. 3.2).
the
measured visibilities appear to be slightly lower than in orthogonal
direction, necessitating a larger extension of the
brightness distribution in this direction.
Such a lateral contraction could be evoked by the strong stellar wind
of a nearby star, but more probably this deviation from circular
symmetry can be attributed to a wavelength dependent size (cf. Sect. 3.2).
The Gaussian model analysis of the data demonstrated that the interferometer resolves the inner dust around IRS 3. Thus we apply a physically self-consistent radiative transfer (RT) model here to further investigate the physical and chemical properties of the inner dust around IRS 3 addressed before by the smaller of the two Gaussians.
Because of the circular symmetry of the source, we use the one-dimensional
code D USTY (Ivezic et al. 1999).
Since IRS 3 appears to be very luminous, isolated, and surrounded
by a lot of dust, it is the most reasonable to assume that IRS 3 is a post
main-sequence star with strong stellar winds and massive dust formation.
We followed a heuristic approach and calculated four distinct scenarios spanning the space of possible
stellar parameters: hot and cold, realized by stellar
effective temperatures of
![]() K and
K and
![]() K; C-rich with C/O abundance ratios beyond 1,
realized by a domination of amorphous carbon grains in the circumstellar dust and O-rich with a dust composition dominated by warm amorphous silicates.
K; C-rich with C/O abundance ratios beyond 1,
realized by a domination of amorphous carbon grains in the circumstellar dust and O-rich with a dust composition dominated by warm amorphous silicates.
We applied radial density profiles dominated by radiation pressure of
the star (Ivezic & Elitzur 1995).
While the chemical composition and temperatures of the dust strongly influences the
infrared spectrum, the stellar effective temperature ![]() ,
and luminosity L* scale the physical size of the
system in dependence on
,
and luminosity L* scale the physical size of the
system in dependence on
![]() ,
the temperature of the
sublimation zone, where dust distribution starts.
For the grain size distribution we used a power-law distribution as
published by Mathis et al. (1977) and an upper limit on the
grain size of
,
the temperature of the
sublimation zone, where dust distribution starts.
For the grain size distribution we used a power-law distribution as
published by Mathis et al. (1977) and an upper limit on the
grain size of
![]() m, which was successfully applied in
similar experiments.
m, which was successfully applied in
similar experiments.
To demonstrate the different constraints imposed by the data we present our results in two parts. First the measured SED can be related to the optical depth ![]() of the dust and to the temperature
of the dust and to the temperature
![]() at
the inner boundary of the dust shell.
In the next step the remaining ambiguities regarding the stellar temperature and dust composition can be scrutinized further by comparing calculated visibilities of the RT models to the
MIDI data.
at
the inner boundary of the dust shell.
In the next step the remaining ambiguities regarding the stellar temperature and dust composition can be scrutinized further by comparing calculated visibilities of the RT models to the
MIDI data.
![\begin{figure}
\par\includegraphics[width=8.8cm]{6733fi21.eps}
\end{figure}](/articles/aa/full/2008/10/aa6733-06/img118.gif) |
Figure 18:
Data equal to the one in Fig. 16, but further corrected to match the intrinsic emission of IRS 3 and its surrounding circumstellar dust shell. The corrections are discussed in the text, and lead to the following intrinsic fluxes: 0.05, 0.5, 13.5, 30, 50, 46, 7.0 Jy at 1.6, 2.1, 3.8, 4.7, 8, 13, 19 |
| Open with DEXTER | |
This part is aggravated by the fact that IRS 3 is observed both through a large amount of interstellar extinction towards the GC and through the local (partly diffuse) dust of non-negligible optical depth at MIR wavelengths as shown in earlier sections.
Some uncertainty derives from the fact that the shape of the interstellar extinction only at wavelengths shorter than 8 ![]() m is well observed and shown to be relatively constant throughout the Galaxy (Indebetouw et al. 2005).
In addition we do not know the exact dust composition and resulting shape of the interstellar extinction at MIR wavelengths within the central parsec and around IRS 3 in particular.
Thus the dereddened SED as the basis of this section is expected to create uncertainties on the order of magnitude of tens of percent in flux.
m is well observed and shown to be relatively constant throughout the Galaxy (Indebetouw et al. 2005).
In addition we do not know the exact dust composition and resulting shape of the interstellar extinction at MIR wavelengths within the central parsec and around IRS 3 in particular.
Thus the dereddened SED as the basis of this section is expected to create uncertainties on the order of magnitude of tens of percent in flux.
This naturally affects the accuracy of the estimation of
![]() and
and ![]() ,
which both determine the shape of the intrinsic SED.
Similarly we cannot meaningfully investigate the gradual importance of secondary ingoing parameters like the density profile,
chemistry (e.g. existence and amount of SiC, crystalline olivines), etc.
These parameters cannot be fine-tuned
unambiguously by comparison with the dereddened stellar spectrum, so fixed standard values are used.
,
which both determine the shape of the intrinsic SED.
Similarly we cannot meaningfully investigate the gradual importance of secondary ingoing parameters like the density profile,
chemistry (e.g. existence and amount of SiC, crystalline olivines), etc.
These parameters cannot be fine-tuned
unambiguously by comparison with the dereddened stellar spectrum, so fixed standard values are used.
Since the relative depth of the interstellar silicate
absorption is unclear, we excluded the data around 9.8 ![]() m for the SED fits and used only data at the edges of the N-band.
In addition we corrected the SED for using only 40, 30, and 20% at 8, 13, and 19
m for the SED fits and used only data at the edges of the N-band.
In addition we corrected the SED for using only 40, 30, and 20% at 8, 13, and 19 ![]() m of the single telescope flux making allowance for the found interferometric flux ratios, thereby eliminating the emissive contributions from the outer cooler dust.
Furthermore, we increased the optical depth at
m of the single telescope flux making allowance for the found interferometric flux ratios, thereby eliminating the emissive contributions from the outer cooler dust.
Furthermore, we increased the optical depth at
![]() m beyond the
m beyond the
![]() seen at NIR wavelengths to account for the extinction caused by the outer flux seen by the interferometer (Sect. 4.3).
This is realized by upscaling the assumed shape of the interstellar extinction towards the GC (Moneti et al. 2001) to match at
seen at NIR wavelengths to account for the extinction caused by the outer flux seen by the interferometer (Sect. 4.3).
This is realized by upscaling the assumed shape of the interstellar extinction towards the GC (Moneti et al. 2001) to match at
![]() m an additional
m an additional
![]() (Table 4).
This opacity would already explain at least half the
(Table 4).
This opacity would already explain at least half the
![]() excess (Fig. 10) if the same interstellar GC extinction shape would again be used for the outer dust addressed by the larger Gaussian in our simple two-component model.
It is conceivable that, by confining this correction to
excess (Fig. 10) if the same interstellar GC extinction shape would again be used for the outer dust addressed by the larger Gaussian in our simple two-component model.
It is conceivable that, by confining this correction to
![]() m, we slightly underestimate the dereddened fluxes at shorter wavelengths, which should also be affected by the outer dust.
m, we slightly underestimate the dereddened fluxes at shorter wavelengths, which should also be affected by the outer dust.
The remainig excess extinction at 9.8 ![]() m could stem from either fractionally enhanced silicate dust in the central parsec in general or in the outer and (partially diffuse) dust around IRS 3 only.
In the next section we aim at investigating whether this
remaining
m could stem from either fractionally enhanced silicate dust in the central parsec in general or in the outer and (partially diffuse) dust around IRS 3 only.
In the next section we aim at investigating whether this
remaining
![]() excess towards IRS 3 could originate from the inner dust at 20 mas scales and is thus produced in an oxygen-rich dust shell.
Finding the latter would suggest IRS 3 to contribute to its possibly silicate-enriched environs.
excess towards IRS 3 could originate from the inner dust at 20 mas scales and is thus produced in an oxygen-rich dust shell.
Finding the latter would suggest IRS 3 to contribute to its possibly silicate-enriched environs.
We decided to fix
![]() for all models at a typical value for subliming dust of 1200 K.
Tests show that by varying this
for all models at a typical value for subliming dust of 1200 K.
Tests show that by varying this
![]() by up to 300 K, we still reproduce the earlier dust temperature findings and generate model SEDs with deviations from the data that can easily be explained by slightly varying the optical depth in the outer dust of the stellar surrounding.
However, sublimation temperatures well below 900 K can be excluded.
Furthermore, the optical depth needed to create model SED that comply with the data is not negligible.
This in turn enables us to scrutinize the dust composition in the next section since the different optical properties of carbon and oxygen-rich dust show stronger impact in the case of higher optical depths.
by up to 300 K, we still reproduce the earlier dust temperature findings and generate model SEDs with deviations from the data that can easily be explained by slightly varying the optical depth in the outer dust of the stellar surrounding.
However, sublimation temperatures well below 900 K can be excluded.
Furthermore, the optical depth needed to create model SED that comply with the data is not negligible.
This in turn enables us to scrutinize the dust composition in the next section since the different optical properties of carbon and oxygen-rich dust show stronger impact in the case of higher optical depths.
The probed optical depth range covered two orders of magnitude (
![]() ).
The best-fit SED models under the given assumptions are shown in Fig. 18.
The main results can be summarized as follows:
).
The best-fit SED models under the given assumptions are shown in Fig. 18.
The main results can be summarized as follows:
![\begin{figure}
\par\includegraphics[width=8.8cm]{6733fi22.eps}\par\includegraphics[width=8.8cm]{6733fi23.eps}
\end{figure}](/articles/aa/full/2008/10/aa6733-06/img124.gif) |
Figure 19:
Measured visibilities on the edges of the N-band outside the silicate feature. The data at 13 |
| Open with DEXTER | |
![\begin{figure}
\par\includegraphics[width=8.8cm]{6733fi24.eps}
\end{figure}](/articles/aa/full/2008/10/aa6733-06/img125.gif) |
Figure 20:
Measured visibilities at 11.5 |
| Open with DEXTER | |
![\begin{figure}
\par\includegraphics[width=8.5cm]{6733fi25.eps}
\end{figure}](/articles/aa/full/2008/10/aa6733-06/img126.gif) |
Figure 21: Comparison of the N-band optical depth of cool star models showing the significant change in optical depth along the silicate features of O-rich dust. |
| Open with DEXTER | |
![\begin{figure}
\par\includegraphics[width=8.8cm]{6733fi26.eps}\par
\end{figure}](/articles/aa/full/2008/10/aa6733-06/img127.gif) |
Figure 22: Mean N-band surface brightness distribution of our cool carbon star model of IRS 3. The inner rim, the dust sublimation zone, is visible as an annulus and resolved by fitting the RT model to our MIDI data. At the bottom the radial profile of the respective image is shown, and the image and radial plot are equally scaled logarithmically. |
| Open with DEXTER | |
Table 5:
Best parameters of the RT models, shown in Figs. 18-22. The dust shell was confined to end at a radius of
![]() .
.
Similar to the flux correction in Sect. 4.5.1 we have to alter the theoretical visibilities of our RT models here to account for the outer flux probed predominantly by the short baselines prior to comparing the model to the data.
To conform this correction to the findings of the previous sections, we add to the respective RT model a Gaussian component of twice the RT model flux and of FWHM of 35, and 45 mas at 8, and 13 ![]() m, respectively.
Again these parameters reflect average properties of the dust emission at lower spatial frequencies and are variable within the ranges implied by the findings of Sect. 3.4.
m, respectively.
Again these parameters reflect average properties of the dust emission at lower spatial frequencies and are variable within the ranges implied by the findings of Sect. 3.4.
With the given data it remains unclear how much of the outer flux is indeed present in a second shell at the 40 mas spatial scale and how close this dust emission resembles a Gaussian brightness distribution. The apparent existence of such a second component might be an artefact of our relatively simple RT models. Similar apparently multi-component dust shells around the well-studied cool carbon star IRC+10216 could be resolved into one complex dust shell by more detailed modeling (e.g. Ivezic & Elitzur 1996a; Men'shchikov et al. 2001). But it was demonstrated that our approach reflects the data and the spatial information therein. Moreover, the spectral shape of the higher spatial frequencies of the innermost dust discussed here is not significantly influenced by this outer dust. A variable mass loss rate of the central star might be responsible for our not observing a simple dust morphology that could be explained by a single simple dust shell alone.
Further it is important to understand that any wavelength-dependent interstellar extinction only decreases the flux but not the flux-normalized visibility, implying that the following results are less affected by the uncertainty in the interstellar MIR extinction along the line of sight to IRS 3.
The investigation of the four best model scenarios fitted to the dereddened SED lead to two important results.
First the aforementioned ambiguity of T* is probed by our interferometric data.
The Ri of hot stars with the assumed
![]() tend to be too large implying visibilities too low to model the measurements (Fig. 19 and Table 5).
Increased
tend to be too large implying visibilities too low to model the measurements (Fig. 19 and Table 5).
Increased
![]() could alleviate this size problem of the hot star models, and the described uncertainties in the derivation of the intrinsic fluxes and visibilities of IRS 3, as well as the scatter in the data, prohibit a definite answer for the stellar temperature.
But the comparison of the fitted dust sublimation radii (Table 5) with the simple Gaussian analysis in Sect. 3.4 also favors the cool star models since such Gaussian fits tend to show FWHM twice as large as the sublimation diameter of respective RT models (Ivezic & Elitzur 1996b).
And dust sublimation radii of 30-40 AU with stellar luminosities of
could alleviate this size problem of the hot star models, and the described uncertainties in the derivation of the intrinsic fluxes and visibilities of IRS 3, as well as the scatter in the data, prohibit a definite answer for the stellar temperature.
But the comparison of the fitted dust sublimation radii (Table 5) with the simple Gaussian analysis in Sect. 3.4 also favors the cool star models since such Gaussian fits tend to show FWHM twice as large as the sublimation diameter of respective RT models (Ivezic & Elitzur 1996b).
And dust sublimation radii of 30-40 AU with stellar luminosities of
![]() found for the cool star models are common values for dust-forming AGB stars.
Thus for the first time we can present an experimental indication of the exclusion of WR-like hot star scenarii for IRS 3.
found for the cool star models are common values for dust-forming AGB stars.
Thus for the first time we can present an experimental indication of the exclusion of WR-like hot star scenarii for IRS 3.
The second result of this section rules out silicates as a dominating constituent of the circumstellar dust shell.
The calculated visibilities of the competing
O-rich and C-rich dust compositions are rather similar at 8 and
13 ![]() m, far away from the
central silicate absorption, although already here the smaller size difference of the C-rich models between both wavelengths are closer to the wavelength dependence of the data (Figs. 19 and 20).
However, towards the center of the silicate feature, the apparent source size of O-rich dust shells increases significantly due to the increase in optical depth (Fig. 21).
Figure 20 shows that this effect is still visible at 11.5
m, far away from the
central silicate absorption, although already here the smaller size difference of the C-rich models between both wavelengths are closer to the wavelength dependence of the data (Figs. 19 and 20).
However, towards the center of the silicate feature, the apparent source size of O-rich dust shells increases significantly due to the increase in optical depth (Fig. 21).
Figure 20 shows that this effect is still visible at 11.5 ![]() m where we have precise visibility measurements.
A significant size increase (and visibility drop) at the wings of the silicate feature as predicated by all O-rich dust-shell models that are close to our data has not been observed.
Actually the visibility data do not reveal any clear spectral feature but instead shows a smooth wavelength dependence within the calibration uncertainties (Fig. 6).
m where we have precise visibility measurements.
A significant size increase (and visibility drop) at the wings of the silicate feature as predicated by all O-rich dust-shell models that are close to our data has not been observed.
Actually the visibility data do not reveal any clear spectral feature but instead shows a smooth wavelength dependence within the calibration uncertainties (Fig. 6).
Summarizing the RT analysis of our data, the most probable scenario for the nature of IRS 3 is a cool dust-forming carbon star.
In Fig. 22 we have plotted a mean N-band brightness distribution
of our best-fit, C-rich cool star model.
The inner rim of dust sublimation, resolved by our interferometric experiment, is clearly visible at a radius of 5 mas in the brightness map.
The estimated stellar luminosity (Table 5) points
to a cool carbon star on the AGB. Recent studies of carbon stars find similar stellar and circumstellar dust properties (Groenewegen 1995).
The reasonable assumption of a stellar wind driven dust
density distribution, valid for windy post-main sequence stars,
enables us to calculate the mass loss ![]() ,
terminal
outflow velocity
,
terminal
outflow velocity ![]() ,
and an upper limit on the stellar mass M*(Ivezic & Elitzur 1996a).
We obtain the
following results for the carbon-rich cool star set of parameters
(cf. Table 5), which describes the observations best:
,
and an upper limit on the stellar mass M*(Ivezic & Elitzur 1996a).
We obtain the
following results for the carbon-rich cool star set of parameters
(cf. Table 5), which describes the observations best:
| (6) |
The respective optical depth of the carbon-rich dust shell in the NIR
is
![]() ,
confirming that
the circumstellar dust is optically thick in the NIR, as already suggested by
the analysis of the spatially unresolved SED
(Sect. 4.2).
Thus photospheric CO bandheads, typical of red giant NIR spectra,
cannot be observed, which explains the impossibility of spectral classification
of the central object as described by many authors (most
recently Tanner et al. 2006).
,
confirming that
the circumstellar dust is optically thick in the NIR, as already suggested by
the analysis of the spatially unresolved SED
(Sect. 4.2).
Thus photospheric CO bandheads, typical of red giant NIR spectra,
cannot be observed, which explains the impossibility of spectral classification
of the central object as described by many authors (most
recently Tanner et al. 2006).
We have presented new high-resolution 10 ![]() m data of the enigmatic
IRS 3 object in the immediate vicinity of SgrA*. The analysis and
interpretation of the data contribute to the understanding of both the nature
of the embedded star and the location of the unusually strong interstellar
silicate absorption towards IRS 3. The new high-resolution VISIR
imaging data clearly resolve IRS 3 into both a compact and a diffuse
emission component for the first time.
Most probably the deep 10
m data of the enigmatic
IRS 3 object in the immediate vicinity of SgrA*. The analysis and
interpretation of the data contribute to the understanding of both the nature
of the embedded star and the location of the unusually strong interstellar
silicate absorption towards IRS 3. The new high-resolution VISIR
imaging data clearly resolve IRS 3 into both a compact and a diffuse
emission component for the first time.
Most probably the deep 10 ![]() m silicate absorption feature towards IRS 3 takes place partially in
the local interstellar dust, which is responsible for the substantial diffuse MIR emission.
m silicate absorption feature towards IRS 3 takes place partially in
the local interstellar dust, which is responsible for the substantial diffuse MIR emission.
The interferometric data bear convincing evidence that IRS 3 is a cool star within a carbon-rich dust-shell without significant circumstellar silicate absorption.
The clear imprint in the
circularly symmetric interferometric data of the existence of more extended circumstellar dust was shown. A one-dimensional radiative transfer model can successfully explain the complete,
available near and mid infrared data, spatially unresolved by single telescope
measurements, if outer dust emission on 40 mas scales and beyond and non-negligible additional optical depth is accounted for.
We estimate
a radius of 35 AU and a temperature of ![]() 1200 K for the inner dust rim around IRS 3.
1200 K for the inner dust rim around IRS 3.
With a bolometric luminosity of
![]() and a
stellar temperature of about 3000 K IRS 3 appears to be a cool
luminous carbon star, most probably in the helium-core burning phase.
Such mass-losing stars are important for enriching their environment.
Only because of the high angular resolution of the interferometer could we demonstrate that a large fraction of the dust is produced by IRS 3 itself, whereas most other MIR bright sources in the central parsec have been shown to heat the surrounding interstellar dust that has already formed (Pott et al. 2006; Tanner et al. 2005). Thus IRS 3 appears to be the prime candidate for observing ongoing dust formation in the immediate vicinity of a supermassive black hole.
and a
stellar temperature of about 3000 K IRS 3 appears to be a cool
luminous carbon star, most probably in the helium-core burning phase.
Such mass-losing stars are important for enriching their environment.
Only because of the high angular resolution of the interferometer could we demonstrate that a large fraction of the dust is produced by IRS 3 itself, whereas most other MIR bright sources in the central parsec have been shown to heat the surrounding interstellar dust that has already formed (Pott et al. 2006; Tanner et al. 2005). Thus IRS 3 appears to be the prime candidate for observing ongoing dust formation in the immediate vicinity of a supermassive black hole.
In addition to the interstellar silicate absorption, we found indications of SiC absorption. For the first time the new generation of MIR spectrometers at 8 m class telescopes offer the possibility of studying in detail the spectral properties of the interstellar absorption towards GC stars at angular resolution high enough to account for source confusion and substantial diffuse emission in this outstandingly dense and dusty region. Since a C-rich circumstellar dust shell is free of any silicate feature and IRS 3 is embedded in an exceptionally large amount of ISM, the resulting deep absorption of the smooth background continuum of IRS 3 appears well-suited to studying the shape of the interstellar absorption towards the GC and the extraordinary strength of the silicate absorption feature in more detail. The absorption profile depends on the chemical composition and is needed to accurately correct for the ISM extinction, yielding the intrinsic spectra of all GC sources.
On the basis of our results we propose to grant IRS 3 a central role in such new studies of the interstellar silicate absorption towards the GC. Furthermore, a longterm MIR variability study is proposed to investigate periodical dust formation around IRS 3, suggested by this complex dust morphology.
Acknowledgements
We are grateful for many fruitful discussions with A. Zijlstra and several members of the MIDI consortium, in particular W. Jaffe, R. Köhler, C. Leinert, and T. Ratzka. Detailed comments from the referee helped to make the paper clearer. The outstanding support of the ESO Paranal VLTI team, guaranteeing efficient technically advanced observations, is acknowledged. This research has made use of the SIMBAD database, operated at the CDS, Strasbourg, France. Part of this work was supported by the German Deutsche Forschungsgemeinschaft (DFG via SFB 494). J.U.P. was funded by an ESO studentship and appreciates the hospitality of the UCLA GC group.