A&A 477, 763-773 (2008)
DOI: 10.1051/0004-6361:20077959
The red and blue galaxy populations in the GOODS field: evidence for an
excess of red dwarfs
S. Salimbeni1 -
E. Giallongo1 -
N. Menci1 -
M. Castellano2 -
A. Fontana1 -
A. Grazian1 -
L. Pentericci1 -
D. Trevese2 -
S. Cristiani3 -
M. Nonino3 -
E. Vanzella3
1 - INAF - Osservatorio Astronomico di Roma, via Frascati 33,
00040 Monteporzio (RM), Italy
2 - Dipartimento di Fisica,
Universitá di Roma "La Sapienza'', P.le A. Moro 2, 00185 Roma,
Italy
3 - INAF - Osservatorio Astronomico di Trieste, via G.B.
Tiepolo 11, 34131 Trieste, Italy
Received 28 May 2007 / Accepted 18 October 2007
Abstract
Aims. We study the evolution of the galaxy population up to  as a function of its colour properties. In particular, luminosity functions and luminosity densities were derived as a function of redshift for the blue/late and red/early populations.
Methods. We use data from the GOODS-MUSIC catalogue, which have typical magnitude limits
 and
and
 for most of the sample. About 8% of the galaxies have spectroscopic redshifts; the remaining have well calibrated photometric redshifts derived from the extremely wide multi-wavelength coverage in 14 bands (from the U band to the Spitzer
  m band). We have derived a catalogue of galaxies complete in the rest-frame B-band, which has been divided into two subsamples according to their rest-frame U-V colour (or derived specific star formation rate) properties.
Results. We confirm a bimodality in the U-V colour and specific star formation rate of the galaxy sample up to .
This bimodality is used to compute the luminosity functions of the blue/late and red/early subsamples. The luminosity functions of the blue/late and total samples are well represented by steep Schechter functions evolving in luminosity with increasing redshifts. The volume density of the luminosity functions of the red/early populations decreases with increasing redshift. The shape of the red/early luminosity functions shows an excess of faint red dwarfs with respect to the extrapolation of a flat Schechter function and can be represented by the sum of two Schechter functions. Our model for galaxy formation in the hierarchical clustering scenario, which also includes external feedback due to a diffuse UV background, shows a general broad agreement with the luminosity functions of both populations, the larger discrepancies being present at the faint end for the red population. Hints on the nature of the red dwarf population are given on the basis of their stellar mass and spatial distributions.
Key words: galaxies: distances and redshifts - galaxies: evolution -
galaxies: high-redshift - galaxies: luminosity functions, mass function
The evolution of galaxy luminosity function (LF) is one of the main
tools used to study the structure evolution through the cosmic time. The
advent of large surveys has allowed the analysis of sub-samples of
galaxies selected as a function of their morphological,
spectroscopic or colour properties (Cirasuolo et al. 2007; Norberg et al. 2002; Strateva et al. 2001; Marchesini et al. 2007; Ilbert et al. 2006; Willmer et al. 2006; Cucciati et al. 2006; Baldry et al. 2006; Weiner et al. 2005; Baldry et al. 2004; Madgwick et al. 2002; Wolf et al. 2003; Blanton et al. 2005; Driver et al. 2006; Hogg et al. 2004; Bell et al. 2004, Giallongo et al. 2005; Arnouts et al. 2007, elsewhere
G05).
These studies have allowed us to probe the
evolution of galaxies that have different star formation histories.
Of special interest are the studies concerning the statistical
properties of galaxies selected on the basis of their intrinsic
colour distribution. This distribution appears bimodal up to
 (Baldry et al. 2004; Giallongo et al. 2005; Blanton et al. 2005) and separates the
galaxies into two populations, red early types and blue late types. It
has been shown that this spectral classification is roughly
consistent with the corresponding morphological classification
(bulge vs. disk dominated) at least at low and intermediate
redshifts (Strateva et al. 2001; Weiner et al. 2005).
(Baldry et al. 2004; Giallongo et al. 2005; Blanton et al. 2005) and separates the
galaxies into two populations, red early types and blue late types. It
has been shown that this spectral classification is roughly
consistent with the corresponding morphological classification
(bulge vs. disk dominated) at least at low and intermediate
redshifts (Strateva et al. 2001; Weiner et al. 2005).
This bimodal colour distribution can be naturally explained in
hierarchical models for galaxy formation (Menci et al. 2006,2005)
where two distinct populations arise in the colour distribution
based on two different star formation histories affected by the
feedback effects produced by the supernova (SN) and active galactic nucleus
(AGN) activities
(Menci et al. 2006). However, the effect of environmental density on
the paths of galaxy evolution can have a fundamental role. In this
context it is not clear whether the evolutionary history of galaxies
is originated by a nurture scenario (galaxy properties are
affected by environment through physical mechanisms acting on
galaxies) or by a nature scenario (the evolution is
driven by the initial condition established during the formation
epoch of galaxies, e.g. Cooper et al. 2007; Mateus et al. 2007).
Recent studies have estimated the shape and evolution of the LF of
galaxies selected according to their bimodal colour distribution
using both the large local Sloan survey
(Baldry et al. 2004; Blanton et al. 2005), and other surveys at intermediate
and high redshifts
(Bell et al. 2003; Ilbert et al. 2006; Faber et al. 2007; Giallongo et al. 2005; Willmer et al. 2006). Their results
show the red LF evolving mildly in densities up to  with a
relatively flat shape at the faint-end, although the evaluation of the
faint-end slope of the red LF remains an open issue especially at
intermediate and high redshifts where the present surveys do not
constrain the faint slope very well (Bell et al. 2003; Faber et al. 2007).
with a
relatively flat shape at the faint-end, although the evaluation of the
faint-end slope of the red LF remains an open issue especially at
intermediate and high redshifts where the present surveys do not
constrain the faint slope very well (Bell et al. 2003; Faber et al. 2007).
In G05 we studied the red and blue LFs, using the properties of
bimodality in colour and in specific star formation rate (SSFR),
with a complete but relatively small sample of galaxies selected in
the rest-frame B-band from low to high redshifts. We showed that the
bimodality extends up to at least  .
We also found that
the red/early galaxies decrease in their luminosity density by a
factor of
.
We also found that
the red/early galaxies decrease in their luminosity density by a
factor of  5-6, from
  to
to
 ,
in broad
agreement with the hierarchical cold dark matter model. These
results provided a first picture of the evolution of the red and
blue LFs up to high redshifts relaying on a relatively deep but
small sample. For a more reliable picture a wider sample at high
redshift is clearly needed. For this purpose larger areas with deep
near-IR imaging are required.
,
in broad
agreement with the hierarchical cold dark matter model. These
results provided a first picture of the evolution of the red and
blue LFs up to high redshifts relaying on a relatively deep but
small sample. For a more reliable picture a wider sample at high
redshift is clearly needed. For this purpose larger areas with deep
near-IR imaging are required.
Thanks to the wide area (
 )
and deep
near-IR observations, the GOODS-South survey provides a good
starting point for the study of the galaxy properties at high
redshift. In particular, the inclusion of the deep IR observations
obtained with the Spitzer telescope represent a useful constraint
for the estimate of the physical properties of galaxies at high
redshift. Last but not least the extensive spectroscopic follow up
obtained in this field provides a wide set of spectroscopic
redshifts. From this public data set we have obtained a multi-colour
catalogue of galaxies, which we have named GOODS-MUSIC (GOODS MUlticolour
South Infrared Catalog, Grazian et al. 2006a). This catalogue, where galaxies
are selected both in the z850 and
)
and deep
near-IR observations, the GOODS-South survey provides a good
starting point for the study of the galaxy properties at high
redshift. In particular, the inclusion of the deep IR observations
obtained with the Spitzer telescope represent a useful constraint
for the estimate of the physical properties of galaxies at high
redshift. Last but not least the extensive spectroscopic follow up
obtained in this field provides a wide set of spectroscopic
redshifts. From this public data set we have obtained a multi-colour
catalogue of galaxies, which we have named GOODS-MUSIC (GOODS MUlticolour
South Infrared Catalog, Grazian et al. 2006a). This catalogue, where galaxies
are selected both in the z850 and  bands, contains
information in 14 bands from the U to the Spitzer 8
bands, contains
information in 14 bands from the U to the Spitzer 8  band,
and all the available spectroscopic information. For all the objects
without spectroscopic information, we have obtained well calibrated
photometric redshifts by means of our photometric redshift code
(Fontana et al. 2000).
band,
and all the available spectroscopic information. For all the objects
without spectroscopic information, we have obtained well calibrated
photometric redshifts by means of our photometric redshift code
(Fontana et al. 2000).
The GOODS-MUSIC catalogue has already been used to investigate the
physical and clustering properties of high redshift galaxies
(Grazian et al. 2007; Fontana et al. 2006; Pentericci et al. 2007; Castellano et al. 2007; Grazian et al. 2006b).
Here we study the galaxy LFs of the red and blue
populations, enlightening evolutionary features that are
characteristic of the two populations.
The paper is organised as follows. In Sect. 2 we describe the
basic features of our dataset. In Sect. 3 we describe the
bimodality properties of the sample and we define the loci of
minimum for the selection of the red/early and the blue/late
sub-samples as a function of z. In Sect. 4 we compute the shape
and evolutionary properties of the LFs and the luminosity density of
both populations. Section 5 is devoted to the analysis of the
physical properties of the faint early population.
All the magnitudes used in the present paper are in the AB system.
An
 ,
,
 ,
and H0=70 km s-1 Mpc-1 cosmology is adopted.
,
and H0=70 km s-1 Mpc-1 cosmology is adopted.
We use the multicolour catalogue extracted from the southern field
of the GOODS survey, located in the Chandra Deep Field South. The
procedure adopted to extract the catalogue is described in detail in
Grazian et al. (2006a). Here, we summarise the general features.
The photometric catalogue was obtained by combining 14 images from the
U-band up to 8 .
More specifically, it includes two U band
images from the ESO 2.2 m telescope, a U image from VLT-VIMOS,
the ACS-HST images in four bands B, V, I and z850, the
VLT-ISAAC J, H and
bands, and the Spitzer bands at 3.6, 4.5, 5.8 and 8 .
All the images analysed have an area of 143.2
 ,
except for the U-VIMOS image (90.2
)
and the H image (78.0
). The multicolour catalogue contains 14847 objects, selected either in the z and/or in the
band (version 1.0). As in previous papers (Poli et al. 2003; G05) we select
galaxies in different bands depending on the redshift interval; more
specifically, we select galaxies in the z band at low redshifts
(0.2-1.1) and in the
band at higher redshifts (1.1-3.5). This
allows us, as explained below, to estimate the galaxy LF in the rest frame 4400 Å in the overall redshift
interval (0.2-3.5). As stated by Cameron & Driver (2007) (see
also Trujillo et al. 2006), a careful analysis of the selection effects
due to the detection completeness is needed. This issue is discussed
in the paper by Grazian et al. (2006a). In this paper, we evaluated,
using simulations in the z850 and
bands, a 90%
completeness level for elliptical and spiral galaxies of different
half-light radii and bulge/disk ratios. Since the depth of the image
used for the galaxy selection varies across the area, a single
magnitude limit cannot be defined in each band. As a consequence we divided the
z-selected sample and the -selected sample into six independent
catalogues, each with a well defined area and
magnitude limit, relative to a 90% completeness level. The
z-selected catalogues have magnitude limits in the range
24.65-26.18, while the magnitude limits in the -selected sample
range from 21.60 to 23.80, but for most of the sample the typical
magnitudes limits are
,
except for the U-VIMOS image (90.2
)
and the H image (78.0
). The multicolour catalogue contains 14847 objects, selected either in the z and/or in the
band (version 1.0). As in previous papers (Poli et al. 2003; G05) we select
galaxies in different bands depending on the redshift interval; more
specifically, we select galaxies in the z band at low redshifts
(0.2-1.1) and in the
band at higher redshifts (1.1-3.5). This
allows us, as explained below, to estimate the galaxy LF in the rest frame 4400 Å in the overall redshift
interval (0.2-3.5). As stated by Cameron & Driver (2007) (see
also Trujillo et al. 2006), a careful analysis of the selection effects
due to the detection completeness is needed. This issue is discussed
in the paper by Grazian et al. (2006a). In this paper, we evaluated,
using simulations in the z850 and
bands, a 90%
completeness level for elliptical and spiral galaxies of different
half-light radii and bulge/disk ratios. Since the depth of the image
used for the galaxy selection varies across the area, a single
magnitude limit cannot be defined in each band. As a consequence we divided the
z-selected sample and the -selected sample into six independent
catalogues, each with a well defined area and
magnitude limit, relative to a 90% completeness level. The
z-selected catalogues have magnitude limits in the range
24.65-26.18, while the magnitude limits in the -selected sample
range from 21.60 to 23.80, but for most of the sample the typical
magnitudes limits are
 and
and
 .
.
In summary, the z-selected sample has 9862 (after removing AGNs
and galactic stars) galaxies with about 10% having spectroscopic
redshift, while the -selected sample has 2931 galaxies with
about 27% having spectroscopic redshifts. For the galaxies without
spectroscopic redshift we use the photometric one. Our photometric
redshift technique has been described in Giallongo et al. (1998) and
Fontana et al. (2000). We adopt a standard  minimisation over a
large set of templates obtained from synthetic spectral models. In
particular, we use those obtained with PÉGASE 2.0
(Fioc & Rocca-Volmerange 1997) as described in Grazian et al. (2006a). The comparison with
the spectroscopic subsample shows that the accuracy of the
photometric estimation is very good, with
minimisation over a
large set of templates obtained from synthetic spectral models. In
particular, we use those obtained with PÉGASE 2.0
(Fioc & Rocca-Volmerange 1997) as described in Grazian et al. (2006a). The comparison with
the spectroscopic subsample shows that the accuracy of the
photometric estimation is very good, with
 in the redshift interval 0<z<6.
As in Poli et al. (2003) and Giallongo et al. (2005), great care was given to
the selection of the sample suited for the estimate of the
LF. Indeed, we used the z-selected sample for
galaxies with z<1, where the 4400 Å rest-frame wavelength is
within or shorter than the z850-band. For this reason we
only included in our LF galaxies with
![$m[4400(1+z)]\le z_{AB}(lim)$](/articles/aa/full/2008/03/aa7959-07/img25.gif) .
This selection guarantees a completeness of the LF sample at z<1independently of the galaxy colour, although some galaxies from the
original z-limited sample are excluded since they have a red
spectrum, and consequently a magnitude
m[4400(1+z)] fainter than
our adopted threshold. The same procedure was adopted at higher
(z=1.0-3.5) redshifts using the -selected sample. The sample
selected as described above was adopted for all the analysis
presented in this paper.
.
This selection guarantees a completeness of the LF sample at z<1independently of the galaxy colour, although some galaxies from the
original z-limited sample are excluded since they have a red
spectrum, and consequently a magnitude
m[4400(1+z)] fainter than
our adopted threshold. The same procedure was adopted at higher
(z=1.0-3.5) redshifts using the -selected sample. The sample
selected as described above was adopted for all the analysis
presented in this paper.
The method adopted to estimate the rest-frame magnitude and the
other physical parameters is described in previous papers
(Poli et al. 2003; Fontana et al. 2006; Giallongo et al. 2005). Briefly, it is based on a set
of templates, computed with standard spectral synthesis models
(Bruzual & Charlot 2003), chosen to broadly encompass the variety of
star-formation histories, metallicities and extinctions of real
galaxies. To provide a comparison with previous works, we used
the Salpeter IMF, ranging over a set of metallicities (from
 to
to
 )
and dust extinctions (
0<E(B-V)<1.1,
with a Calzetti extinction curve). Details are given in Table 1 of
Fontana et al. (2004). For each model of this grid, we computed
the expected magnitudes in our filter set, and found the
best-fitting template with a standard
minimisation, fixing
the redshift to the spectroscopic or to the photometric one. The
best-fit parameters of the galaxy were found after scaling to the
actual luminosity of each observed galaxy. Uncertainties in this
procedure produced, on average, small errors (
)
and dust extinctions (
0<E(B-V)<1.1,
with a Calzetti extinction curve). Details are given in Table 1 of
Fontana et al. (2004). For each model of this grid, we computed
the expected magnitudes in our filter set, and found the
best-fitting template with a standard
minimisation, fixing
the redshift to the spectroscopic or to the photometric one. The
best-fit parameters of the galaxy were found after scaling to the
actual luminosity of each observed galaxy. Uncertainties in this
procedure produced, on average, small errors (
 )
in the
rest-frame luminosity (Ellis 1997; Pozzetti et al. 2003). Moreover, the
inclusion of the 4 Spitzer bands, longward of 2.2
)
in the
rest-frame luminosity (Ellis 1997; Pozzetti et al. 2003). Moreover, the
inclusion of the 4 Spitzer bands, longward of 2.2  m, for
galaxies at z>2, was essential to sample the spectral
distribution in the rest-frame optical and near-IR bands, and to
provide reliable constraints on the stellar mass and dust estimation
(for a detailed analysis see Fontana et al. 2006).
m, for
galaxies at z>2, was essential to sample the spectral
distribution in the rest-frame optical and near-IR bands, and to
provide reliable constraints on the stellar mass and dust estimation
(for a detailed analysis see Fontana et al. 2006).
3 The semi-analytical model
In order to make a comparison with current hierarchical models of
galaxy formation we used our semi-analytical model (SAM), described
here briefly (for a detailed description
see Menci et al. 2006,2005).
The model connects i) the processes related to the gas physics
(emission, radiative cooling, heating); ii) the star formation
activity (whose rate is assumed to proceed from the conversion of
the cold gas mass on a timescale proportional to the disk dynamical
timescale); and iii) the consequent Supernovae heating of the gas to
the merging histories of dark matter haloes. The model also includes
the effect of starbursts triggered by galaxy interactions and the
accretion onto supermassive black holes at the centre of galaxies
powering the AGN activity, with the corresponding energy feedback
onto the interstellar medium.
We adopt the same choice for the model free parameters (the
normalisation of the star formation timescale and of the Supernovae
energy feedback) as in the above papers; the only changes concern
the use of merger trees with a larger mass resolution (
 )
for progenitors of large mass (
)
for progenitors of large mass (
 )
haloes, and the complete depletion of gas in haloes with a virial
temperature lower than
)
haloes, and the complete depletion of gas in haloes with a virial
temperature lower than
 K, due to the effect of the UV
background (see also Somerville & Primack 1999).
K, due to the effect of the UV
background (see also Somerville & Primack 1999).
4 Bimodality
The recent analysis of the spectral properties of galaxies selected
in large or deep surveys has shown the presence of a strong
bimodality in their colour distribution
(e.g. Strateva et al. 2001; Baldry et al. 2004; Willmer et al. 2006), allowing the
identification of two main populations, red/early and blue/late
galaxies, mainly on the basis of a single colour, e.g. the rest-frame U-V. The local distribution has been studied by Strateva et al. (2001)
and Baldry et al. (2004) in the framework of the Sloan survey and, at
intermediate and high redshifts, by several authors
(Cirasuolo et al. 2007; Giallongo et al. 2005; Cucciati et al. 2006; Bell et al. 2004; Franceschini et al. 2006; Weiner et al. 2005).
Some effort has been devoted to explaining the observed bimodality
in the framework of the hierarchical clustering picture
(Menci et al. 2006,2005; Dekel & Birnboim 2006). In particular, Menci et al. (2005)
proposed that the colour bimodality arises because of two natural
features: the star formation histories of the massive red galaxies,
which are formed in biased high-density regions, and are peaked at
higher z as compared to lower mass galaxies; and the existence of
a non-gravitational mass scale (m0). For m<m0 the star
formation is self regulated and the cold gas content is continuously
depleted by SN feedback, for m>m0 the cold gas is not effectively
reheated and so the rapid cooling takes place at high-z. These
different evolutionary paths led to the present day red and blue
populations (Menci et al. 2005). When the energy injection from AGN
feedback is included (Menci et al. 2006), the bimodal distribution
appears at even higher redshifts (z>2).
Using the rest-frame colour we can separate the red population from
the blue to analyse the evolution of the LFs. A recent analysis of
the morphological structure of a fraction of the GOODS sample has
shown a good correlation between the red colour and the spheroidal
morphology of galaxies up to  (see Franceschini et al. 2006). Moreover, as in G05, we are interested
in the galaxy evolution as a function of the star-formation
activity. In this respect, the use of the colour criterion
introduces some population mixing for the red galaxies since it is
not possible to distinguish an early-type galaxy from a dusty
star-burst using only the rest-frame U-V colour. Therefore, we used the
Bruzual & Charlot (2003) spectral best fit of the individual galaxy spectral energy
distributions (SEDs) to derive the SSFR,
(see Franceschini et al. 2006). Moreover, as in G05, we are interested
in the galaxy evolution as a function of the star-formation
activity. In this respect, the use of the colour criterion
introduces some population mixing for the red galaxies since it is
not possible to distinguish an early-type galaxy from a dusty
star-burst using only the rest-frame U-V colour. Therefore, we used the
Bruzual & Charlot (2003) spectral best fit of the individual galaxy spectral energy
distributions (SEDs) to derive the SSFR,
 (as described in the previous section). We are aware that
the absolute values in the
distribution are subject
to uncertainties due, for example, to the estimate of the dust
attenuation, which depends on the extinction curve adopted, and to the
methods adopted for the mass estimate. We refer to our previous
paper, G05 and references therein, for a description of the method
used and its reliability. However, although some degeneracy still
remains, we can use this property to separate our sample, removing
the obvious star-burst galaxies from the locus of early-type.
(as described in the previous section). We are aware that
the absolute values in the
distribution are subject
to uncertainties due, for example, to the estimate of the dust
attenuation, which depends on the extinction curve adopted, and to the
methods adopted for the mass estimate. We refer to our previous
paper, G05 and references therein, for a description of the method
used and its reliability. However, although some degeneracy still
remains, we can use this property to separate our sample, removing
the obvious star-burst galaxies from the locus of early-type.
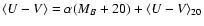
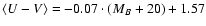
The results about the colour bimodality at high redshift from G05
are here confirmed at a higher statistical level. The
colour-luminosity relation is shown in Fig. 1, while
the analogous distribution in SSFR is shown in Fig. 2.
The minima in the colour-magnitude distribution and in the SSFR-magnitude
distribution are used to divide the sample into red/early and blue/late
populations. For an evaluation of this relation we adopted the same procedure as
in G05. We fit the
distributions shown in Figs. 1 and 2
with the sum of two Gaussians whose mean is a linear function of the
absolute magnitude MB. Each Gaussian has a constant dispersion
and each sub-sample of galaxies, with a different magnitude limit,
has been weighted with its covering sky area. Since the statistics
of the red population are still poor, we adopted, as in G05, the
same dependence on the absolute magnitude for both the blue and the
red populations. Taking into account the different normalisations of
the two Gaussian distributions we then derived the locus of the
formal minimum in the sum of the two Gaussians, separating in this
way the two populations. The loci of the red/early and blue/late
populations are shown in Table 1, and the minima in Table 2.
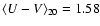
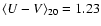
The resulting colour distribution projected at MB=-20 along the
best-fit correlation is also displayed in Fig. 1,
with the vertical line indicating the colour separation at that
magnitude.
The same is shown for the SSFR distribution in Fig. 2
where the relative numbers of early and late type galaxies can also
be derived in two different ranges of absolute magnitudes.
![\begin{figure}
\par\resizebox{8.8cm}{!}{\includegraphics[width=9cm]{7959fig1.ps}}
\end{figure}](/articles/aa/full/2008/03/aa7959-07/Timg36.gif) |
Figure 1:
Left panel: colour-magnitude diagrams in various redshift
intervals; the lines represent the best-fit relations for the blue
and red populations and the locus of the minimum, the shaded area is
the uncertainty on the minimum. Right panel: the histograms of
colour distribution projected at MB=-20 along the best-fit
correlations, the continuous horizontal lines are the colour
separation at this magnitude, and the dash horizontal lines are the
loci of the maxima. |
| Open with DEXTER |
The uncertainty associated with the selection of the minima has been
derived reproducing 100 colour-magnitude plots with a MonteCarlo
analysis using 100 galaxy catalogues. In each catalogue we assigned to
each object a different redshift drawn from its probability
distribution and we associated their rest-frame absolute magnitudes
and SSFRs. The z probability distribution naturally takes into
account the photometric errors and the model degeneracy in the
spectral libraries. The uncertainty region is shown in Figs. 1 and 2 as a shaded area, its value is
 0.1 for the minima in colour, and 0.2 for those in
SSFR.
0.1 for the minima in colour, and 0.2 for those in
SSFR.
The colour/SSFR-magnitude relations for the loci of the maxima and
minima follow the linear relations
 and
and
 ,
whose
parameters are listed in Tables 1 and 2.
,
whose
parameters are listed in Tables 1 and 2.
In the colour-magnitude relation we confirm the weak intrinsic
blueing with increasing redshift from
 to
to  already found by G05 for both populations, although formally only at
2
already found by G05 for both populations, although formally only at
2 level. In the redshift bins where the statistics are poor,
the minimum is extrapolated from the other redshift bins. From the
bins
z=0.4-0.7 and
z=0.7-1.0 we extrapolate the minimum value
level. In the redshift bins where the statistics are poor,
the minimum is extrapolated from the other redshift bins. From the
bins
z=0.4-0.7 and
z=0.7-1.0 we extrapolate the minimum value
 in the redshift interval
z=0.2-0.4, and from the
bins
z=0.7-1.0 and
z=1.0-2.0 we extrapolate
in the redshift interval
z=0.2-0.4, and from the
bins
z=0.7-1.0 and
z=1.0-2.0 we extrapolate
 in
the interval z=2-3.5.
in
the interval z=2-3.5.
We found no appreciable redshift evolution in the SSFR distribution,
so in order to increase the statistics we performed the fit in the
larger redshift intervals z=0.2-1 and 1-3.5. Moreover, there is
no appreciable dependence of SSFR on the absolute magnitude, so the
colour-magnitude relation is not related to similar trends in the
SSFR.
4.2 Discussion on the selection
criteria
One notes in the colour/SSFR-magnitude relations the presence of a
conspicuous number of intrinsically faint galaxies with relatively
red colours. They are red with respect to the locus of separation of
the two populations although, because of the colour-magnitude
relation, their colours are typical of the bright (
 )
blue galaxies. In terms of SSFR these galaxies show intermediate
values between star forming and early type galaxies. The presence of
a large number of galaxies belonging to this intermediate population
dominates the shape of the LF of the red/early type galaxies at the
faint end, as shown in the next sections.
)
blue galaxies. In terms of SSFR these galaxies show intermediate
values between star forming and early type galaxies. The presence of
a large number of galaxies belonging to this intermediate population
dominates the shape of the LF of the red/early type galaxies at the
faint end, as shown in the next sections.
However, since the colour dispersion of the blue sequence broadens
at faint magnitudes, the assumption of a linear parameterisation for
the minimum could imply a bias for the selection of the red sample
(for a detailed analysis of the blue sequence properties
see Labbé et al. 2007). For this reason we also performed an
analysis deriving the minimum without any assumption on its
dependence on the rest-frame luminosity. We concentrated our
analysis in the redshift interval 0.4-0.7, which has sufficient
statistics at faint magnitudes. We obtained a volume corrected
colour distribution in four magnitude bins, and for each colour
distribution we fit a double-Gaussian function, as shown in Fig. 3. We adopted the intersection of the two
Gaussians as minimum. In this way we verified that the locus of
the minimum is well described by a linear behaviour: by performing a
linear fit to these points we found the following relation
 (see Fig. 4). This
relation is very similar to our standard analysis and does not
produce a substantial variation of our results (see also Sect. 5.3 and
Fig. 8). As described
above, this analysis can not exclude a contamination from the
star-burst galaxies reddened by dust, for this reason we also
performed an analysis of the LF on a homogeneous sample of galaxies
selected using SSFR distribution.
(see Fig. 4). This
relation is very similar to our standard analysis and does not
produce a substantial variation of our results (see also Sect. 5.3 and
Fig. 8). As described
above, this analysis can not exclude a contamination from the
star-burst galaxies reddened by dust, for this reason we also
performed an analysis of the LF on a homogeneous sample of galaxies
selected using SSFR distribution.
Table 1:
Parameters of the relation between the loci of the maxima
and the absolute B magnitude.
Table 2:
Parameters of the relation between the locus of the minimum
and the absolute B magnitude.
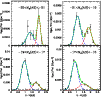 |
Figure 3:
Volume
corrected colour histogram, in four bins of magnitude, in the
redshift interval 0.4<z<0.7. The continuous lines are the
double-Gaussian fit to the colour distributions. |
| Open with DEXTER |
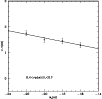 |
Figure 4:
Points
are the minima obtain by the fits shown in Fig. 3.
Continuous line is the linear fit to these minima. |
| Open with DEXTER |
Table 3:
LF parameters for the total and blue/late.
type sample.
5.1 The statistical analysis
The LF is computed with the procedure described in G05. We applied to our sample
an extended version of the standard
 algorithm (Avni & Bahcall 1980). As in the previous paper, we used a
combination of data derived from regions in the field
with different magnitude limits. Indeed, for each object and for
each jth region under analysis a set of effective volumes
algorithm (Avni & Bahcall 1980). As in the previous paper, we used a
combination of data derived from regions in the field
with different magnitude limits. Indeed, for each object and for
each jth region under analysis a set of effective volumes
 is computed. For a given redshift interval (z1,z2),
these volumes are enclosed between z1 and
is computed. For a given redshift interval (z1,z2),
these volumes are enclosed between z1 and
 ,
the latter
being defined as the minimum between z2 and the maximum redshift
at which the object could have been observed, within the magnitude
limit of the jth field. The galaxy number density
,
the latter
being defined as the minimum between z2 and the maximum redshift
at which the object could have been observed, within the magnitude
limit of the jth field. The galaxy number density  in
each
in
each
 bin can then be obtained as:
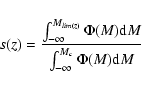
![\begin{displaymath}\phi(M,z)=
\frac{1}{\Delta M}\sum_{i=1}^{n}\left[ \sum_j
\ome...
..._{\rm up}(i,j)} \frac{{\rm d}V}{{\rm d}z}{\rm d}z \right]^{-1}
\end{displaymath}](/articles/aa/full/2008/03/aa7959-07/img58.gif) |
(1) |
where  is the area in units of steradians corresponding
to the field j, n is the number of objects in the chosen bin
and d
is the area in units of steradians corresponding
to the field j, n is the number of objects in the chosen bin
and d
 is the comoving volume element per steradian.
The Poisson error in each LF magnitude bin was computed adopting the
recipe by Gehrels (1986), valid also for small numbers. The
uncertainties in the LF due to the photometric uncertainties and to
the degeneracy of the spectral models used to derive redshifts were
computed with the same Monte Carlo analysis described in the
previous section. The uncertainties obtained and the Poisson errors were added
in quadrature.
The
estimator for the LF can in principle be affected by
small scale galaxy clustering. For this reason a parametric maximum
likelihood (ML) estimator is also adopted, which is known to be less
biased with respect to small scale clustering (see Heyl et al. 1997).
The parametric analysis of the galaxy LF was obtained from the
maximum likelihood analysis assuming for different galaxy
populations different parameterisation  for the LF. The
maximum likelihood method used here represents an extension of the
standard Sandage et al. (1979) method, where several samples can be
jointly analysed and where the LF is allowed to vary with redshift.
A more detailed description can be found in G05 and a formal
derivation of the maximum likelihood equation is shown in
Heyl et al. (1997).
for the LF. The
maximum likelihood method used here represents an extension of the
standard Sandage et al. (1979) method, where several samples can be
jointly analysed and where the LF is allowed to vary with redshift.
A more detailed description can be found in G05 and a formal
derivation of the maximum likelihood equation is shown in
Heyl et al. (1997).
To describe the B-band LF of the total sample and that of blue/late
galaxies we assume a Schechter parameterisation:
Since previous analyses have shown that the evolution of the global
galaxy LF is manly driven by luminosity evolution, we
adopted an M* that is redshift dependent (see
aslo Gabasch et al. 2006; Giallongo et al. 2005; Heyl et al. 1997). We used the
parameterisation that better matches our data in this range of
redshifts:
 |
(2) |
The slope  is kept constant with redshift since it is well
constrained only at low-intermediate redshift (z<1). For all of the
sample considered here, we checked that the density parameter had no significative variation if it had been evolved with the
parametric form described in G05, thus we keep it as constant.
is kept constant with redshift since it is well
constrained only at low-intermediate redshift (z<1). For all of the
sample considered here, we checked that the density parameter had no significative variation if it had been evolved with the
parametric form described in G05, thus we keep it as constant.
As shown in Figs. 7 and 9 this is
not a good description for the red/early population for which we
assume a double Schechter form, as frequently adopted in similar
cases in literature (e.g. Popesso et al. 2006):
For a quantitative evaluation of the density evolution at the bright
end, we evolved the bright Schechter with a redshift dependent
normalisation:
 |
(4) |
where
 |
(5) |
We used the MINUIT package of the CERN library (James & Roos 1995) for
the minimisation. The errors in Tables 3 and 4 are calculated for each parameter, independently of
the others.
Table 4:
LF parameters for red and early.
type galaxies, in the redshift interval 0.4-3.5.
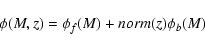
The evolution of the total LF is shown in Fig. 5. To
compare our high z results and our fits with local values we also
show the local LF from the Two-Degree Field Galaxy Redshift Survey
(2dFGRS; Norberg et al. 2002, dotted line in Fig. 5).
The
analysis shows that the main kind of evolution is
due to a brightening of the LF with redshift. We applied the ML analysis to the sample using the evolutionary form of the Schechter
LF described in Eq. (2), where pure luminosity evolution is
allowed up to a maximum redshift beyond which the LF keeps constant.
The results in Table 3 imply that the LF is
subject to a mild luminosity evolution only up to
(
 in the z=0.2-1 interval). At higher z the LF appears constant with redshift, although at ,
in the
brightest bin, a slight excess is present. In any case, the adopted
evolutionary model is acceptable at 2 level using the
standard
test.
in the z=0.2-1 interval). At higher z the LF appears constant with redshift, although at ,
in the
brightest bin, a slight excess is present. In any case, the adopted
evolutionary model is acceptable at 2 level using the
standard
test.
We also show a comparison with the DEEP2 Redshift Survey
(D2RS, Willmer et al. 2006; Davis et al. 2003, empty points in Fig.
5). Although the comparison of the
LFs was performed on data taken from surveys that have different
magnitude limits and redshift estimates (photometric and
spectroscopic), the agreement is very good in the overlapping
magnitude regions and in all the redshift bins. A general good
agreement is also found with the LF derived from the VVDS survey by
Ilbert et al. (2005), although from our ML analysis we do not have any
evidence of steepening of the faint end slope up to ,
as
suggested by them. We compared our results with other
photometric redshift surveys, like the COMBO-17 survey by
Bell et al. (2004) (see also Faber et al. 2007). A good agreement is found
in the overall redshift interval and in the appropriate magnitude
interval. The comparison with the FORS Deep Field (FDF)
(Gabasch et al. 2004) is less straightforward, because of the
different redshift intervals used. An acceptable agreement is found
up to .
At higher redshifts the FDF luminosity function
shows an excess of very bright objects with respect to our
values, as well as the COMBO17 and DEEP2 LFs.
In Fig. 5 we included the LFs derived from our
hierarchical model described in Sect. 3 (see also
Menci et al. 2006,2005). The effect of the UV background is
effective in flattening the predicted shape of the LF at the faint
magnitudes providing an agreement better than that previously obtained
(Poli et al. 2003).
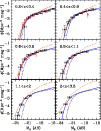 |
Figure 5:
Total LF
as a function of redshift. The continuous curves come from our
maximum likelihood analysis. The dotted line is the local LF
(Norberg et al. 2002). The filled circles are the points obtained with
1/VMAX method. The empty circles come from the DEEP2 survey
(Willmer et al. 2006). The results from the COMBO17 and VDDS surveys are
consistent with the DEEP2 results and are omitted from the plot. The
dashed-point line is the model of Menci et al. (2006). |
| Open with DEXTER |
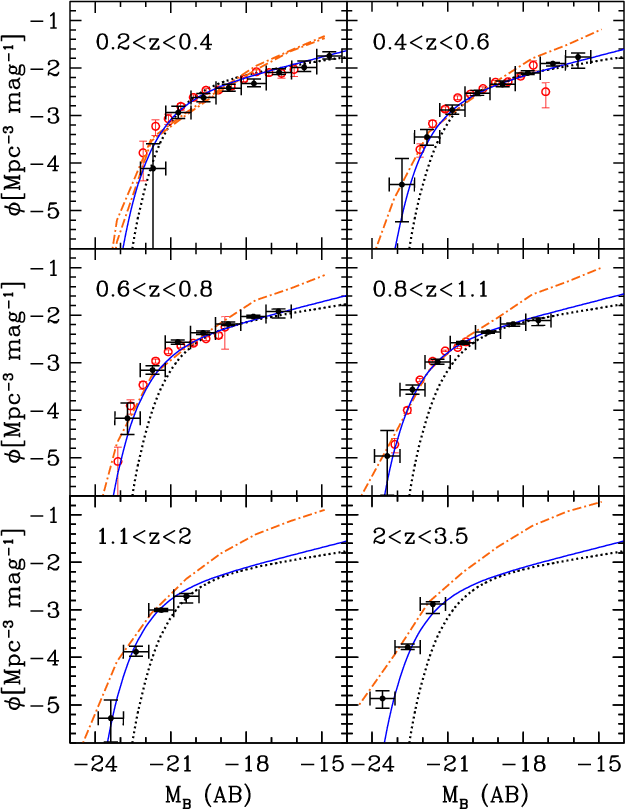
5.3 LF for the blue/late and red/early
galaxies
In this section we show the shapes and evolutionary behaviours of
the LFs derived for the blue/late and red/early
galaxy populations, respectively. We have adopted the empirical
colour/SSFR selection, described in Sect. 4, to
separate the two populations.
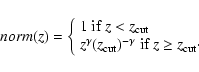
The shape and redshift evolution of the blue LF is shown in Fig. 6, where both the
data points and the
curves derived from the ML analysis are represented. The best fit
parameters together with their uncertainties are shown in Table 3. The LFs of the late populations are very
similar to the blue ones and are not shown in a figure.
As for the total sample, we found that the blue population is well
represented by the same type of luminosity evolution, although
faster, with
 in the z=0.2-1 interval. The
faint end slope appears steeper. This is due, of course, to the fact
that the blue population dominates the volume density of the total
sample at any redshift.
in the z=0.2-1 interval. The
faint end slope appears steeper. This is due, of course, to the fact
that the blue population dominates the volume density of the total
sample at any redshift.
We first compare our results with those of the spectroscopic survey
D2RS (Willmer et al. 2006; Faber et al. 2007). We note that the colour selection they
use to separate the two populations is based on a U-B vs. MVcolour-magnitude relation. We have verified in our sample that their
colour selection is very similar to our criterion. In fact, if we
adopt their selection on our sample, we reproduce almost the same
blue/red galaxy subsamples obtained with our cut. Their LFs are in
good agreement with our results, as shown in Fig. 6
(data with error bars). We then compare our results to those of
COMBO-17. They use as a selection criterion the colour U-V vs. MV, which nearly corresponds to that used by Willmer et al. (2006). The
agreement with our results is good.
A direct comparison with the blue/red LFs by Marchesini et al. (2007) in the
redshift interval 2<z<3.5 is not possible since
they use a colour separation that is bluer than our criterion by 0.2 mag
providing a LF with a lower normalisation.
The LF predicted by our hierarchical model was not included in Fig. 6 since it is not appreciably different from that of
the total sample.
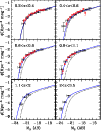 |
Figure 6:
LFs of the
blue galaxies as function of redshift. The continuous curves comes
from our maximum likelihood analysis. The dotted line is our fit at
 ,
reported for comparison in all the redshift bins. The
big filled circles are the points obtained with 1/VMAX method.
The small empty circles are points from the LFs by
Willmer et al. (2006). ,
reported for comparison in all the redshift bins. The
big filled circles are the points obtained with 1/VMAX method.
The small empty circles are points from the LFs by
Willmer et al. (2006). |
| Open with DEXTER |
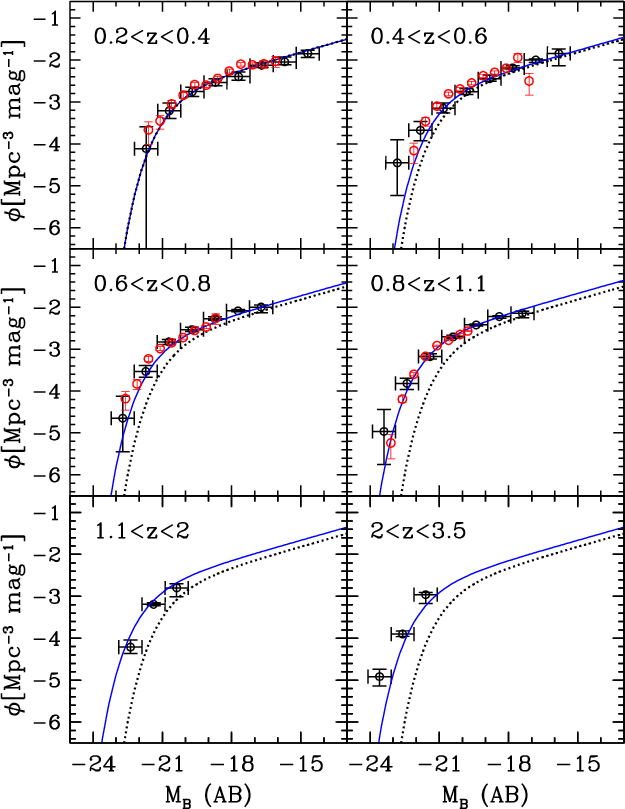
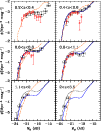 |
Figure 7:
LFs of the
red galaxies as function of redshift. The continuous curves comes
from our maximum likelihood analysis. The first bin of redshift, has been
excluded from this evolutive
analysis since the statistics are too low. The dotted line is our fit at ,
reported for
comparison in all the redshift bins. The big filled circles are the
points obtained with 1/VMAX method. The small empty circles are
points from the LFs by Willmer et al. (2006). The dashed-point orange line
is the model of Menci et al. (2006). |
| Open with DEXTER |
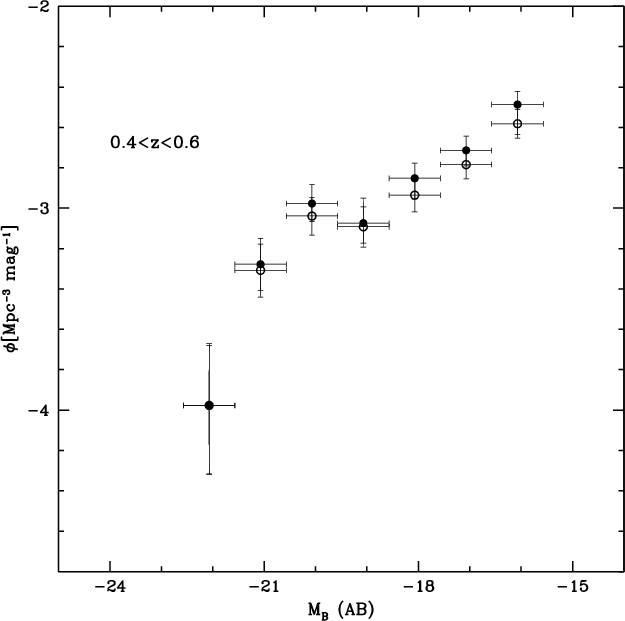
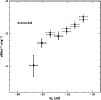 |
Figure 8:
LFs of
the red galaxies. The filled circles indicate the LF
obtained with the linear colour selection in Table 2. The
empty circles indicate the LF obtained from the colour histograms in
bins of magnitude (see Figs. 3 and
4). |
| Open with DEXTER |
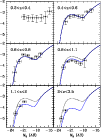 |
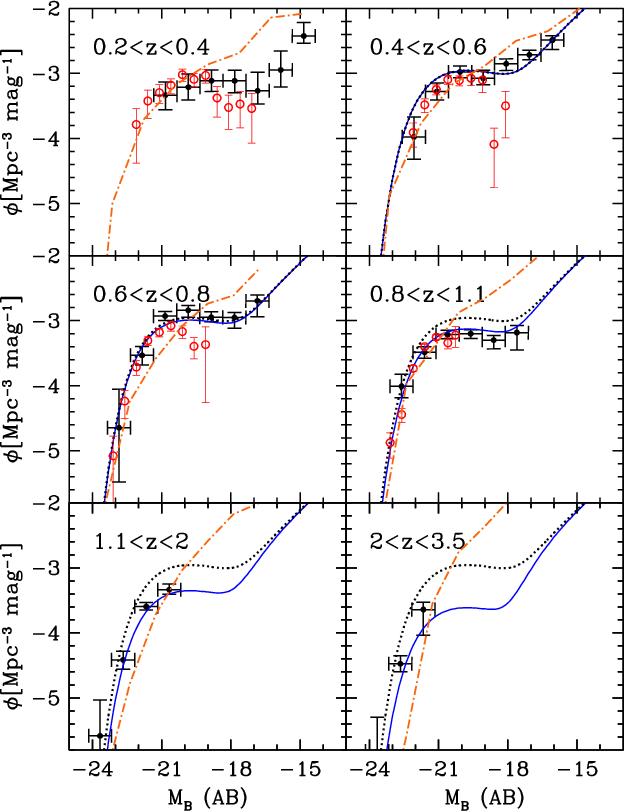
Figure 9:
LFs of the
early type galaxies as a function of redshift. The continuous curves
comes from our maximum likelihood analysis. The dotted line is our
fit at ,
reported for comparison in all the redshift
bins. The big filled circles are the points obtained with
 method.
 |
| Open with DEXTER |
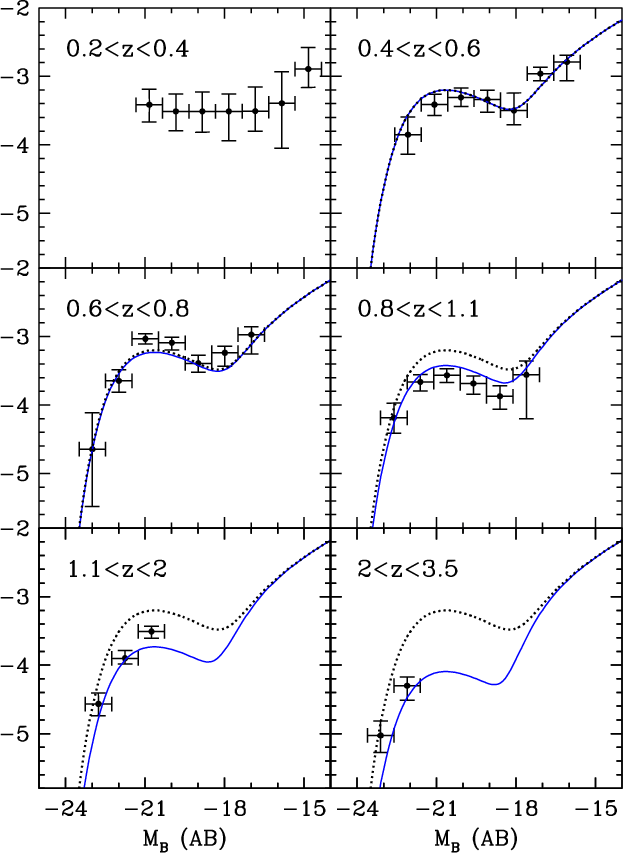
Concerning the red/early populations, our GOODS-MUSIC sample allows a
sampling of the red LF down to  up to
up to  ,
providing for the first time a direct evaluation of the faint shape
of the LF. This is due to the deeper K magnitude limit with respect to
that used in G05, allowing the evaluation of the rest frame U-Vcolour at magnitudes as faint as
,
providing for the first time a direct evaluation of the faint shape
of the LF. This is due to the deeper K magnitude limit with respect to
that used in G05, allowing the evaluation of the rest frame U-Vcolour at magnitudes as faint as
 .
At variance with
previous works that involve shallower samples, a peculiar LF shape
is present at z<0.8 with a minimum and a clear upturn at
.
At variance with
previous works that involve shallower samples, a peculiar LF shape
is present at z<0.8 with a minimum and a clear upturn at
 (Fig. 7).
This overabundance of faint objects, with respect to the
extrapolation of the Schechter function, was already found in the LF of local early type galaxies derived from the 2dF survey
(Madgwick et al. 2002). Although they used a different separation
criterion, their subsample called type 1 is not so different from
our subsample, being equivalent to a morphological sample of E, S0
and Sa. A similar upturn was also found in the local LF of red
galaxies derived from the Sloan survey by Blanton et al. (2005).
We checked that the characteristic shape found is not
critically dependent on the specific choice of the colour-magnitude
or SSFR -magnitude separation. Indeed, changing the parameters of
the linear fit in colour-SSFR separation at  level, the
shape and, in particular, the upturn, do not change appreciably. We also found
that the overall shape of the LF does not change if
we use a separation between blue and red galaxies found with an
analysis that has no assumption regarding the parametric dependence on the
rest-frame magnitude (see Sect. 4.2).
Moreover, when the bimodal
distribution in the faintest magnitude interval is fit with a double Gaussian
function (see Fig. 3,
-17<MB<-15), the contamination by any blue
population in the locus of the red population is not so strong. In
other words the FWHM of the blue Gaussian distribution is relatively
narrow. In this case, the expected fraction of blue galaxies expected
redward of the selected minimum is only 14% of the red population
in the same colour region. For this reason the shape of the red LF
shown in Fig. 8 relative to the redshift interval 0.4<z<0.6remains
almost unchanged in the two fainter magnitude bins if we remove this
small fraction.
level, the
shape and, in particular, the upturn, do not change appreciably. We also found
that the overall shape of the LF does not change if
we use a separation between blue and red galaxies found with an
analysis that has no assumption regarding the parametric dependence on the
rest-frame magnitude (see Sect. 4.2).
Moreover, when the bimodal
distribution in the faintest magnitude interval is fit with a double Gaussian
function (see Fig. 3,
-17<MB<-15), the contamination by any blue
population in the locus of the red population is not so strong. In
other words the FWHM of the blue Gaussian distribution is relatively
narrow. In this case, the expected fraction of blue galaxies expected
redward of the selected minimum is only 14% of the red population
in the same colour region. For this reason the shape of the red LF
shown in Fig. 8 relative to the redshift interval 0.4<z<0.6remains
almost unchanged in the two fainter magnitude bins if we remove this
small fraction.
Also for the red population we compared our LFs with those
derived from the major surveys of colour selected galaxies. In Fig. 7 we show the LF from the spectroscopic survey of
Willmer et al. (2006). For the red galaxies the agreement is good for
MB<-20, where the incompleteness is negligible in their sample
(see Fig. 8, Willmer et al. 2006). Their shallower sample cannot probe
the raise at the faint end present in our deeper data. The same
holds for the two photometric surveys of Bell et al. (2004) and
Brown et al. (2007).
Concerning the parametric analysis of the evolutionary LFs of the
red/early galaxy population, given the excess of faint objects, a
single Schechter shape does not provide an acceptable description of
the data. For this reason we adopted a double Schechter
function, as described in Eq. (4). The best fit
parameters are shown in Table 4. The best fit value of
the brighter Schechter slope is rather flat (
 ),
in agreement with what was found in G05 and in the Bell et al. sample.
The fainter slope is steeper, approaching the value
),
in agreement with what was found in G05 and in the Bell et al. sample.
The fainter slope is steeper, approaching the value
 .
As for the redshift evolution we adopted the density
evolution law described in Eq. (5) where the Schechter
shape at the faint end is kept constant at all redshifts. The
brighter one is constant only up to a given redshift
.
As for the redshift evolution we adopted the density
evolution law described in Eq. (5) where the Schechter
shape at the faint end is kept constant at all redshifts. The
brighter one is constant only up to a given redshift
 ,
beyond which it decreases as a power law in redshift. We find a
constant density up to
,
beyond which it decreases as a power law in redshift. We find a
constant density up to  and thereafter a decrease by a
factor of 5 up to
and thereafter a decrease by a
factor of 5 up to  .
.
The LF evolution of the early galaxies selected from their SSFR
value is very similar to that of the red ones, although the high
redshift density evolution is more pronounced with a decrease by a
factor of 10 in the interval
z=0.7-3.5. This difference is
caused by the presence, in the red sample at higher redshift, of a
high fraction of galaxies having SEDs consistent with those of a
dusty and starburst galaxy. This fraction amounts to 70% at
 and .
and .
Finally, the comparison with our hierarchical CDM model shows a
slight flattening of the LF at intermediate luminosities. This is because
galaxies with larger M/L
ratios are the main contributors to the red population; these are mainly
attained in massive objects (due to the
ineffectiveness of gas cooling, to their earlier conversion of gas
into stars, and to the effect of AGN feedback) or in low-mass
objects (due to the gas depletion originated from the different
feedback mechanisms, particularly effective in shallow potential
wells).
However, the model still overpredicts the LF at faint
magnitudes; the origin of such an effect
(probably originated at high-redshifts) will be investigated in a future paper.
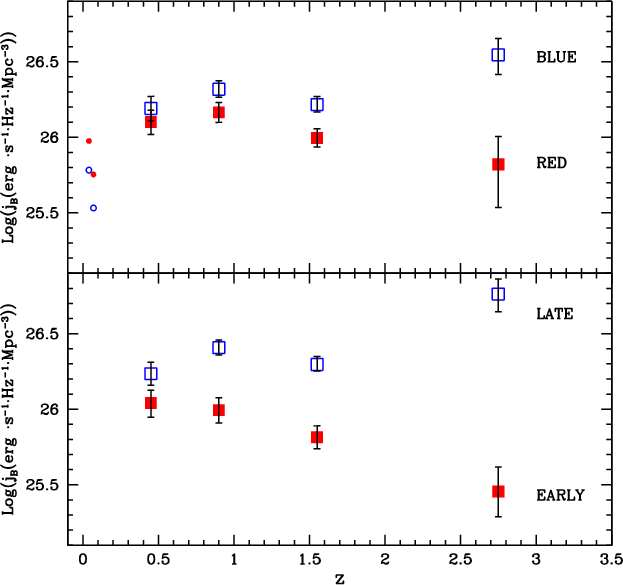
To compare in a global way the redshift evolution of the blue and
red galaxies we computed the B band luminosity densities of the
two populations as a function of redshift. To make the comparison
homogeneous we computed the contribution of the same bright
population with
 at all redshifts. The results
are shown in Fig. 10 for the blue/red and late/early
populations. The redshift bins are selected to have a comparable
number of objects in the considered magnitude range. In fact for the
highest redshift bin the lowest luminosity of the data is
MB(AB)=-21. For this reason we added the contribution of the
fainter sources using the extrapolation of the parametric LF.
at all redshifts. The results
are shown in Fig. 10 for the blue/red and late/early
populations. The redshift bins are selected to have a comparable
number of objects in the considered magnitude range. In fact for the
highest redshift bin the lowest luminosity of the data is
MB(AB)=-21. For this reason we added the contribution of the
fainter sources using the extrapolation of the parametric LF.
The uncertainty associated with the luminosity density is the sum in
quadrature of the error estimated through jackknife![[*]](/icons/foot_motif.gif) (Efron 1982) analysis, and of the error obtained from
the MonteCarlo analysis as described in Sect. 5.1.
The first contribution is associated with the clustering properties
of the field and the second with the photometric uncertainties.
Local luminosity densities, obtained from the integration of the LFs
by Madgwick et al. (2002) (z=0.04) and Bell et al. (2003) (z=0.07), are
also included for comparison.
(Efron 1982) analysis, and of the error obtained from
the MonteCarlo analysis as described in Sect. 5.1.
The first contribution is associated with the clustering properties
of the field and the second with the photometric uncertainties.
Local luminosity densities, obtained from the integration of the LFs
by Madgwick et al. (2002) (z=0.04) and Bell et al. (2003) (z=0.07), are
also included for comparison.
The blue/late galaxies increase their luminosity density steadily up
to ,
while the luminosity density of the red/early
population is nearly constant up to
and then decreases by
a factor 3 at .
This confirms our previous result
presented in G05, which shows an appreciable decline of the bright
red/early population only at z>1. As already noted this is not in
qualitative contrast with the hierarchical scenario, since the
bright and hence massive early population is developing early in the
cosmic time in specific overdense regions where the evolution is
also accelerated by merging processes. However, the detailed
quantitative agreement of the LFs predicted by specific models
depends on the details of the main physical processes and a
satisfactory agreement is not yet obtained, especially at fainter
magnitudes (see previous section).
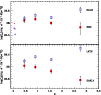 |
Figure 10:
Upper panel: galaxy luminosity density for red (filled squares) and blue
galaxies (empty squares). Lower panel: the same as the upper panel
but for early type galaxies (filled squares) and late type galaxies
(empty squares). Small points are the local luminosity density
estimates by Madgwick et al. (2002) (z=0.04) and Bell et al. (2003)
(z=0.07). |
| Open with DEXTER |
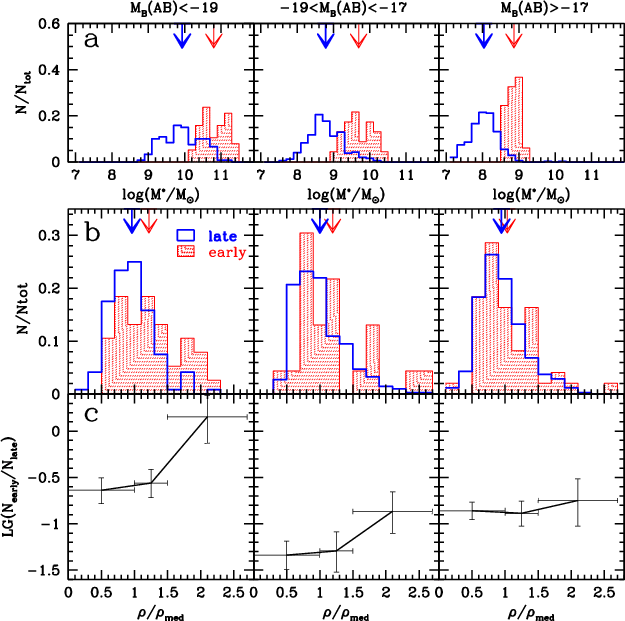
As shown in the previous section, the presence of an upturn in the
LF of the red galaxy population at faint magnitudes is a new feature
emerging from the analysis of deep NIR selected galaxies, with
respect to previous works at this redshift. To derive hints on the
nature of the population responsible for this excess we
analysed their colour and spatial properties.
The peculiar shape of the LF, represented by a double Schechter form,
appears similar to that obtained for galaxies in local rich
clusters. Indeed, recent studies of the total galaxy LFs in clusters selected
from the RASS-SDSS survey show an
upturn at faint Mr that depends on the distance from the cluster
centre (Popesso et al. 2006). The main contribution to this local excess
comes from the red population selected with u -r>2.22(Strateva et al. 2001). They also noted that the ratio between red
and blue galaxies increases with the density in the clusters.
It is interesting to explore whether a dependence on the environment
is present for our faint early subsample. To this end, we
adopted a 2D density analysis of the 20 first-neighbour method. We
describe here briefly the procedure adopted to derive densities,
while we refer to Trevese et al. (2007) for a detailed description of
the method. A 2D density was assigned to each object and a
density map was derived in the field in the redshift interval
z=0.4 -0.6.
A surface density
 |
(6) |
of galaxies was computed considering the projected distances Dp,n to the nth nearest neighbour, as done by Dressler
(Dressler 1980; Dressler et al. 1997). We divide the survey area in cells whose
extension depends on the observational accuracy. For each cell we
count neighbouring objects at increasing radial distance until a
number n=20 of objects is reached. In counting galaxies we must
take into account the increase of limiting luminosity with
increasing redshift for a given flux limit. If
 is the
limiting (apparent) magnitude in a fixed observing band, at each
redshift z we only detect objects brighter than an absolute
magnitude
is the
limiting (apparent) magnitude in a fixed observing band, at each
redshift z we only detect objects brighter than an absolute
magnitude
 ,
decreasing (brightening) with z . We
assume the lower limit of the interval as reference redshift zc,
below which we detect all objects brighter than the relevant
,
decreasing (brightening) with z . We
assume the lower limit of the interval as reference redshift zc,
below which we detect all objects brighter than the relevant
 ,
which is the magnitude of the faintest galaxy
in the B band among the objects we are considering. At z > zc the
fraction of detected objects is:
,
which is the magnitude of the faintest galaxy
in the B band among the objects we are considering. At z > zc the
fraction of detected objects is:
 |
(7) |
where  is the type and z-dependent galaxy B-band LF presented above.
Thus, in evaluating the galaxies number
density, we apply a limiting magnitude correction by assigning
a weight
w(z)=1/s(z) to each detected galaxy of redshift z. In
this way, we have evaluated the surface density field and assigned a
density value to each object.
is the type and z-dependent galaxy B-band LF presented above.
Thus, in evaluating the galaxies number
density, we apply a limiting magnitude correction by assigning
a weight
w(z)=1/s(z) to each detected galaxy of redshift z. In
this way, we have evaluated the surface density field and assigned a
density value to each object.
For our analysis we selected galaxies in three magnitude
regions: an intermediate region,
-19<MB(AB)<-17, where the LF of
the early population is flat, and two external steeper regions at
the bright and faint end of the LF,
MB(AB)<-19 and
MB(AB)>-17,
respectively.
 |
Figure 11:
Panel a): stellar mass distribution for the early and late population, the
area of each histogram is normalised to unity. The arrows indicate
the mean value of the stellar mass for the early population (thin
arrow) and for the late population (thick arrow). Panel b): as
for panel a) but for the distribution of
 .
Panel c): early type galaxies vs. late type galaxies fraction as a function
of the density contrast ( .
Panel c): early type galaxies vs. late type galaxies fraction as a function
of the density contrast (
 ). ). |
| Open with DEXTER |
First of all we note that early galaxies represent the most massive
galaxies in each luminosity interval (Fig. 11, panel a).
In particular, even at the faint end of the LF the early population is
clearly segregated in stellar mass with values one order of magnitude greater
on average with respect to the late population.
Looking to the brightest fraction, a clear difference as a function of
the density of the environment is found between the early and the late
populations. In particular, early galaxies tend to populate regions of
higher density. This is shown in Fig. 11, panels b and c,
where the two
distributions are represented as a function of the density of the
environment. The ratio early/late increases with density since the
average density of the early galaxies is somewhat greater (1.4)
with respect to the one of the late population.
This different behaviour becomes less evident with decreasing
luminosity and almost disappears at the faint end of the two LFs. We
note in this respect that the limited area covered by our sample does
not allow an evaluation of the environment dependence up to the high
densities that are typical of clusters, like those probed by the Sloan
survey for example.
Thus, the scenario that emerges is one where major evolutionary
differences between the early and late populations act in the
relatively bright galaxies, with M<-17 producing the largest
differences in the shapes of the two LFs in the interval
-21<MB(AB)<-18 (flat shape for the early, steep for the late). At
faint magnitudes the two LFs tend to converge to the same volume
density. From this analysis the characteristic shape of the
red/early LF does not seem to depend strongly on the environmental
properties.
We have used a composite sample of galaxies selected in deep NIR
images, obtained from the GOODS public survey, to study the evolution
of the galaxy LFs of red/early and blue/late galaxy populations
selected using the colour and SSFR statistical properties of the sample.
The observed U-V colour and SSFR distributions show a
clear bimodality up to ,
confirming the results obtained in
G05 at a higher level of statistical confidence. We found a
trend with redshift for the colour magnitude distribution with
an intrinsic blueing of about 0.15 mag. in the redshift interval
z=0.4-2.0 for both populations. This observed bimodality can be
explained in a hierarchical clustering scenario as being due to the
different star formation histories of the red/early and blue/late
galaxies (see e.g. Menci et al. 2006).
For the total and the blue/late sample, the LF is well described by a
Schechter function and shows a mild luminosity evolution in the
redshift interval z=0.2-1 (e.g.
for the
total sample;
 for the blue/late fraction), while
at higher redshifts the LFs are consistent with no evolution. A
comparison with our hierarchical CDM model shows a good agreement at
bright and intermediate magnitudes. A better agreement of the model
was also found at fainter magnitudes due to the suppression of
star formation in small objects by the action of an ionising UV
background.
for the blue/late fraction), while
at higher redshifts the LFs are consistent with no evolution. A
comparison with our hierarchical CDM model shows a good agreement at
bright and intermediate magnitudes. A better agreement of the model
was also found at fainter magnitudes due to the suppression of
star formation in small objects by the action of an ionising UV
background.
The shape of the red/early luminosity function is better constrained
only at low and intermediate redshifts and it shows an excess of
faint red dwarfs with respect to the extrapolation of a flat
Schechter function. In fact a minimum around magnitude
MB(AB)=-18is present together with an upturn at fainter magnitudes. This
peculiar shape is represented by the sum of two Schechter
functions.
We found that the bright one is constant up to ,
beyond
which it decreases in density by a factor of 5 (10 for the early
galaxies) up to redshift .
The comparison with our
hierarchical CDM model shows that, although the predicted LF has a
slight flattening at intermediate luminosity, the model still
overpredicts the LF at faint magnitudes. The bright end of the blue and
red LFs at low and intermediate redshifts are in good agreement
with recent estimates from the DEEP2 spectroscopic survey. As a
consequence of this complex evolutionary behaviour, the
luminosity densities of the relatively bright
(
MB(AB)<-20.2) red/early and blue/late galaxies show a
bifurcation beyond redshift .
Indeed, the luminosity density of the
blue/late population keeps increasing up to
,
while the luminosity density of red/early galaxies decreases by
a factor of 2-3 in the z=1-3.5 interval, respectively.
To obtain hints on the nature of the galaxies responsible for
the peculiar shape of the red/early LF, we performed an
analysis of their stellar masses and spatial distribution. We found
that the early galaxies have systematically higher stellar masses,
with respect to the late ones, for a given B band luminosity.
Brighter early galaxies have a spatial distribution more
concentrated in higher density regions when compared to the late
ones of the same luminosity class. On the contrary, fainter
early and late galaxies show a very similar spatial distribution.
Thus, the different environmental properties do not seem to be
responsible for the difference in shape at
intermediate magnitudes between the blue and red LFs. The latter
seems to stem from the different star formation and feedback
histories corresponding to different possible merging trees
(evolutionary paths) leading to the final assembled galaxy; this
specific history, driving the evolution of the star formation,
leads to the different M/L ratios characterising the different
properties of blue/late and red/early galaxies. In summary, the
peculiar shape of the red LF is mainly driven by the nature
of the galaxy merging tree rather than by the nurture where
the galaxy has grown.
Acknowledgements
We thank the anonymous referee for his/her helpful comments, that
led to a significant improvement of the paper. We thank the whole
GOODS Team for providing all the imaging material available
worldwide. Observations have been carried out using the Very Large
Telescope at the ESO Paranal Observatory under Program IDs
LP168.A-0485 and ID 170.A-0788 and the ESO Science Archive under
Program IDs 64.O-0643, 66.A-0572, 68.A-0544, 164.O-0561, 163.N-0210
and 60.A-9120.
- Arnouts, S.,
Walcher, C. J., Le Fevre, O., et al. 2007, ArXiv e-prints,
705
- Avni, Y., &
Bahcall, J. N. 1980, ApJ, 235, 694 [NASA ADS] [CrossRef]
(In the text)
- Baldry, I. K.,
Glazebrook K., Brinkmann J., et al. 2004, ApJ, 600, 681 [NASA ADS] [CrossRef]
- Baldry, I. K.,
Balogh, M. L., Bower, R. G., et al. 2006, MNRAS, 373, 469 [NASA ADS] [CrossRef]
- Bell, E. F.,
McIntosh, D. H., Katz, N., & Weinberg, M. D. 2003, ApJS, 149,
289 [NASA ADS] [CrossRef]
- Bell, E. F., Wolf,
C., Meisenheimer, K., et al. 2004, ApJ, 608, 752 [NASA ADS] [CrossRef]
- Blanton, M.
R., Lupton, R. H., Schlegel, D. J., et al. 2005, ApJ, 631,
208 [NASA ADS] [CrossRef]
- Brown, M. J. I.,
Dey, A., Jannuzi, B. T., et al. 2007, ApJ, 654, 858 [NASA ADS] [CrossRef]
(In the text)
- Bruzual, G.,
& Charlot, S. 2003, MNRAS, 344, 1000 [NASA ADS] [CrossRef]
(In the text)
- Cameron, E.,
& Driver, S. P. 2007, MNRAS, 377, 523 [NASA ADS] [CrossRef]
(In the text)
-
Castellano, M., Salimbeni, S., Trevese, D., et al. 2007, ArXiv
e-prints, 707
-
Cirasuolo, M., McLure, R. J., Dunlop, J. S., et al. 2007,
MNRAS, 380, 585 [NASA ADS] [CrossRef]
- Cooper, M. C.,
Newman, J. A., Coil, A. L., et al. 2007, MNRAS, 376, 1445 [NASA ADS] [CrossRef]
- Cucciati, O.,
Iovino, A., Marinoni, C., et al. 2006, A&A, 458, 39 [NASA ADS] [CrossRef] [EDP Sciences]
- Davis, M., Faber,
S. M., Newman, J., et al. 2003, in Discoveries and Research
Prospects from 6- to 10-Meter-Class Telescopes II, ed. G. Puragra.
Proc. SPIE, 4834, 161
- Dekel, A., &
Birnboim, Y. 2006, MNRAS, 368, 2 [NASA ADS]
- Dressler, A. 1980, ApJ,
236, 351 [NASA ADS] [CrossRef]
- Dressler, A., Oemler,
A. J., Couch, W. J., et al. 1997, ApJ, 490, 577 [NASA ADS] [CrossRef]
- Driver, S. P.,
Allen, P. D., Graham, A. W., et al. 2006, MNRAS, 368, 414 [NASA ADS]
- Efron, B. 1982,
The Jackknife, the Bootstrap and other resampling plans, CBMS-NSF
Regional Conference Series in Applied Mathematics, Philadelphia:
Society for Industrial and Applied Mathematics (SIAM)
(In the text)
- Ellis, R. S.
1997, ARA&A, 35, 389 [NASA ADS] [CrossRef]
- Faber, S. M., Willmer, C.
N. A., Wolf, C., et al. 2007, ApJ, 665, 265 [NASA ADS] [CrossRef]
- Fioc, M., &
Rocca-Volmerange, B. 1997, A&A, 326, 950 [NASA ADS]
(In the text)
- Fontana, A.,
D'Odorico, S., Poli, F., et al. 2000, AJ, 120, 2206 [NASA ADS] [CrossRef]
(In the text)
- Fontana, A.,
Pozzetti, L., Donnarumma, I., et al. 2004, A&A, 424,
23 [NASA ADS] [CrossRef] [EDP Sciences]
(In the text)
- Fontana, A.,
Salimbeni, S., Grazian, A., et al. 2006, A&A, 459,
745 [NASA ADS] [CrossRef] [EDP Sciences]
-
Franceschini, A., Rodighiero, G., Cassata, P., et al. 2006,
A&A, 453, 397 [NASA ADS] [CrossRef] [EDP Sciences]
- Gabasch, A.,
Bender, R., Seitz, S., et al. 2004, A&A, 421, 41 [NASA ADS] [CrossRef] [EDP Sciences]
(In the text)
- Gabasch, A.,
Hopp, U., Feulner, G., et al. 2006, A&A, 448, 101 [NASA ADS] [CrossRef] [EDP Sciences]
- Gehrels, N.
1986, ApJ, 303, 336 [NASA ADS] [CrossRef]
(In the text)
- Giallongo,
E., D'Odorico, S., Fontana, A., et al. 1998, AJ, 115,
2169 [NASA ADS] [CrossRef]
(In the text)
- Giallongo, E.,
Salimbeni, S., Menci, N., et al. 2005, ApJ, 622, 116 [NASA ADS] [CrossRef]
- Grazian, A., Fontana,
A., de Santis, C., et al. 2006a, A&A, 449, 951 [NASA ADS] [CrossRef] [EDP Sciences]
(In the text)
-
Grazian, A., Fontana, A., Moscardini, L., et al. 2006b,
A&A, 453, 507 [NASA ADS] [CrossRef] [EDP Sciences]
- Grazian, A.,
Salimbeni, S., Pentericci, L., et al. 2007, A&A, 465,
393 [NASA ADS] [CrossRef] [EDP Sciences]
- Heyl, J., Colless,
M., Ellis, R. S., & Broadhurst, T. 1997, MNRAS, 285, 613 [NASA ADS]
(In the text)
- Hogg, D. W.,
Blanton, M. R., Brinchmann, J., et al. 2004, ApJ, 601,
L29 [NASA ADS] [CrossRef]
- Ilbert, O., Tresse, L.,
Zucca, E., et al. 2005, A&A, 439, 863 [NASA ADS] [CrossRef] [EDP Sciences]
(In the text)
- Ilbert, O.,
Lauger, S., Tresse, L., et al. 2006, A&A, 453, 809 [NASA ADS] [CrossRef] [EDP Sciences]
- James, F., &
Roos, M. 1995, MINUIT Function Mininmization and Error Analysis,
version 95.03 (CERN Program Libr. Long Writeup D506; Geneva:
CERN)
(In the text)
- Labbé, I.,
Franx, M., Rudnick, G., et al. 2007, ApJ, 665, 944 [NASA ADS] [CrossRef]
(In the text)
- Madgwick,
D. S., Lahav, O., Baldry, I. K., et al. 2002, MNRAS, 333,
133 [NASA ADS] [CrossRef]
-
Marchesini, D., van Dokkum, P., Quadri, R., et al. 2007, ApJ,
656, 42 [NASA ADS] [CrossRef]
- Mateus A.,
Sodré, L., Cid Fernandes, R., & Stasinska, G. 2007, MNRAS,
374, 1457 [NASA ADS] [CrossRef]
- Menci, N.,
Fontana, A., Giallongo, E., & Salimbeni, S. 2005, ApJ, 632,
49 [NASA ADS] [CrossRef]
- Menci, N.,
Fontana, A., Giallongo, E., Grazian, A., & Salimbeni, S. 2006,
ApJ, 647, 753 [NASA ADS] [CrossRef]
- Norberg, P.,
Cole, S., Baugh, C. M., et al. 2002, MNRAS, 336, 907 [NASA ADS] [CrossRef]
-
Pentericci, L., Grazian, A., Fontana, A., et al. 2007,
A&A, 471, 433 [NASA ADS] [CrossRef] [EDP Sciences]
- Poli, F.,
Giallongo, E., Fontana, A., et al. 2003, ApJ, 593, L1 [NASA ADS] [CrossRef]
(In the text)
- Popesso, P., Biviano,
A., Böhringer, H., & Romaniello, M. 2006, A&A, 445,
29 [NASA ADS] [CrossRef] [EDP Sciences]
(In the text)
- Pozzetti,
L., Cimatti, A., Zamorani, G., et al. 2003, A&A, 402,
837 [NASA ADS] [CrossRef] [EDP Sciences]
- Sandage, A.,
Tammann, G. A., & Yahil, A. 1979, ApJ, 232, 352 [NASA ADS] [CrossRef]
(In the text)
-
Somerville, R. S., & Primack, J. R. 1999, MNRAS, 310, 1087 [NASA ADS] [CrossRef]
(In the text)
- Strateva,
I., Ivezic, Z., Knapp, G. R., et al. 2001, AJ, 122, 1861 [NASA ADS] [CrossRef]
- Trevese, D.,
Castellano, M., Fontana, A., & Giallongo, E. 2007, A&A,
463, 853 [NASA ADS] [CrossRef] [EDP Sciences]
(In the text)
- Trujillo,
I., Förster Schreiber, N. M., Rudnick, G., et al. 2006,
ApJ, 650, 18 [NASA ADS] [CrossRef]
(In the text)
- Weiner, B. J.,
Phillips, A. C., Faber, S. M., et al. 2005, ApJ, 620, 595 [NASA ADS] [CrossRef]
- Willmer, C. N. A.,
Faber, S. M., Koo, D. C., et al. 2006, ApJ, 647, 853 [NASA ADS] [CrossRef]
- Wolf, C.,
Meisenheimer, K., Rix, H. W., et al. 2003, A&A, 401,
73 [NASA ADS] [CrossRef] [EDP Sciences]
Copyright ESO 2008
![\begin{figure}
\par\resizebox{8.8cm}{!}{\includegraphics[width=9cm]{7959fig1.ps}}
\end{figure}](/articles/aa/full/2008/03/aa7959-07/img36.gif)
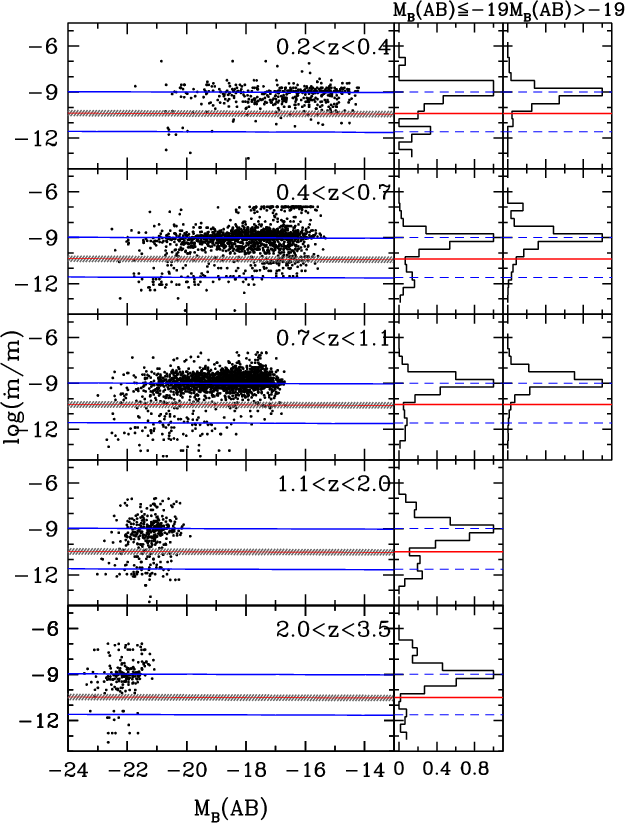
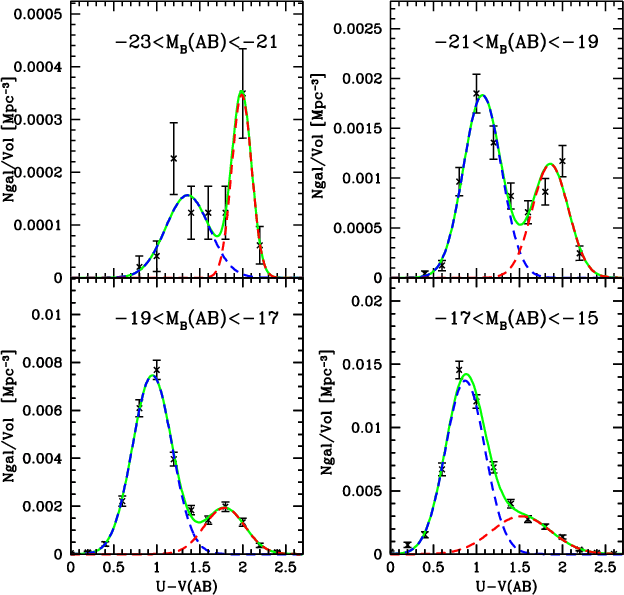
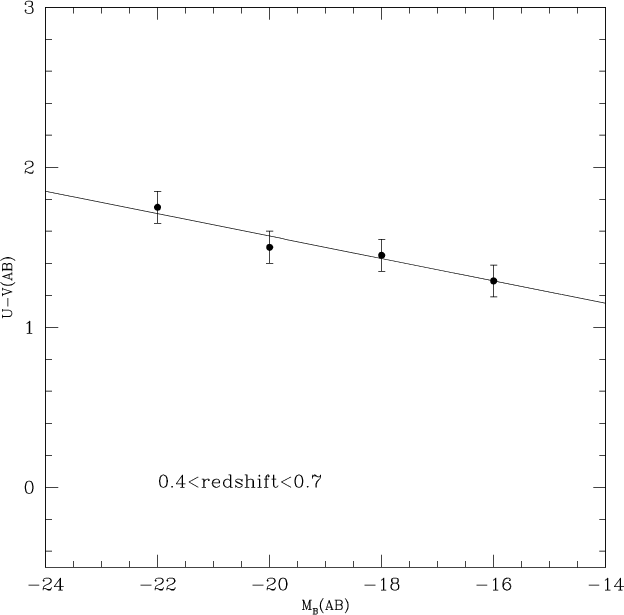
![$\displaystyle \times \left(\left[10^{0.4\left(M^*_{f}-M\right)}\right]^{1+\alpha_{f}}\exp
\left[-10^{0.4(M^*_{f}-M)}\right]\right)$](/articles/aa/full/2008/03/aa7959-07/img70.gif)