![[*]](/icons/foot_motif.gif) ,
,
A&A 475, 539-547 (2007)
DOI: 10.1051/0004-6361:20078341
,L. Prisinzano1 - S. Randich2
1 - INAF - Osservatorio Astronomico di Palermo,
Piazza del Parlamento 1, 90134 Palermo, Italy
2 -
INAF - Osservatorio Astronomico di Arcetri,
Largo E. Fermi 5, 50125 Firenze, Italy
Received 24 July 2007 / Accepted 7 September 2007
Abstract
Context. Old open clusters are very useful targets to investigate mechanisms responsible for lithium (Li) depletion during the main sequence. Comparison of the Li abundances in clusters of different age allows us to understand the efficiency of the Li destruction process.
Aims. To determine the membership and Li abundance in a sample of candidate members of the open cluster NGC 3960 (age  1 Gyr), aiming to fill the gap between 0.6 and 2 Gyr in the empirical description of the behavior of the average Li abundance as a function of the stellar age.
Methods. We use VLT/FLAMES Giraffe spectra to determine the radial velocities and thus the membership of a sample of 113 photometrically selected candidate cluster members. From the analysis of the Li line we derive Li abundances for both cluster members and non-members.
Results. 39 stars have radial velocities consistent with membership, with an expected fraction of contaminating field stars of about 20%. Li is detected in 29 of the radial velocity members; we consider these stars as cluster members, while we make the reasonable assumption that the remaining 10 radial velocity members without Li are among the contaminating stars. Li abundances of the stars hotter than about 6000 K are similar to those of stars in the Hyades, while they are slightly smaller for cooler stars. This confirms that NGC 3960 is older than the Hyades.
Conclusions. The average Li abundance of stars cooler than about 6000 K indicates that the Li Pop. I plateau might start at 1 Gyr, rather than 2 Gyr, which is the upper limit previously derived in the literature. We also find that the fraction of field stars with high Li abundance ( 1.5) is about one third of the whole sample, which is in agreement with previous estimates. The fraction of contaminating field stars is consistent with that previously derived by us from photometry.
Key words: stars: abundances - stars: evolution - Galaxy: open clusters and associations: individual: NGC 3960
We have carried out a VLT/FLAMES project aimed at deriving homogeneous information for a sample of 11 old OCs (ages greater than about 0.9 Gyr) with the aim of a) deriving their chemical composition from UVES spectra of evolved stars, and b) determining their radial velocities and thus membership, together with lithium (Li) abundances from Giraffe spectra of turn-off (TO) and main sequence (MS) cluster candidates (Randich et al. 2005; Pallavicini et al. 2006). In this paper we focus on Giraffe observations of NGC 3960, the youngest OC in our sample.
In the last few years, this cluster has been the object of
different photometric and spectroscopic studies, which have allowed
a more accurate determination of its parameters. Bragaglia et al. (2006)
derived an age between 0.6 and 0.9 Gyr, a distance modulus
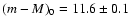 ,
a reddening
,
a reddening
 ,
with differential
reddening
,
with differential
reddening
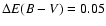 .
A slightly older
age (in the range 0.9-1.4 Gyr) was derived by Prisinzano et al. (2004) who
also estimated the cluster mass function from the luminosity
function in the V and J bands,
finding a slope
.
A slightly older
age (in the range 0.9-1.4 Gyr) was derived by Prisinzano et al. (2004) who
also estimated the cluster mass function from the luminosity
function in the V and J bands,
finding a slope
 for
masses above 1
for
masses above 1  .
Note that the contamination from field stars
was taken into account using a control field and performing a statistical
subtraction. A spectroscopic [Fe/H]
.
Note that the contamination from field stars
was taken into account using a control field and performing a statistical
subtraction. A spectroscopic [Fe/H]
 was derived by
Bragaglia et al. (2006), while Sestito et al. (2006)
report a slightly higher value [Fe/H]
was derived by
Bragaglia et al. (2006), while Sestito et al. (2006)
report a slightly higher value [Fe/H]
 :
in
both cases the metallicity is consistent with the solar value.
:
in
both cases the metallicity is consistent with the solar value.
Given its age (we assume here 0.9 Gyr), NGC 3960 provides a good sample
to investigate the evolution of lithium abundance during the MS and,
in particular, to fill the gap in age coverage between the Hyades (0.6 Gyr)
and the 1.5-2.0 Gyr clusters for which Li data are available
(NGC 752, IC 4651).
Sestito & Randich (2005) investigated the timescales for Li depletion
during the MS for F and G-type stars,
by means of a homogeneous re-analysis of Li data for several open clusters.
They suggested that Li depletion is not a continuous process, but is
instead characterized by different timescales in different age intervals.
In particular, they showed that Li depletion slows down after the Hyades age
for stars in the temperature range 6050-6350 K, while it stops
for cooler stars. Namely, for stars cooler
than 6050 K, a plateau in Li abundance
is seen for ages older than 2 Gyr;
this age, however, represents an upper limit to the actual age when Li depletion
is no longer efficient. A more precise estimate of this age, which would
provide a useful constraint to models including extra-mixing during the MS,
requires Li data for clusters with ages between 0.6-2 Gyr.
We also mention in passing that since the study of Sestito & Randich (2005) has been
used to infer the age of stars hosting extra-solar planets
(e.g. Sozzetti et al. 2007), a finer sampling
of the 0.6-2 Gyr interval would allow these stars to be age dated with higher
accuracy.
Besides allowing measurements of Li abundances, our Giraffe spectra have been used to determine radial velocities and cluster membership for the observed candidates. This in turn will allow us to perform a revised analysis of contamination from field stars and cluster mass function.
Our paper is structured as follows: in Sect. 2 we describe the criterion adopted to select the spectroscopic targets and observations, and in Sect. 3 we report the analysis of the spectra, including the procedure used to derive the radial velocity (RV) and the equivalent width (EW) of the Li line. In Sect. 4 we describe how we derive the effective temperatures and the Li abundances of our targets. In Sect. 5, we discuss the Li abundances for both the cluster members and the field stars, by comparing our results with those of stars of similar spectral type taken from literature. We also compare the fraction of contaminating field stars in the spectroscopic sample with that previously obtained statistically from photometric data. Our conclusions are presented in Sect. 7.
 from the cluster centroid.
In total, we observed 113 candidate members
on the MS with
from the cluster centroid.
In total, we observed 113 candidate members
on the MS with
 ,
corresponding
to spectral-types from F to early K:
stars with V larger than 18 are too cool and faint to
reach a S/N ratio
larger than 40, which is required to accurately measure the RVs
and EWs; stars brighter than 16 are hotter than early F stars and therefore are
not good targets to investigate Li depletion in old MS stars.
,
corresponding
to spectral-types from F to early K:
stars with V larger than 18 are too cool and faint to
reach a S/N ratio
larger than 40, which is required to accurately measure the RVs
and EWs; stars brighter than 16 are hotter than early F stars and therefore are
not good targets to investigate Li depletion in old MS stars.
In Fig. 1 we show
the V vs. V-I color-magnitude diagram
for the region within 7
from the
centroid of NGC 3960 (dots) where photometry is corrected
for differential reddening.
![\begin{figure}
\par\includegraphics[width=8.2cm]{8341fig1.ps} \end{figure}](/articles/aa/full/2007/44/aa8341-07/img13.gif) |
Figure 1:
Color-magnitude diagram for the region within 7
from the
centroid of NGC 3960 (dots). Photometry is from Prisinzano et al. (2004)
and it is corrected
for differential reddening. Targets observed with VLT/FLAMES are indicated
with large symbols: filled circles are those with RV consistent with
that of the cluster and empty squares are non-members having the RV different from the cluster members (see Sect. 3.1.1).
The two stars indicated with the X symbols are candidate
spectroscopic binaries (SB2). |
| Open with DEXTER | |
The observations were carried out in Service Mode during February, March
and April 2004; the log of the observations is provided in Table 1.
The cluster was covered by one configuration centered at
RA
 50
50 31
31 .400
Dec
(2000)=-55
.400
Dec
(2000)=-55 41
12
41
12
 80. Giraffe was used
in conjunction with the 316 lines/mm grating and order
sorting filters 14 (HR14) and 15 (HR15), yielding nominal
resolving powers R=28 800 and 19 300, respectively.
Spectral
coverages are from 630.8 to 670.1 for HR14 and from
660.7 to 696.5 nm for HR15; they include H
80. Giraffe was used
in conjunction with the 316 lines/mm grating and order
sorting filters 14 (HR14) and 15 (HR15), yielding nominal
resolving powers R=28 800 and 19 300, respectively.
Spectral
coverages are from 630.8 to 670.1 for HR14 and from
660.7 to 696.5 nm for HR15; they include H ,
the
Li I 670.8 nm line and several features to be used for RV measurements. For each set-up, four 45 min exposures were obtained.
,
the
Li I 670.8 nm line and several features to be used for RV measurements. For each set-up, four 45 min exposures were obtained.
Table 1: Log-book of Giraffe/FLAMES observations. Columns 1-4 give the observation date, original name associated with each observing block, exposure time, and grating used for each exposure, respectively.
Data reduction was carried out using the GIRAFFE BLDRS
pipeline,
following the standard procedure and steps (Blecha & Simond 2004).
Sky subtraction for the spectrum of each set-up and each exposure
was performed separately, namely by subtracting the median,
computed as in Jeffries & Oliveira (2005),
of the 16 sky fiber spectra observed in the same exposure.
The four sky-subtracted spectra of each target obtained with the
HR15 set-up were then co-added,
after applying the Doppler correction due to the different date of
observations.
Examples of final co-added sky-subtracted spectra around the Li line
are shown in
Fig. 2. S/N ratios are 80
for the stars OC21-M342 and OC21-M42
and 55 for OC21-M205 and
OC21-M359.
Final S/N ratios range between 30 and 80, as estimated from the faintest and the
brightest stars in our sample.
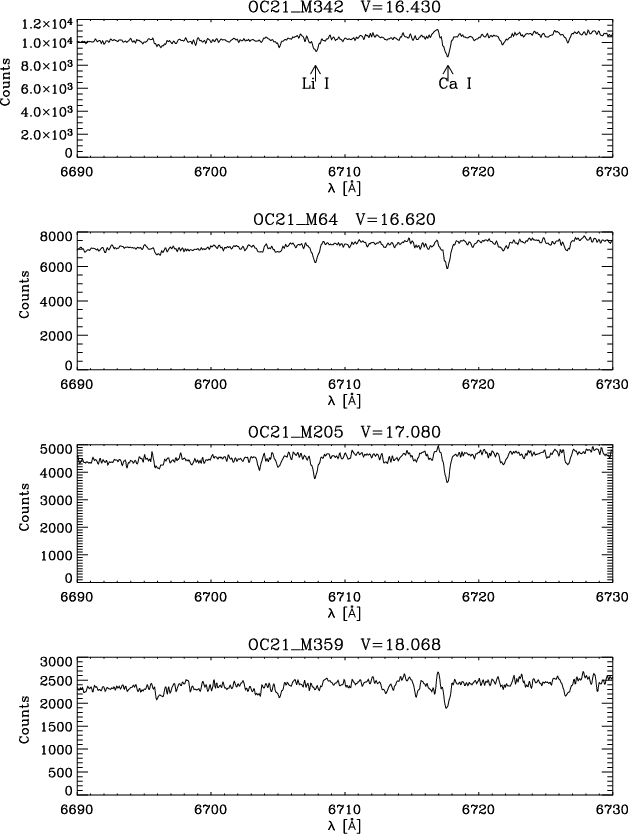 |
Figure 2: Examples of co-added sky-subtracted spectra in the spectral region that includes the Li line. The GIRAFFE ID given in Table 4 and the V magnitude of the stars are indicated. |
| Open with DEXTER | |
RVs in the heliocentric system
of the 8 sets of spectra were computed using the
function giCrossC of the GIRAFFE
girBLDR pipeline.
We computed the cross-correlation function between all
the observed spectra and the synthetic template spectrum girKO
corresponding to a K0V star.
We used a delta RV limit to the cross-correlation window
of 500 km s-1
in the wavelength ranges [6310-6680] Å,
for the spectra around the Li line,
and [6610-6810] Å,
for the spectra around the H
line.
Final RVs for the stars of our sample were computed as the mean value and the standard deviation of the RVs obtained with giCrossC from the 8 different sets of spectra.
The RVs obtained using the function giCrossC
as described before were compared with those obtained by using
a different template spectrum, girG2, which corresponds to a spectrum of a
solar-type star. The comparison does not evidence
significant differences. In addition, in
order to check the reliability of the automatic cross-correlation performed
by the pipeline, we computed the RV for 4 of the 8 sets of spectra using
the IRAF
task FXCOR (Tonry & Davis 1979); as template we used the spectrum
of a relatively bright star (V=16.5, spectral type F8V)
from our sample, which is considered a reliable cluster member, based on its
RV as measured with giCrossC. The relative RVs computed with
FXCOR were converted into the heliocentric system using
the heliocentric
RV of the template star computed with giCrossC.
The median of the differences between the four sets of RVs obtained with
giCrossC RVs minus FXCOR RVs are
0.13, -0.34, 0.12 and -1.05 Km s-1,
while the standard deviations are 2.13, 2.16, 1.81 and 2.10 Km s-1.
Such values indicate an excellent agreement
between the two methods.
The difference between the mean RVs obtained with the two methods
shows that only 8 stars
(OC21-M80, OC21-M273, OC21-M581,
OC21-M324, OC21-M282,
OC21-M185, OC21-M177, OC21-M41)
have a difference in the mean RV obtained with the two methods larger
than 5 km s-1 and only 2 (OC21-M80 and OC21-M282)
have a difference larger than 10 km s-1.
These objects do not show the Li line and 7 of them
are not cluster members since they have a RV
not consistent with that of the cluster
(see next section). The only star classified
as a cluster member (OC21-M273) based on its
RV does not show the Li line and therefore it is considered a
contaminating field star.
For 2 stars (OC21-M286, OC21-M136) the peak of the cross-correlation function performed with FXCOR is not symmetric but shows a double peak, which indicates that these objects are double-lined spectroscopic binaries (SB2). An inspection of the spectrum of these objects confirms the double spectral features, typical of SB2 stars.
To derive the cluster membership based on the RV we fitted the final RV
distribution with a double Gaussian using the "maximum likelihood fitting'',
as in Prisinzano et al. (2007). We find that the cluster Gaussian is centered on
 km s-1 with a standard deviation
 km s-1,
while the much broader
field star RV distribution shows a peak at
km s-1,
while the much broader
field star RV distribution shows a peak at
 km s-1, with a standard deviation of
 km s-1.
The fitted curve is indicated by the solid line in
Fig. 3.
We note that the average cluster RV is smaller than the mean RV of NGC 3960
(equal to about
-12 km s-1) computed from 5 members studied in Friel & Janes (1993),
but in very good agreement with the value derived by Sestito et al. (2006) from
UVES spectra (
km s-1.
The fitted curve is indicated by the solid line in
Fig. 3.
We note that the average cluster RV is smaller than the mean RV of NGC 3960
(equal to about
-12 km s-1) computed from 5 members studied in Friel & Janes (1993),
but in very good agreement with the value derived by Sestito et al. (2006) from
UVES spectra (
 km s-1).
The total number of
possible cluster members within
 of the cluster RV distribution
is 39 including 16 contaminating field stars,
as computed from the Gaussian distribution of the field stars.
We note that some of the classified non-members could be spectroscopic
binaries of the cluster, which cannot be easily distinguished from true
non-members. From an inspection of the single spectra, only
two objects, indicated by X symbols in
Fig. 1, have been recognized from the characteristic
double-line spectrum typical of SB2 stars
(see Sect. 3.1).
of the cluster RV distribution
is 39 including 16 contaminating field stars,
as computed from the Gaussian distribution of the field stars.
We note that some of the classified non-members could be spectroscopic
binaries of the cluster, which cannot be easily distinguished from true
non-members. From an inspection of the single spectra, only
two objects, indicated by X symbols in
Fig. 1, have been recognized from the characteristic
double-line spectrum typical of SB2 stars
(see Sect. 3.1).
Note that the identification of the cluster members does not allow us
to reduce the spread in the CMD since the differential reddening
corrections are computed using the reddening map shown in Fig. 8 of
Prisinzano et al. (2004), which gives the relative reddening values in subregions of
1
.7  1
.7, with respect to the subregion where the cluster
centroid is located. They are therefore spatially-dependent corrections and are
not calculated for each star individually.
This statistical method also includes
the contaminating field stars.
Individual spectral type estimates from
low resolution spectra are needed to derive the individual reddening and
thus the accurate position of the members in the CMD.
1
.7, with respect to the subregion where the cluster
centroid is located. They are therefore spatially-dependent corrections and are
not calculated for each star individually.
This statistical method also includes
the contaminating field stars.
Individual spectral type estimates from
low resolution spectra are needed to derive the individual reddening and
thus the accurate position of the members in the CMD.
![\begin{figure}
\par\includegraphics[angle=-90,width=8.5cm]{8341fig3.ps} \end{figure}](/articles/aa/full/2007/44/aa8341-07/img28.gif) |
Figure 3: Density distribution of the RV of the whole sample, which includes 113 stars. The fitted double Gaussian (see text) is indicated by the solid line. |
| Open with DEXTER | |
 that includes the Li I 6707.8
line;
we used the IRAF task CONTINUUM with a second order Legendre function and a
variable residual rejection limit chosen based on the visual inspection of the
fitting result. The EWs of the Li I 6707.8
line were measured using the IRAF
task SPLOT, assuming a Gaussian profile, which is a good approximation
since the EWs are all smaller than about 100 m
and therefore the line
is not saturated.
that includes the Li I 6707.8
line;
we used the IRAF task CONTINUUM with a second order Legendre function and a
variable residual rejection limit chosen based on the visual inspection of the
fitting result. The EWs of the Li I 6707.8
line were measured using the IRAF
task SPLOT, assuming a Gaussian profile, which is a good approximation
since the EWs are all smaller than about 100 m
and therefore the line
is not saturated.
The continuum normalization and the EW measurements were repeated three times,
on different dates;
the continuum has been estimated by choosing each time a different
residual rejection limit, that causes a change of the continuum level;
different measures have been done after
few months and therefore they are quite different.
The mean of the three measurements was taken as the final
estimation of the EW, and the maximum uncertainty was used as the error.
We detected the Li line in 55 objects, 29 with RVs that were consistent with
membership and 26 with RVs corresponding to non-members.
Among the remaining 58 stars,
we have 56 single objects and two SB2 binaries. For the 56 single stars,
we estimated an upper limit of the EW by measuring the EW of the smallest line around 6707.8 .
In some cases
the spectra are of candidate M dwarf stars and show large molecular bands
around
the Li line. For these stars, we considered the whole depression of the
spectrum, which includes the Li line, therefore the upper limits are very
conservative.
We corrected measured EWs for the contribution of the Fe
I line at 6707.44
using
the relation
 mÅ, given in Soderblom et al. (1993a)
for stars with solar metallicity, thus appropriate for our cluster
(Sestito et al. 2006).
mÅ, given in Soderblom et al. (1993a)
for stars with solar metallicity, thus appropriate for our cluster
(Sestito et al. 2006).
Figure 4a shows the Li EWs measured for all of the 55 objects where Li was detected as a function of the dereddened (B-V) colors, corrected for differential reddening, as described in Prisinzano et al. (2004). Figure 4b shows the Li EWs for the stars that are cluster members based on their RV, while Fig. 4c shows the Li EWs for the non-members. Upper limits are also plotted in the three panels, as well as Li EWs measured for the stars in the Hyades (Soderblom et al. 1990,1995; Thorburn et al. 1993) .
Whereas our measurements are characterized by a larger spread,
Fig. 4b indicates that the Li EWs of RV members
are on average smaller than those of the Hyades members of similar color.
This is also true for most of the RV non-members (Fig. 4c)
with (B-V)0smaller than about 0.6 (F and G-type stars), while for redder colors, Li
EWs are more comparable with those of Hyades stars.
![\begin{figure}
\par\includegraphics[width=8.3cm]{8341fig4.ps} \end{figure}](/articles/aa/full/2007/44/aa8341-07/img31.gif) |
Figure 4: a) Li EWs and upper limits to EWs for all our candidate members as a function of the dereddened (B-V) colors, corrected for differential reddening, as described in Prisinzano et al. (2004). Panels b) and c) show the Li EWs for the subsamples of the candidate members that are cluster members (panel b)) or contaminating field stars (panel c)), based on their RV. Our measurements are compared with the EWs measured for the stars in the Hyades (Sestito & Randich 2005). |
| Open with DEXTER | |
 K, given by Soderblom et al. (1993b).
Since photometric errors are smaller than 0.01 mag ,
errors in the effective temperatures are mainly due to the interstellar
reddening correction. Indeed,
as discussed in Prisinzano et al. (2004), Bragaglia et al. (2006), Bonatto & Bica (2006), NGC 3960
is affected by a relatively strong
differential reddening. Figure 5 shows the
reddening distribution computed as described in Prisinzano et al. (2004), for all stars
within 7 arcmin from the cluster center (Fig. 5a) and for the stars
observed with Giraffe (Fig. 5b). The dashed lines indicate the
25th (0.26) and the 75th (0.34) percentiles of the two distributions
around the median value equal to 0.30;
we assume
the semi-difference of these two percentiles, equal to 0.04,
as the typical error of E(B-V).
This range
is in agreement with
K, given by Soderblom et al. (1993b).
Since photometric errors are smaller than 0.01 mag ,
errors in the effective temperatures are mainly due to the interstellar
reddening correction. Indeed,
as discussed in Prisinzano et al. (2004), Bragaglia et al. (2006), Bonatto & Bica (2006), NGC 3960
is affected by a relatively strong
differential reddening. Figure 5 shows the
reddening distribution computed as described in Prisinzano et al. (2004), for all stars
within 7 arcmin from the cluster center (Fig. 5a) and for the stars
observed with Giraffe (Fig. 5b). The dashed lines indicate the
25th (0.26) and the 75th (0.34) percentiles of the two distributions
around the median value equal to 0.30;
we assume
the semi-difference of these two percentiles, equal to 0.04,
as the typical error of E(B-V).
This range
is in agreement with
 found in
Bragaglia et al. (2006) and with the range [0.03, 0.34] given by Bonatto & Bica (2006).
found in
Bragaglia et al. (2006) and with the range [0.03, 0.34] given by Bonatto & Bica (2006).
Assuming that
 ,
i.e., the error in the (B-V) colors corrected for differential
reddening is of the order of the reddening error, we computed errors
in the effective temperatures as the propagated uncertainties.
,
i.e., the error in the (B-V) colors corrected for differential
reddening is of the order of the reddening error, we computed errors
in the effective temperatures as the propagated uncertainties.
![\begin{figure}
\par\includegraphics[width=8cm]{8341fig5.ps} \end{figure}](/articles/aa/full/2007/44/aa8341-07/img35.gif) |
Figure 5: Reddening distribution computed as described in Prisinzano et al. (2004), for all stars within 7 arcmin from the cluster center (panel a)) and for the stars observed with Giraffe (panel b)). The dashed lines indicate the 25th (0.26) and the 75th (0.34) percentiles of the two distributions (see text). |
| Open with DEXTER | |
Errors in Li abundances were estimated by independently computing errors in Li abundance due to the effective temperature errors and EW errors. Finally, we quadratically added these errors to estimate our uncertainties in Li abundances.
The computed Li abundances as a function of the temperatures
for all the photometric
candidates are shown in
Fig. 6a;
the RV members and the non-members are
shown separately in Figs. 6b and c, respectively.
Upper limits are also
plotted.
Final data are given in Table 4 where we list the following:
identification number of Prisinzano et al. (2004), Giraffe
identification name and spectrum number, celestial
coordinates, V and B magnitudes,
V and B magnitudes corrected for differential reddening,
membership flag
based on the RV (0 means "non-member'', 1 means "member'' and 2 means "binary''),
effective temperatures computed from the (B-V)0 colors, corrected for
differential reddening, EW of the Li line, and finally
LTE and NLTE Li abundances.
Note that in some cases, the NLTE Li abundances were not computed because the
LTE Li abundances were outside the range of allowed values for the Carlsson et al. (1994)
correction. Note also that for the 2 binaries, the EW of the Li line were not
measured due to the complexity of the spectrum of these objects.
![\begin{figure}
\par\includegraphics[width=8cm]{8341fig6.ps} \end{figure}](/articles/aa/full/2007/44/aa8341-07/img36.gif) |
Figure 6: Li abundances derived from the effective temperatures computed using the (B-V)0 colors corrected for differential reddening, as described in Prisinzano et al. (2004). As in Fig. 4, the values are reported for the whole sample of photometric candidate members (panel a)) and for the subsamples of RV members and non-members (panels b) and c), respectively). Upper limits for the stars without Li are also indicated. |
| Open with DEXTER | |
For comparison, Fig. 7 shows the same plots of
Fig. 6, but with the Li abundances derived from
the effective temperatures computed using
the (B-V)0 colors not corrected for differential reddening.
![\begin{figure}
\par\includegraphics[width=8cm]{8341fig7.ps} \end{figure}](/articles/aa/full/2007/44/aa8341-07/img37.gif) |
Figure 7: Li abundances derived from the effective temperatures computed using the (B-V)0 colors not corrected for differential reddening. The reported subsamples are the same described in Fig. 6. |
| Open with DEXTER | |
We note that Li abundances in Fig. 7b are slightly more spread out than those in Fig. 6b. This suggests that temperatures obtained from colors corrected for differential reddening are, on average, more accurate than those from uncorrected colors; hence, we adopt them for the following analysis. However, the adopted reddening corrections are derived statistically from photometry assuming the distance of the stars of NGC 3960, therefore, the reddening correction may not be appropriate for the field stars, especially if they are foreground field stars. Nevertheless, we find that the spread in Fig. 6c is smaller than that shown in Fig. 7c and similar to that found in Pasquini et al. (1994) for field stars of similar temperatures.
Based on Li only, we cannot definitively rule out
the possibility that the 10 stars with RVs consistent
with membership and without Li are cluster
members.
On the one hand, for some of them we have inferred
upper limit values comparable or even higher than
measured Li EWs of stars with detected Li. On the other hand,
considering these 10 objects as cluster members would imply a large
spread in the Li abundances for warmer stars, which, again, we cannot
completely exclude. We note however that if these 10 stars, or most
of them, were indeed cluster members, most
of the contaminating field stars would have high Li, which is rather
unlikely. On the contrary,
we make the more reasonable hypothesis that the 29 RV members with detected
Li are cluster members, while the 10 remaining objects
labeled as RV members, but without a detected Li line,
are among the 16 contaminating stars.
This assumption would imply
that we have 60% of non-members (10/16) without
a measurable Li, which is in agreement with the expected
fraction of field stars without Li (see next section).
The remaining 6 contaminating field stars show the Li line but cannot be identified in the sample of the 29 members shown in Fig. 6b.
In Fig. 8 we compare the Li abundances for the 29 NGC 3960 candidate members with the Li abundances of the Hyades. The two distributions are almost identical for stars warmer than about 6000 K, while the Li abundances of NGC 3960 stars cooler than 6000 K are systematically smaller than those of Hyades members of similar temperature. This result on the one hand supports our initial assumption that NGC 3960 is older than the Hyades; on the other hand, it allows us to add a critical datapoint (see Sect. 1) on the empirical study of the evolution of Li abundance with age.
Figure 9, adapted from Sestito & Randich (2005), shows the average Li abundances as a function of age, in three different effective temperature ranges, as computed by Sestito & Randich (2005) for open clusters of different ages; the average values in the same temperature ranges derived here for NGC 3960 using the 29 RV members with Li are indicated in the figure and are given in Table 2. For comparison, the position of the Sun is also indicated.
Table 2: Average of log n(Li) for NGC 3960 in three different ranges of effective temperatures.
For stars cooler than 5700 K (Fig. 9c), the average Li abundance in NGC 3960 is computed from only two stars and the associated error is the semi-difference of the two Li abundances.
As discussed in Sestito & Randich (2005), the upper panel shows that after a small amount of Li depletion occurring during the pre-main sequence (PMS) phase, no Li destruction is present up to about 250 Myr, while it restarts. The average abundances for NGC 3960 confirm the trend of slow (but present) depletion at ages older than the Hyades.
Figure 9b and c
indicate that for cooler stars, after the phase
of PMS Li destruction,
Li depletion restarts significantly after about 200 Myr. Importantly,
our analysis allows us to put tighter constraints on the age
at which Li depletion is no longer present. Specifically,
the average Li
abundances derived for NGC 3960 shows that the Li plateau
might start
at 1 Gyr rather than 2 Gyr: the average abundance of NGC 3960
is indeed closer to that of the 2 Gyr clusters, rather than to the Hyades,
although, due to the large  , it is not completely
inconsistent with the latter. Also,
average Li abundances in NGC 3960 could be lowered by the inclusion of a few
non-members with RVs consistent with that of NGC 3960 but, which might
have lower Li abundances.
For example, the average Li abundance of stars in Fig. 9b
has been computed, including in the sample
the star with
, it is not completely
inconsistent with the latter. Also,
average Li abundances in NGC 3960 could be lowered by the inclusion of a few
non-members with RVs consistent with that of NGC 3960 but, which might
have lower Li abundances.
For example, the average Li abundance of stars in Fig. 9b
has been computed, including in the sample
the star with
 and
and
 K; its Li abundance significantly deviates
from the mean Li pattern, suggesting that this object might come from the
sample of contaminating field stars. By excluding this object from
the sample we would get a smaller
(0.31) and a slightly higher average
(2.32), which is however consistent with that of older clusters.
K; its Li abundance significantly deviates
from the mean Li pattern, suggesting that this object might come from the
sample of contaminating field stars. By excluding this object from
the sample we would get a smaller
(0.31) and a slightly higher average
(2.32), which is however consistent with that of older clusters.
We stress that our analysis has been carried out consistently with that of Sestito & Randich (2005) and thus the comparison of the average abundances should not be affected by systematic errors.
As discussed by Sestito & Randich (2005), none of the models/mechanisms proposed to explain the occurrence of MS Li depletion is also able to reproduce the plateau, since all of them predict that Li depletion should continue at old ages. To our knowledge, no new models predicting the existence of the plateau have been presented. Our study, not only reinforces the empirical evidence for the plateau and thus the need for such models, but also provides an additional constraint to be taken into account.
Nevertheless, several
stars with high abundance (
 )
are present.
More specifically,
we find that the field
stars hotter
than about 6400 K (early F-type) show a Li abundance of about 2.7,
consistent with that found for stars of similar temperatures for NGC 3960;
stars cooler than 6400 K and hotter than 5700 K (late F-type and early G-type)
show a large spread in the Li abundance with values similar or smaller than
those found for the same temperature range for NGC 3960; finally, stars
with temperatures smaller than about 5500 K have Li abundances somewhat
larger than
those found for NGC 3960. Note, however, that effective temperatures (and thus
Li abundances) for these stars might have been overestimated,
since we have
assumed the same reddening as for NGC 3960 members.
)
are present.
More specifically,
we find that the field
stars hotter
than about 6400 K (early F-type) show a Li abundance of about 2.7,
consistent with that found for stars of similar temperatures for NGC 3960;
stars cooler than 6400 K and hotter than 5700 K (late F-type and early G-type)
show a large spread in the Li abundance with values similar or smaller than
those found for the same temperature range for NGC 3960; finally, stars
with temperatures smaller than about 5500 K have Li abundances somewhat
larger than
those found for NGC 3960. Note, however, that effective temperatures (and thus
Li abundances) for these stars might have been overestimated,
since we have
assumed the same reddening as for NGC 3960 members.
We exclude that the stars in Fig. 6c are binary cluster members (SB1) with discrepant RVs due to the orbital component, since for these objects, the distribution of the difference between the maximum and the minimum values of the RV measured from our spectra (acquired within about one and a half months, see Table 1) is very similar to that obtained for the sample of RV members. Therefore, we conclude that they are, most likely, a sample of field stars with Li.
If we consider that we have 74 non-members for RV (i.e. 113-39), including the
binary,
plus 16 contaminating field stars
stars with RVs consistent with that of NGC 3960, we have a total of
90 field
stars; those with the Li line are 26 within the sample of RV non
members, plus the remaining 6 contaminating field stars in the
sample of RV members.
Therefore, the fraction of field stars with the Li line is (26+6)/90, i.e.,
about one third of the sample. This fraction is slightly lower than that
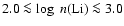
found by Pasquini et al. (1994), who found that about one half of the G dwarfs analyzed in
their work had high
Li content (
 )
and apparently old age. Also note that all solar-type stars in
the very old cluster NGC 188 (6 Gyr) with available Li measurements
have abundances above 2.0 (Randich et al. 2003), i.e., a
relatively high Li is not inconsistent
with a very old age.
)
and apparently old age. Also note that all solar-type stars in
the very old cluster NGC 188 (6 Gyr) with available Li measurements
have abundances above 2.0 (Randich et al. 2003), i.e., a
relatively high Li is not inconsistent
with a very old age.
In summary, the presence of several Li-rich F and
G-type field stars in our sample is not surprising.
The large spread in their Li abundance is both
consistent with a mixed population of stars older or similar to NGC 3960,
and also possibly/in part due to the fact that, in addition to stellar age,
another unknown parameter can regulate MS Li depletion
(e.g. Pasquini et al. 1997; Pinsonneault 1997; Pasquini et al. 1994; Charbonnel & Talon 2005; Randich et al. 2006, and references therein).
![\begin{figure}
\par\includegraphics[width=8cm]{8341fig8.ps} \end{figure}](/articles/aa/full/2007/44/aa8341-07/img46.gif) |
Figure 8: Li abundances of the 29 NGC 3960 members (filled circles) as in Fig. 6 (panel b)), compared with the Hyades values (empty circles). |
| Open with DEXTER | |
![\begin{figure}
\par\includegraphics[width=7.8cm]{8341fig9.ps} \end{figure}](/articles/aa/full/2007/44/aa8341-07/img47.gif) |
Figure 9: Plots adapted from Fig. 7 of Sestito & Randich (2005) showing the average log n(Li) as a function of cluster age, in three different temperature ranges. Open circles are the data from Sestito & Randich (2005), while filled circles are the values computed for NGC 3960. |
| Open with DEXTER | |
Table 3:
Number of stars
with RV consistent or not (within  )
with the cluster membership
(indicated by Y or N) and with or without
Li (indicated by Y or N).
The total number for each criterion is also given.
The two binaries are specifically indicated in the given samples.
)
with the cluster membership
(indicated by Y or N) and with or without
Li (indicated by Y or N).
The total number for each criterion is also given.
The two binaries are specifically indicated in the given samples.
We considered these 84 objects to estimate the fraction of contaminating field stars in our sample as a function of the V magnitude. The results are shown by the solid line histogram plotted in Fig. 10; the number of contaminating stars and the total number of objects within the four magnitude ranges are also indicated; error bars were computed from the binomial distribution. The resulting fractions are compared with the analogous values derived in Prisinzano et al. (2004), where the contamination was statistically derived using a field region outside the cluster region; in this case, errors were computed from the propagation of the poisson errors on the number of field stars and of the total stars. The comparison shows that, within the errors, the fractions of contaminating stars derived with the two methods are compatible.
We note, however, that, among the 84 contaminating stars, the sample of 74 non-members for the RV could include a small fraction of binaries of NGC 3960, therefore these numbers could be slightly overestimated. On the other hand, we did not include in the field star sample the 6 contaminating stars with RVs consistent with that of the cluster and with the Li line. Nevertheless, since these effects should be within the error bars, we conclude that the fraction of contaminating field stars within the spectroscopic sample studied in this work is comparable with that estimated in Prisinzano et al. (2004) with photometric data. We note that the comparison is consistent since the stars observed in this spectroscopic work have been randomly selected from the list of photometric candidate members given in Prisinzano et al. (2004). This result allows us to confirm the mass function derived in Prisinzano et al. (2004), which strongly depends on the correction for the field star contamination.
We used VLT/FLAMES Giraffe spectra to determine the RVs and
thus the membership of a
sample of 113 photometrically selected
candidate cluster members. We find that the average cluster RV is
km s-1 with a standard deviation
km s-1. As expected from the high fraction of
contaminating stars, only 39 objects have RVs consistent with that of the
cluster. Among these, 16 are expected to be contaminating field stars and 10
of these have been identified since they do not show the Li line.
We find that the spread in the CMD for the sample of cluster members is not
reduced since the adopted reddening correction is statistically
reliable. Individual spectral types of such objects are necessary to
accurately derive their temperatures and positions in the CMD.
From the analysis of the Li line we derived Li abundances for cluster and field stars. We find that by using photometry corrected for differential reddening, Li abundance distribution of the cluster members shows a spread smaller than that found using uncorrected photometry.
![\begin{figure}
\par\includegraphics[width=8cm]{8341fi10.ps} \end{figure}](/articles/aa/full/2007/44/aa8341-07/img48.gif) |
Figure 10: Fraction of contaminating field stars estimated in this work from individual membership derived by the RV and the Li line (solid line histogram) and in Prisinzano et al. (2004) from a statistical analysis of a field region around NGC 3960 (dashed line histogram). |
| Open with DEXTER | |
The average Li abundances computed for stars in three different temperature ranges confirms the trend, already found in Sestito & Randich (2005), of slow (but present) depletion at ages older than the Hyades for stars with temperatures larger than about 6000 K. For cooler stars, the inclusion of the average Li abundance of NGC 3960 in the distribution of Li abundance as a function of the age, allows us to conclude that the age at which Li depletion is no longer present is very likely closer to 1 Gyr rather than 2 Gyr, as inferred by Sestito & Randich (2005), on the base of the incomplete sample of open clusters with ages older than 2 Gyr and younger than the Hyades.
The fraction of field stars with an evident Li line is about one third, while the fraction of field stars, as a function of the magnitude, is consistent with that derived statistically from photometry. This allows us to confirm the conclusions about the mass function derived in Prisinzano et al. (2004), which strongly depends on the estimate of the field star contamination.
Acknowledgements
We wish to thank the referee R. D. Jeffries for his useful suggestions which have improved the final version of this paper. We also thank the ESO Paranal staff for performing the service mode observations. This work has made extensive use of the services of WEBDA, ADS, CDS etc. The research presented here has been supported by an INAF grant on Stellar clusters as probes of star formation and early stellar evolution (PI: F. Palla). L.P. thanks Paolo Spanò for his contribution to the RV analysis and Giusi Micela for useful discussions on this work.
Table 4: Stellar parameters for the NGC 3960 stars observed with GIRAFFE. Column 1 gives the identification number of Prisinzano et al. (2004), Cols. 2 and 3 give the Giraffe identification name and the spectrum number, Cols. 4 and 5 give the celestial coordinates, Cols. 6 and 7 give the V and B magnitudes while Cols. 8 and 9 give the V and B magnitudes corrected for differential reddening, Col. 11 gives the membership flag based on the RV (0 means "non member'', 1 means "member'' and 2 means "binary''); Col. 12 gives the effective temperatures computed from the (B-V)0 colors, corrected for differential reddening; Col. 13 gives the EW of the Li line, and finally Cols. 14 and 15 give the LTE and NLTE Li abundances, respectively.