A&A 475, 409-414 (2007)
DOI: 10.1051/0004-6361:20077183
[Ne III]/[O II] as an oxygen abundance indicator in the H II regions and H II galaxies
F. Shi - G. Zhao - Y. C. Liang
National Astronomical Observatories, Chinese Academy of Sciences, 20A Datun Road, Chaoyang District, Beijing 100012, PR China
Received 29 January 2007 / Accepted 20 August 2007
Abstract
Aims. To calibrate the relationship between Ne3O2 (Ne3O2 = log ([Ne III]
 /[O II]
 )) and oxygen abundances, we present a sample of
  3000 H II galaxies from the Sloan Digital Sky Survey (SDSS) data release four. They are associated with a sample from the literature intended to enlarge the oxygen abundance region.
Methods. We calculated the electron temperatures ( )
of 210 galaxies in the SDSS sample with the direct method, and
of the other 2960 galaxies in SDSS sample calculated with an empirical method. Then, we use a linear least-square fitting to calibrate the Ne3O2 oxygen abundance indicator.
)
of 210 galaxies in the SDSS sample with the direct method, and
of the other 2960 galaxies in SDSS sample calculated with an empirical method. Then, we use a linear least-square fitting to calibrate the Ne3O2 oxygen abundance indicator.
Results. It is found that the Ne3O2 estimator follows a linear relation with
 that holds for the whole abundance range covered by the sample, from approximately 7.0 to 9.0. The best linear relationship between the Ne3O2 and the oxygen abundance is calibrated. The dispersion between oxygen abundance and Ne3O2 index in the metal rich galaxies may come partly from the moderate depletion of oxygen onto grains. The Ne3O2 method has the virtue of being single-valued and not affected by internal reddening. As a result, the Ne3O2 method can be a good metallicity indicator in the H II regions and H II galaxies, especially in high-redshift galaxies.
Key words: Galaxy: abundances - galaxies: ISM - H II regions
Those hydrogen II galaxies with strong emission lines are important probes for
the formation and evolution of galaxies. Their spectra contain the much
important information needed to determine the star formation
rate, initial mass function, element abundance, etc. (Stasinska &
Leitherer 1996; Kennicutt 1998; Contini et al. 2002).
The heavy element abundance is a key parameter for the
formation and evolution of a galaxy. Oxygen is the
important element that is easily and reliably determined since
all the most important ionization stages can be observed.
The oxygen abundance from the measurement of electron temperature
from [O III]
 4959,5007/[O III]
 4363 is
one of the most reliable methods.
But [O III]
4363 is
one of the most reliable methods.
But [O III]
 is usually weak in the low metallicity galaxies,
and there are often large errors when measuring this line. In high
metallicity galaxies, [O III]
are hardly even observable.
is usually weak in the low metallicity galaxies,
and there are often large errors when measuring this line. In high
metallicity galaxies, [O III]
are hardly even observable.
Instead of the
method, strong line methods, such as the R23![[*]](/icons/foot_motif.gif) , P,
N2, or
O3N2 methods, are used widely (Pagel et al. 1979; Kobulnicky et al. 1999; Pilyugin et al. 2001; Charlot
& Longhetti 2001; Denicoló et al. 2002; Pettini & Pagel 2004;
Tremonti et al. 2004; Liang et al. 2006). The R23 and P methods suffer the double-valued problem, requiring some assumption or rough a priori
knowledge of a galaxy's metallicity in order to locate it on the
appropriate branch of the relation. The N2- and O3N2 methods
are monotonic, but the reasons for this are not purely physical. It is
partly due to the N/O ratio increases on average with the increase in
metallicity (Stasinska 2006; Shi et al. 2006). Besides, calibrations
of the O3N2 and N2 indices might be improper for interpreting the integrated
spectra of galaxies because [N II]
, P,
N2, or
O3N2 methods, are used widely (Pagel et al. 1979; Kobulnicky et al. 1999; Pilyugin et al. 2001; Charlot
& Longhetti 2001; Denicoló et al. 2002; Pettini & Pagel 2004;
Tremonti et al. 2004; Liang et al. 2006). The R23 and P methods suffer the double-valued problem, requiring some assumption or rough a priori
knowledge of a galaxy's metallicity in order to locate it on the
appropriate branch of the relation. The N2- and O3N2 methods
are monotonic, but the reasons for this are not purely physical. It is
partly due to the N/O ratio increases on average with the increase in
metallicity (Stasinska 2006; Shi et al. 2006). Besides, calibrations
of the O3N2 and N2 indices might be improper for interpreting the integrated
spectra of galaxies because [N II]
 and H
and H may arise not only in bona fide H II regions, but also in the diffuse ionized medium.
Stasinska (2006) has recently proposed Ar3O3 and S3O3 as new abundance
indicators, which have the advantage of being unaffected by the
chemical evolution effects. The advantages are superior to previous N2 and O3N2 methods.
may arise not only in bona fide H II regions, but also in the diffuse ionized medium.
Stasinska (2006) has recently proposed Ar3O3 and S3O3 as new abundance
indicators, which have the advantage of being unaffected by the
chemical evolution effects. The advantages are superior to previous N2 and O3N2 methods.
In short, one ideal metallicity indicator has to be monotonic and be independent
of the internal reddenning and chemical evolution.
Nagao et al. (2006) find that the Ne3O2 index, i.e.
log ([Ne III]
/[O II]
), fulfills these requirements. They
derive a relation of Ne3O2 vs.
by using the Bayesian abundances provided
by the MPA/JHU group for
the metal rich galaxies in the SDSS (Tremonti et al. 2004) and the abundances based on an electron temperature-sensitive line, [O III]
,
for metal poor galaxies. The
Bayesian metallicity could be problematic in some aspects,
such as improper subtraction of the underlying starlight or unsuitable treatment of nitrogen enrichment in the HII galaxy model. As a result, there is a significant systematic difference between Bayesian metallicity and metallicity (Yin et al. 2007),
so it is necessary to recalibrate the Ne3O2 index based on
abundance derived from method, which is believed to be the most
reliable method to determine oxygen abundance. Also, the dispersion
between [Ne III]
/[O II]
and oxygen abundance needs to be explained.
In this paper, we recalibrate the Ne3O2 metallicity index based on a large
sample of H II regions and H II galaxies where oxygen abundance is determined
by the method. For low metallicity galaxies (Sample I, see Sect. 2),
we used a five-level statistical equilibrium
model in the IRAF NEBULAR package (de Robertis et al. 1987;
Shaw & Dufour 1995), which makes use of the latest collision
strengths and radiative transition probabilities to determine the
and  .
For high metallicity galaxies (Sample II, see Sect. 2), an
empirical relation of
and strong spectral lines from Pilyugin (2001) was adopted for the electron temperature determination (their Eq. (11)).
We also study the physical origin of
the dispersion between [Ne III]
/[O II]
and oxygen abundance.
.
For high metallicity galaxies (Sample II, see Sect. 2), an
empirical relation of
and strong spectral lines from Pilyugin (2001) was adopted for the electron temperature determination (their Eq. (11)).
We also study the physical origin of
the dispersion between [Ne III]
/[O II]
and oxygen abundance.
The Sloan Digital Sky Survey (SDSS) is the most ambitious imaging and spectroscopic
survey to date, and it will eventually cover a quarter of the sky (York et al. 2000).
The large area coverage and moderately deep survey limit of the
SDSS makes it suitable for studying the evolution of galaxies. Because of its
homogeneity, the SDSS provides a large sample of H II galaxies where oxygen
abundance can be calculated with the classic method. The sample can be used
to calibrate some metallicity indicators.
This paper is organized as follows. Based on an SDSS DR4 starbursts spectral sample
and a sample of H II regions or H II galaxies from the literature,
we present a sample to use for our metallicity index
calibration (Sect. 2). In Sect. 3, we calibrate the Ne3O2 metallicity index. In Sect. 4, we study the origin of dispersion between
oxygen abundance and Ne3O2 index and check the accuracy of our calibration.
In Sect. 5, we summarize the calibration result
and discuss the merits of then Ne3O2 indicator with respect to the
other strong line indicators and then conclude this paper.
2 Data sample
The preferred method for determining oxygen abundances in
galaxies is obtained from the ratio of auroral to nebular line intensities,
such as [O III]
4959,5007/[O III]4363 (the
so-called method). In this
paper, the adopted metallicities of H II regions and H II galaxies for
calibration are determined from the method.
We used H II galaxies from the Fourth Data Release (DR4) of
the SDSS. After subtracting the underlying
starlight using the method of Li et al. (2005) and Lu et al. (2006),
we fit the emission line using the method of Dong et al. (2005).
We made the internal reddening correction for the flux of all the emission
line, using the two strongest Balmer lines, H/H and
the effective absorption curve
and
the effective absorption curve
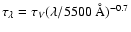 ,
which was
introduced by Charlot & Fall (2000). Then, we made use of the spectral
diagnostic diagrams from Kauffmann et al. (2003) to classify galaxies
as starburst galaxies, active galactic nuclei (AGN),
or unclassified. To reduce systematic and random errors from aperture
effects, our galaxy samples are limited by the requirement that
redshift z>0.04 (Kewley et al. 2005).
,
which was
introduced by Charlot & Fall (2000). Then, we made use of the spectral
diagnostic diagrams from Kauffmann et al. (2003) to classify galaxies
as starburst galaxies, active galactic nuclei (AGN),
or unclassified. To reduce systematic and random errors from aperture
effects, our galaxy samples are limited by the requirement that
redshift z>0.04 (Kewley et al. 2005).
Within the primary starburst sample, two subsamples were selected
from the SDSS-DR4 with the fluxes of spectral
lines for all [Ne III]
,
[O II]
,
H,
[O III]
 ,
[O III]
,
[O III]
 ,
H and [N II]
higher than 5 times the flux uncertainty. The difference of these
two subsamples is that the first subsample (Sample I) was selected by the additional
criterion from the [O III]
line, and the flux uncertainties
for [O III]
was higher than
,
H and [N II]
higher than 5 times the flux uncertainty. The difference of these
two subsamples is that the first subsample (Sample I) was selected by the additional
criterion from the [O III]
line, and the flux uncertainties
for [O III]
was higher than  .
In all, 210 galaxies were
included in this subsample. The [O III]4363 is strongly
dependent on the metallicity of galaxies and it becomes undetectable
in high metallicity galaxies. Therefore, galaxies in Sample I are
those with low metallicity. The electron temperature in the
high-temperature zone (
.
In all, 210 galaxies were
included in this subsample. The [O III]4363 is strongly
dependent on the metallicity of galaxies and it becomes undetectable
in high metallicity galaxies. Therefore, galaxies in Sample I are
those with low metallicity. The electron temperature in the
high-temperature zone (
 )
of Sample I galaxies was calculated from [O III]
4959,5007/[O III]4363,
using a five-level statistical equilibrium
model in the IRAF NEBULAR package (de Robertis et al. 1987;
Shaw & Dufour 1995). In the second subsample (Sample II),
galaxies have weak or no [O III]4363 line, and 2960 galaxies were
selected in this subsample containing generally metal rich galaxies.
The
of the galaxies in Sample II was calculated with the empirical method
following Pilyugin (2001) from the R23 and P parameter (their Eq. (11)).
)
of Sample I galaxies was calculated from [O III]
4959,5007/[O III]4363,
using a five-level statistical equilibrium
model in the IRAF NEBULAR package (de Robertis et al. 1987;
Shaw & Dufour 1995). In the second subsample (Sample II),
galaxies have weak or no [O III]4363 line, and 2960 galaxies were
selected in this subsample containing generally metal rich galaxies.
The
of the galaxies in Sample II was calculated with the empirical method
following Pilyugin (2001) from the R23 and P parameter (their Eq. (11)).
To estimate the temperature in the low-temperature zone
 ,
the
relation between
and
from Garnett (1992) are
utilized:
,
the
relation between
and
from Garnett (1992) are
utilized:
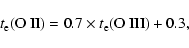 |
(1) |
where  =
=
 K. After calculation of ,
we used the expressions from Izotov et al. (2006, their Eqs. (3) and (5)) to calculate the oxygen abundances.
The average uncertainty from flux measurement in the computed
values is typically
0.10 dex in both samples.
K. After calculation of ,
we used the expressions from Izotov et al. (2006, their Eqs. (3) and (5)) to calculate the oxygen abundances.
The average uncertainty from flux measurement in the computed
values is typically
0.10 dex in both samples.
To widen the oxygen abundance range, we built a large
database of published reddening-corrected line fluxes for
H II regions or H II galaxies, besides the H II galaxies from SDSS DR4.
The data for H II regions in spiral galaxies in the literature with good [Ne III]
,
[O II]
and reliable metallicity are taken from
Garnett & Kennicutt (1994), Garnett et al. (1997),
Bresolin et al. (2004, 2005) and van Zee et al. (1998).
The data for H II galaxies in the literature with very good
signal-to-noise ratios are taken from
Guseva et al. (2003a-c), Izotov et al. (1994, 1997, 1998, 2004,b, 2006),
Lee et al. (2003a,b), Lee et al. (2004), Melbourne et al. (2004),
Papaderos et al. (2006), and Thuan et al. (1995). In total,
84 H II regions of spiral galaxies and 446 H II galaxies in
the literature are adopted in our sample.
The average uncertainty from flux measurement in the
values
is typically within 0.10 dex.
3 Ne3O2 as a metallicity calibrator
The upper panel of Fig. 1 shows the oxygen abundance as a function of
Ne3O2 for our samples. Apart from a few outliers in the SDSS DR4 sample, all
the objects merge into a relatively tight, linear, and steep sequence,
as expected. As expected from stellar nucleosynthesis (Izotov & Thuan 1999) and confirmed by observation of low metallicity HII galaxies in the SDSS DR3 (Izotov et al. 2006),
Ne and O are produced by the same stars, so the
relationship between oxygen abundance and the Ne3O2 index unlike O3N2 or N2 is not affected by the chemical evolution effects. The observed trend of Ne3O2 is due to the fact that the ionization parameter has a strong metallicity dependence (Nagao et al. 2006). The two emission lines,
[Ne III]
and [O II]
,
have different degrees of ionization.
Their ratio is strongly dependent on
the ionization parameter and correlates with metallicity.
To confirm this view, we plot the relationship in Fig. 2 between
Ne3O2 index and the P parameter for H II galaxies in SDSS DR4. The P parameter
is defined as ([O III]
 )/ ([O II]
+[O III]
)
by Pilyugin (2001), and it is a good representive of an ionization parameter. Figure 2 shows that the Ne3O2 index is positive related to the P parameter, which supports the idea
that the Ne3O2 index is negatively correlated with the metallicity, since more metal rich
H II regions are excited by a softer radiation field and have a lower ionization
parameter. We have checked the relationship further between electron temperature
and Ne3O2 index in Fig. 3 and find the observed trend of
Ne3O2 is partly due to the increase in
as metallicity
decreases, which leads to an increase in the Ne3O2 ratio. The comparison
between Figs. 2 and 3 shows that,
for the observed relation between
and the Ne3O2 index, the
contribution from the decrease in the ionization parameter P with
the increase in metallicity is stronger than the decrease in
with an increase in metallicity, since the Ne3O2 index is more
sensitive to the P parameter than .
)/ ([O II]
+[O III]
)
by Pilyugin (2001), and it is a good representive of an ionization parameter. Figure 2 shows that the Ne3O2 index is positive related to the P parameter, which supports the idea
that the Ne3O2 index is negatively correlated with the metallicity, since more metal rich
H II regions are excited by a softer radiation field and have a lower ionization
parameter. We have checked the relationship further between electron temperature
and Ne3O2 index in Fig. 3 and find the observed trend of
Ne3O2 is partly due to the increase in
as metallicity
decreases, which leads to an increase in the Ne3O2 ratio. The comparison
between Figs. 2 and 3 shows that,
for the observed relation between
and the Ne3O2 index, the
contribution from the decrease in the ionization parameter P with
the increase in metallicity is stronger than the decrease in
with an increase in metallicity, since the Ne3O2 index is more
sensitive to the P parameter than .
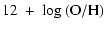
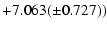
From the upper panel of Fig. 1, we can define a new metallicity
calibration. The observed distribution of all the points in this figure
is linear least-square-fitted by the following expression given as the
solid line in the lower panel of Fig. 1:
with a standard error of 0.302 dex. In this panel, we also give the mean of the data with
bin = 0.091 dex in
(the stars) and the result of fitting the mean. We plot the calibration of Nagao et al. (2006) to compare with our result. In Sect. 4.2, we discuss why we prefer the fit for all the points and do not use the fit of mean.
![\begin{figure}
\par\includegraphics[width=6.6cm,clip]{7183fig1up.eps}\vspace*{5mm}
\includegraphics[width=6.6cm,clip]{7183fig1low.eps}\end{figure}](/articles/aa/full/2007/44/aa7183-07/Timg32.gif) |
Figure 1:
Upper panel:
vs. log (Ne3O2) for our data sample.
Dots are galaxies from SDSS DR4. Crosses are from the literature.
Lower panel: the solid line represents Eq. (2). Stars denote the mean
for each bin of the oxygen abundance. The dot-dashed lines denote the best-fit function for each metallicity bin. The dashed curves are the calibration of Nagao et al. (2006). |
| Open with DEXTER |
![\begin{figure}
\par\includegraphics[width=6.6cm,clip]{7183fig2.eps}\end{figure}](/articles/aa/full/2007/44/aa7183-07/Timg33.gif) |
Figure 2:
The relationship between Ne3O2 index and the P parameter for H II galaxies in SDSS DR4. P = ([O III]
+[O III]
)/ ([O II]
+[O III]
+[O III]
). |
| Open with DEXTER |
![\begin{figure}
\par\includegraphics[width=6.6cm,clip]{7183fig3.eps}\end{figure}](/articles/aa/full/2007/44/aa7183-07/Timg34.gif) |
Figure 3:
The relationship between Ne3O2 index and the electron temperature for H II galaxies in SDSS DR4. The electron temperature is in units of 104 K. |
| Open with DEXTER |
4 Discussion
Although the
metallicities are closely related to Ne3O2 index, the dispersion of the relation is large, especially in the low metallicity region. Some of the scatter may come from
the moderate depletion of oxygen onto grains in the metal rich galaxies.
To show this view clearly, we calculated the log (Ne/O) abundance ratios for Samples I and II using the method of Izotov et al. (2006) (their Eqs. (7) and (19)). Then we plotted the
difference between
 -
-
 and
the
and
the
 abundance ratios in the upper panel of Fig. 4 for metal poor galaxies and the lower panel for metal rich galaxies. To compare Sample I and
metal-poor emission-line galaxies in Izotov et al. (2006), we show the
sample of Izotov et al. (2006) in the upper panel of Fig. 4.
abundance ratios in the upper panel of Fig. 4 for metal poor galaxies and the lower panel for metal rich galaxies. To compare Sample I and
metal-poor emission-line galaxies in Izotov et al. (2006), we show the
sample of Izotov et al. (2006) in the upper panel of Fig. 4.
As expected, Sample I is consistent with the sample of
Izotov et al. (2006). There is a positive correlation between
(
) - (
)
and the log (Ne/O)
for metal-poor galaxies because more oxygen depletion would be
present in the H II regions with higher metallicity (Izotov et al. 2006).
The lower panel of Fig. 4 shows more clearly that
there is a clear correlation between
-
and the log (Ne/O) for the metal rich galaxies because more
oxygen is locked in the dust grains in the more metal-rich
H II regions (Izotov et al. 2006). This correlation for Sample II can be given as a linear least-square fit:
  |
|
|
(3) |
with a standard error of 0.104 dex. The corrected calibration of Ne3O2 methods by
considering this correlation will provide more accurate oxygen abundance,
and the standard error of the corrected calibration in Fig. 1
will decrease to 0.198 dex, which is much less than the previous
ones (0.302 dex). This correlation can be used to correct the derived
oxygen abundances from Ne3O2 methods. However, to apply the Ne/O correction to
12 + log (O/H) abundances, we have to measure electron temperature ,
H,
[O III]
,
[O III]
,
besides [Ne III]
and
[O II]
,
so it will not always be practical.
![\begin{figure}
\par\includegraphics[width=6.7cm,clip]{7183fig4up.eps}\vspace*{5mm}
\includegraphics[width=6.7cm,clip]{7183fig4low.eps}\end{figure}](/articles/aa/full/2007/44/aa7183-07/Timg40.gif) |
Figure 4:
Upper panel: correlation between
-
and the
abundance ratios of Sample I (crosses)
and the sample of Izotov et al. (2006) (diamonds).
-
is the difference between
metallicity determined from the expressions in Izotov et al. (2006)
and Ne3O2 metallicity determined from Eq. (2).
Lower panel: correlation between
-
and the
abundance ratios of Sample II (dots). |
| Open with DEXTER |
We plot the calibration of Nagao et al. (2006) to compare with Eq. (2)
in the lower panel of Fig. 1. Some samples of both ours and Nagao's are selected randomly from the literature. As a result, the calibration might be affected by selection
effects. To mitigate this effect, Nagao's calibration fits the mean in
given metallicity bins. However, most of the SDSS data in our
sample are concentrated in the metallicity range of 8.0 <
< 8.5.
As a result, if we fit the mean, the calibration will lose a lot of information
in 8.0 <
< 8.5, because thousands of SDSS data are represented by several
different mean values. As a result, the calibration fitting the mean will
induce larger errors. In considering this, we used the calibration fitting
all data points in the lower panel of Fig. 1
to compare with Nagao's calibration.
The lower panel of Fig. 1 shows that the oxygen
abundance from Nagao's calibration is systematically higher than our
calibration at the given Ne3O2, except that at the low metallicity end, our
calibration is consistent with Nagao's because both ours and Nagao's
abundances at the low metallicity end are derived by the method.
The difference between Nagao's calibration and ours in the high metallicity
region could be caused by the oxygen abundances
of most galaxies in the Nagao's sample being calculated by the Bayesian methods,
while the oxygen abundances of our sample are all derived with the methods. The origin of the difference between the Bayesian
and metallicities have already been discussed by Yin et al. (2007).
They find that, for almost half of the sample galaxies (227 among 531 galaxies with measurements), Bayesian metallicities are overestimated by a factor of about 0.34 dex on average, which is consistent with our result. They propose that the overestimates of
Bayesian metallicities may be related to the onset of secondary N enrichment
in models. Another reason for the lower metallicities
than Bayesian metallicities is that the [O III]4363 emission line is
biased by the very hot H II regions in each galaxy; thus, the global
average temperature might be overestimated to 1000-3000 K, which results
in systematic underestimation of the oxygen abundance of
0.05-0.2 dex, as Nagao et al. (2006) propose.
In Fig. 5, we compare the
and Bayesian
metallicities in our SDSS sample. It shows that the Bayesian metallicities of
nearly half of the Sample II, where
are derived from the empirical
method in Pilyugin (2001), are 0.3 dex higher than metallicity. The
relationship between the
and Bayesian metallicities
behaves very much like the result in Yin et al. (2007) (their Fig. 2), which supports the empirical determination by Pilyugin (2001). This is
consistent with
derived by the classic temperature-sensitive line.
Similar evidence can be found in Shi et al. (2006) (their Fig. 2) where
metallicities from the empirical determination have nearly the same
relation with other strong line metallicities as do those from
derived from
the classic temperature-sensitive line.
![\begin{figure}
\par\includegraphics[width=6.7cm,clip]{7183fig5.eps}\end{figure}](/articles/aa/full/2007/44/aa7183-07/Timg41.gif) |
Figure 5:
Comparison of the
metallicities and Bayesian metallicities.
Crosses are Sample I. Small dots are Sample II. |
| Open with DEXTER |
Generally speaking, all the methods should result in the same abundance value for a given nebula, but this is not the case in practice.
It is evident that this discrepancy is caused by the problems both
with models of HII regions and calibration. Why is the
calibration of some types, such as the method in this paper,
regarded as the most reliable way to derive the oxygen abundance?
When comparing the numerical HII region models from
Charlot & Longhetti (2001), which are the basis of the Bayesian
abundances, with the numerical models of other authors
(Stasinska & Leitherer 1996; McGaugh 1991;
CLOUDY by Ferland et al. 1998; or Kewley & Dopita 2002),
one finds that there is significant disagreement between
them because these models use different atomic data or different
assumptions, and the stellar evolutionary synthesis code and
photoionization code used in these models continuously
improved. As a result, the present-day models cannot provide any uniform oxygen abundances.
As for calibrations, the calibrations based on the measurements
of real H II regions is believed to be the most favorable way to
derive the oxygen abundances, because it is calibrated by single H II region and
will not be biased by other hot H II regions. That is why we
use empirical metallicity rather than Bayesian metallicity
in high metallicity regions to calibrate Ne3O2 index.
There is a problem that the amount of H II regions with accurate measurements (a number of calibrating points)
are not numerous enough. Therefore one has to use extrapolation, which
can be a cause of uncertainty in the abundance determination.
Because Ar and Ne are produced by the same star, as expected by
stellar nucleosynthesis (Izotov & Thuan 1999), it is instructive to compare
the Ne3O2- and Ar3O3-methods (Stasinska 2006). We show this
comparison for SDSS DR4 sample in Fig. 6.
Although having a large scatter and a clear tendency of the observed
relation to slightly deflect from 1:1, there is agreement
between the oxygen abundance from the Ne3O2-method and the Ar3O3-method
for most galaxies. The dispersion between the -based and
Ar3O3 methods is especially large in the middle metallicity region
(7.95 <
< 8.2). It may be caused by the fact that,
when calibrating Ar3O3 index, the oxygen abundance is calculated using
the empirical P-method, not the -based method (Stasinska 2006), and the empirical P-method is problematic in the middle metallicity region,
especially 7.95 <
< 8.2 (Pilyugin 2001). The different oxygen abundance
determination methods and different calibration methods may be the cause of the slope of the relation slightly deflecting from 1:1.
![\begin{figure}
\par\includegraphics[width=6.7cm,clip]{7183fig6.eps}\end{figure}](/articles/aa/full/2007/44/aa7183-07/Timg42.gif) |
Figure 6:
Comparison of the Ne3O2 and Ar3O3 methods. Ar3O3 metallicity is
calculated using the calibration of Stasinska (2006). Ne3O2 metallicity
is calculated using Eq. (2). Sample I is indicated by stars, and Sample II is indicated by crosses. |
| Open with DEXTER |
The accuracy of the Ar3O3, Ne3O2 indicators are comparable, as can
be judged from Fig. 6. The advantage of the Ne302 method over the Ar303 one is that it does not demand a reliable reddening correction. The most prominent
advantage of the Ne3O2 method over other metallicity indicators, such as
the R23-, N2-, P-, O3N2-methods, lies in its ability to determine
the oxygen abundance for high redshift galaxies. The Ne3O2 line ratio can be
measurable at the extreme redshift limit of ground-based optical surveys.
The Ne3O2, R23, N2, P, O3N2 line ratios can be detected within
several NIR atmospheric windows for the specific redshift
 (Maier et al. 2006); but when it comes to the
  5-6 galaxy, only the Ne3O2 line ratio can be observed with near-infrared instruments. When it comes to the
 galaxy, the Ne3O2 line ratio can be detected with the James Webb Space
Telescope (JWST), which uses a Near Infrared Camera and a Near Infrared
Spectrometer (NIRSpec).
galaxy, the Ne3O2 line ratio can be detected with the James Webb Space
Telescope (JWST), which uses a Near Infrared Camera and a Near Infrared
Spectrometer (NIRSpec).
5 Conclusions
From the literature and SDSS DR4, we collected a large sample of
spectroscopic measurements of H II regions and H II galaxies covering
a wide range in metallicity (7.0 <
< 9.0).
The
values for 210 galaxies (Sample I) in SDSS DR4 are calculated with direct methods
and 2960 galaxies (Sample II) with an empirical method. We confirm the existence of the correlation between Ne3O2 index and oxygen abundance
and have obtained a calibration that can be used as a method for determining oxygen abundances.
The dispersion between oxygen abundance and the Ne3O2 index may come partly from the moderate depletion of oxygen onto grains.
Though the Ne3O2 method is an empirical abundance determination method, we
believe that also using the Ne3O2 index as a metallicity calibrator presents
several advantages:
- 1.
- The Ne3O2 versus metallicity relation is monotonic.
- 2.
- The relationship between Ne3O2 and metallicity is not affected by the
chemical evolution effects because the Ne and O are produced by the same stars.
- 3.
- The Ne3O2 line ratio relies on the ratios of emission lines that are close
in wavelength so do not depend on reddening corrections.
- 4.
- This Ne3O2 line ratio can be measured for galaxies up to
 using an optical
telescope, up to
using an optical
telescope, up to
 using near-infrared instruments on the ground-based
facilities, and up to
using JWST/NIRSpec; therefore, this flux
ratio is a promising tool for metallicity studies at high redshift.
using near-infrared instruments on the ground-based
facilities, and up to
using JWST/NIRSpec; therefore, this flux
ratio is a promising tool for metallicity studies at high redshift.
Acknowledgements
This work was supported by the Chinese National Science Foundation
(Nos. 10521001, 10403006 and 10433010) and the National Basic Research Program of China (973 Program) No.2007CB815404. We thank G. Stasinska and L. S. Pilyugin for their
helpful comments and suggestions. We are grateful to the AGN
group at the Center for Astrophysics, University of the
Science of Technology of China for processing the SDSS spectra for continuum
decomposition and line fitting using the spectral analysis algorithm developed by
the group. Funding for the Sloan Digital Sky Survey (SDSS) has been provided
by the Alfred P. Sloan Foundation, the Participating Institutions, the National
Aeronautics and Space Administration, the National Science Foundation, the US
Department of Energy, the Japanese Monbukagakusho, and the Max Planck Society.
The SDSS Web site is http://www.sdss.org/. The SDSS is managed by the Astrophysical
Research Consortium (ARC) for the Participating Institutions. The Participating
Institutions are The University of Chicago, Fermilab, the Institute for Advanced
Study, the Japan Participation Group, The Johns Hopkins University, the Korean
Scientist Group, Los Alamos National Laboratory, the Max-Planck-Institute for
Astronomy (MPIA), the Max-Planck-Institute for Astrophysics (MPA), New Mexico
State University, University of Pittsburgh, University of Portsmouth, Princeton
University, the United States Naval Observatory, and the University of Washington.
- Bresolin, F., Garnett,
D. R., & Kennicutt, R. C., Jr. 2004, ApJ, 615, 228 [NASA ADS] [CrossRef] (In the text)
- Bresolin, F., Schaerer,
D., González Delgado, R. M., & Stasinska, G. 2005,
A&A, 441, 981 [NASA ADS] [CrossRef] [EDP Sciences] (In the text)
- Charlot, S., &
Fall, S. M. 2000, ApJ, 539, 718C [NASA ADS] [CrossRef] (In the text)
- Charlot, S., &
Longhetti, M. 2001, MNRAS, 323, 887 [NASA ADS] (In the text)
- Cid Fernandes, R.,
Mateus, A., Sodré, L., Stasinska, G., & Gomes, J. M. 2005,
MNRAS, 358, 363 [NASA ADS]
- Contini, T., Treyer, M.
A., Sullivan, M., & Ellis, R. S. 2002, MNRAS, 330, 75 [NASA ADS] (In the text)
- Denicoló, G.,
Terlevich, R., & Terlevich, E. 2002, MNRAS, 330, 69 [NASA ADS] (In the text)
- Dong, X.-B., Zhou,
H.-Y., Wang, T.-G., et al. 2005, ApJ, 620, 629 [NASA ADS] [CrossRef] (In the text)
- Ferland, G. J.,
Korista, K. T., Verner, D. A., et al. 1998, PASP, 110, 761 [NASA ADS] [CrossRef] (In the text)
- Garnett, D. R., &
Kennicutt, R. C., Jr. 1994, ApJ, 426, 123 [NASA ADS] [CrossRef] (In the text)
- Garnett, D. R.,
Shields, G. A., Skillman, E. D., Sagan, S. P., & Dufour, R. J.
1997, ApJ, 489, 63 [NASA ADS] [CrossRef] (In the text)
- Guseva, N. G.,
Papaderos, P., Izotov, Y. I., et al. 2003a, A&A, 407, 75 [NASA ADS] [CrossRef] [EDP Sciences] (In the text)
- Guseva, N. G.,
Papaderos, P., Izotov, Y. I., et al. 2003b, A&A, 407, 91 [NASA ADS] [CrossRef] [EDP Sciences]
- Guseva, N. G.,
Papaderos, P., Izotov, Y. I., et al. 2003c, A&A, 407, 105 [NASA ADS] [CrossRef] [EDP Sciences]
- Izotov, Y. I., &
Thuan, T. X. 1998, ApJ, 500, 188 [NASA ADS] [CrossRef]
- Izotov, Y. I., &
Thuan, T. X. 1999, ApJ, 511, 639 [NASA ADS] [CrossRef] (In the text)
- Izotov, Y. I., &
Thuan, T. X. 2004, ApJ, 602, 200 [NASA ADS] [CrossRef]
- Izotov, Y. I., Thuan,
T. X., & Lipovetsky, V. A. 1994, ApJ, 435, 647 [NASA ADS] [CrossRef] (In the text)
- Izotov, Y. I., Thuan,
T. X., & Lipovetsky, V. A. 1997, ApJS, 108, 1 [NASA ADS] [CrossRef] (In the text)
- Izotov, Y. I.,
Papaderos, P., Guseva, N. G., Fricke, K. J., & Thuan, T. X.
2004, A&A, 421, 539 [NASA ADS] [CrossRef] [EDP Sciences] (In the text)
- Izotov, Y. I.,
Stasinska, G., Meynet, G., Guseva, N. G., & Thuan, T. X. 2006,
A&A, 448, 955 [NASA ADS] [CrossRef] [EDP Sciences] (In the text)
- Kauffmann, G., et al.
2003, MNRAS, 346, 1055 [NASA ADS] (In the text)
- Kennicutt, R. C. 1998,
ARA&A, 36, 189 [NASA ADS] (In the text)
- Kennicutt, R. C.,
Bresolin, F., & Garnett, D. R. 2003, ApJ, 591, 801 [NASA ADS] [CrossRef]
- Kewley, L. J., &
Dopita, M. A. 2002, ApJS, 142, 35 [NASA ADS] [CrossRef] (In the text)
- Kewley, L. J., Jansen,
R. A., & Geller, M. J. 2005, PASP, 117, 227 [NASA ADS] [CrossRef] (In the text)
- Lee, H., McCall, M. L.,
Kingsburgh, R. L., Ross, R., & Stevenson, C. C. 2003a, AJ, 125,
146 [NASA ADS] [CrossRef] (In the text)
- Lee, H., Grebel, E. K.,
& Hodge, P. W. 2003b, A&A, 401, 141 [NASA ADS] [CrossRef] [EDP Sciences]
- Lee, J. C., Salzer, J.
J., & Melbourne, J. 2004, ApJ, 616, 752 [NASA ADS] [CrossRef] (In the text)
- Li, C., Wang, T. G., Zhou,
H.-Y., et al. 2005, AJ, 129, 669 [NASA ADS] [CrossRef] (In the text)
- Liang, Y. C., Yin, S.
Y., Hammer, F., et al. 2006, ApJ, 652, 257 [NASA ADS] [CrossRef] (In the text)
- Lu, H., Zhou, H., Wang, J.,
et al. 2006, AJ, 131, 790 [NASA ADS] [CrossRef] (In the text)
- Maier, C., Lilly, S.
J., Carollo, C. M., et al. 2006, ApJ, 639, 858 [NASA ADS] [CrossRef] (In the text)
- McGaugh, S. S. 1991,
ApJ, 380, 140 [NASA ADS] [CrossRef] (In the text)
- Melbourne, J.,
Phillips, A., Salzer, J. J., Gronwall, C., & Sarajedini, V. L.
2004, AJ, 127, 686 [NASA ADS] [CrossRef] (In the text)
- Nagao, T., Maiolino,
R., & Marconi, A. 2006, A&A, 459, 85 [NASA ADS] [CrossRef] [EDP Sciences] (In the text)
- Pagel, B. E. J.,
Edmunds, M. G., Blackwell, D. E., et al. 1979, MNRAS, 189, 95 [NASA ADS] (In the text)
- Papaderos, P., Izotov,
Y. I., Guseva, N. G., Thuan, T. X., & Fricke, K. J. 2006,
A&A, 454, 119 [NASA ADS] [CrossRef] [EDP Sciences] (In the text)
- Pettini, M., &
Pagel, B. E. J. 2004, MNRAS, 348, L59 [NASA ADS] (In the text)
- Pilyugin, L. S. 2001,
A&A, 369, 594 [NASA ADS] [CrossRef] [EDP Sciences] (In the text)
- de Robertis, M. M.,
Dufour, R. J., & Hunt, R. W. 1987, JRASC, 81, 195 [NASA ADS] (In the text)
- Shaw, R. A., &
Dufour, R. J. 1995, PASP, 107, 896 [NASA ADS] [CrossRef] (In the text)
- Shi, F., Kong, X., &
Cheng, F. Z. 2006, A&A, 453, 487 [NASA ADS] [CrossRef] [EDP Sciences] (In the text)
- Stasinska, G. 2005,
A&A, 434, 507 [NASA ADS] [CrossRef] [EDP Sciences]
- Stasinska, G. 2006,
A&A, 454, L127 [NASA ADS] [CrossRef] [EDP Sciences] (In the text)
- Stasinska, G., &
Leitherer, C. 1996, ApJS, 107, 661 [NASA ADS] [CrossRef] (In the text)
- Thuan, T. X., Izotov,
Y. I., & Lipovetsky, V. A. 1995, ApJ, 445, 108 [NASA ADS] [CrossRef] (In the text)
- Tremonti, et al. 2004,
ApJ, 613, 898 [NASA ADS] [CrossRef] (In the text)
- van Zee, L., Salzer, J.
J., Haynes, M. P., O'Donoghue, A. A., & Balonek, T. J. 1998,
AJ, 116, 2805 [NASA ADS] [CrossRef] (In the text)
- Yin, S. Y., Liang, Y. C.,
Hammer, F., et al. 2007, A&A, 462, 535 [NASA ADS] [CrossRef] [EDP Sciences] (In the text)
- York, D. G., Hall, P.
B., Vanden Berk, D. E., et al. 2001, AJ, 122, 549 [NASA ADS] [CrossRef] (In the text)
Copyright ESO 2007
 =
= 
![\begin{figure}
\par\includegraphics[width=6.6cm,clip]{7183fig1up.eps}\vspace*{5mm}
\includegraphics[width=6.6cm,clip]{7183fig1low.eps}\end{figure}](/articles/aa/full/2007/44/aa7183-07/img32.gif)
![\begin{figure}
\par\includegraphics[width=6.6cm,clip]{7183fig2.eps}\end{figure}](/articles/aa/full/2007/44/aa7183-07/img33.gif)
![\begin{figure}
\par\includegraphics[width=6.6cm,clip]{7183fig3.eps}\end{figure}](/articles/aa/full/2007/44/aa7183-07/img34.gif)
![\begin{figure}
\par\includegraphics[width=6.7cm,clip]{7183fig4up.eps}\vspace*{5mm}
\includegraphics[width=6.7cm,clip]{7183fig4low.eps}\end{figure}](/articles/aa/full/2007/44/aa7183-07/img40.gif)
![\begin{figure}
\par\includegraphics[width=6.7cm,clip]{7183fig5.eps}\end{figure}](/articles/aa/full/2007/44/aa7183-07/img41.gif)
![\begin{figure}
\par\includegraphics[width=6.7cm,clip]{7183fig6.eps}\end{figure}](/articles/aa/full/2007/44/aa7183-07/img42.gif)