A&A 474, 77-104 (2007)
DOI: 10.1051/0004-6361:20077719
M. B. N. Kouwenhoven1,2 - A. G. A. Brown3 - S. F. Portegies Zwart2,4 - L. Kaper2
1 - Department of Physics and Astronomy, University of Sheffield,
Hicks Building, Hounsfield Road, Sheffield S3 7RH, UK
2 -
Astronomical Institute Anton Pannekoek,
University of Amsterdam,
Kruislaan 403, 1098 SJ Amsterdam, The Netherlands
3 -
Leiden Observatory, University of Leiden,
PO Box 9513, 2300 RA
Leiden, The Netherlands
4 -
Section Computer Science, University of Amsterdam,
Kruislaan 403, 1098 SJ Amsterdam, The Netherlands
Received 25 April 2007 / Accepted 18 July 2007
Abstract
We characterize the binary population in the young and nearby OB association Scorpius OB2 (Sco OB2) using available observations of visual, spectroscopic, and astrometric binaries with intermediate-mass primaries. We take into account observational biases by comparing the observations with simulated observations of model associations. The available data indicate a large binary fraction (>70% with ![]() confidence), with a large probability that all intermediate mass stars in Sco OB2 are part of a binary system. The binary systems have a mass ratio distribution of the form
confidence), with a large probability that all intermediate mass stars in Sco OB2 are part of a binary system. The binary systems have a mass ratio distribution of the form
![]() ,
with
,
with
![]() .
Sco OB2 has a semi-major axis distribution of the form
.
Sco OB2 has a semi-major axis distribution of the form
![]() with
with
![]() (Öpik's law), in the range
(Öpik's law), in the range
![]() .
The log-normal period distribution of Duquennoy & Mayor (1991) results in too few spectroscopic binaries, even if the model binary fraction is 100%. Sco OB2 is a young association with a low stellar density; its current population is expected to be very similar to the primordial population. The fact that practically all stars in Sco OB2 are part of a binary (or multiple) system demonstrates that multiplicity is a fundamental factor in the star formation process, at least for intermediate mass stars.
.
The log-normal period distribution of Duquennoy & Mayor (1991) results in too few spectroscopic binaries, even if the model binary fraction is 100%. Sco OB2 is a young association with a low stellar density; its current population is expected to be very similar to the primordial population. The fact that practically all stars in Sco OB2 are part of a binary (or multiple) system demonstrates that multiplicity is a fundamental factor in the star formation process, at least for intermediate mass stars.
Key words: Galaxy: open clusters and associations: individual: Scorpius OB2 - stars: binaries: visual - stars: binaries: general - stars: formation
Over the past decades observations have indicated that a large fraction of stars are part of a binary or multiple system. Apparently, multiplicity is an important aspect of the star formation process. Binaries also play a vital role in explaining many spectacular phenomena in astrophysics, e.g. supernovae type Ia (Hillebrandt & Niemeyer 2000; Yungelson & Livio 1998), short and long gamma-ray bursts (Fryer et al. 1999), OB runaway stars (Hoogerwerf et al. 2001; Gualandris et al. 2004; Blaauw 1961), and binary systems with compact remnants such as X-ray binaries, millisecond pulsars, and double neutron stars (Fryer & Kalogera 1997; van den Heuvel 1994). Binary systems are also known to strongly affect the dynamical evolution of dense stellar clusters (Portegies Zwart et al. 2007; Hut et al. 1992; Portegies Zwart et al. 2001). This is an excellent motivation to characterize the outcome of the star forming process in terms of multiplicity and binary parameters.
In this paper we aim to recover the properties of the population of binaries that result from the formation process: the primordial binary population, which is defined as the population of binaries as established just after the gas has been removed from the forming system, i.e., when the stars can no longer accrete gas from their surroundings (Kouwenhoven et al. 2005). The dynamical evolution of stars of a newly born stellar population is influenced by the presence of gas. After the gas has been removed 1-2 Myr after the formation of the first massive stars, the binary population is only affected by stellar evolution and pure N-body dynamics. From a numerical point of view, the primordial binary population can be considered as a boundary between hydrodynamical simulations and N-body simulations. Hydrodynamical simulations of a contracting gas cloud (e.g., Bate et al. 2003; Martel et al. 2006) produce stars. After the gas is removed by accretion and the stellar winds of the most massive O stars, pure N-body simulations (e.g., Kroupa et al. 1999; Portegies Zwart et al. 2007,2001) can be used to study the subsequent evolution of star clusters and the binary population.
OB associations are well suited for studying the primordial binary population. They are young, with ages ranging from ![]() 2 Myr (Ori OB1b, Cyg OB2; see Brown et al. 1999; Hanson 2003) to
2 Myr (Ori OB1b, Cyg OB2; see Brown et al. 1999; Hanson 2003) to ![]() 50 Myr (
50 Myr (![]() Persei, Cep OB6; see de Zeeuw et al. 1999). Among OB associations younger than
Persei, Cep OB6; see de Zeeuw et al. 1999). Among OB associations younger than ![]() 20 Myr only a handful of the most massive systems have changed due to stellar evolution. The effects of dynamical evolution are expected to be limited due to their young age and low stellar density (
20 Myr only a handful of the most massive systems have changed due to stellar evolution. The effects of dynamical evolution are expected to be limited due to their young age and low stellar density (
![]() ). Moreover, OB associations cover the full range of stellar masses (e.g. Brown 2001), in contrast to the T associations, their low-mass counterparts.
). Moreover, OB associations cover the full range of stellar masses (e.g. Brown 2001), in contrast to the T associations, their low-mass counterparts.
In this paper we focus on Scorpius Centaurus (Sco OB2), the nearest young OB association, and thus a prime candidatefor studying the binary population. The proximity of Sco OB2 (118-145 pc) facilitates observations, and the young age (5-20 Myr) ensures that dynamical evolution has not significantly altered the primordial binary population since the moment of gas removal. The membership and stellar content of the association were established by de Zeeuw et al. (1999) using Hipparcos parallaxes and proper motions, and its binary population is relatively well-studied.
Due to selection effects, it is not possible to observe the binary population in Sco OB2 directly. The dataset is hampered by the selection of the targets and instrumental limits on the observable range in semi-major axis, period, eccentricity and mass ratio. The fact that the observed binary population is biased makes it difficult to draw conclusions about the true binary population. However, by using the method of simulating observations of modeled stellar populations (e.g. Kouwenhoven 2006), it is possible to put constraints on the binary population. We accurately model the selection effects of the six major binarity surveys of Sco OB2, and compare simulated observations with the true observations, to determine the properties of the current binary population in Sco OB2.
The organization of this paper is as follows. In Sect. 2 we briefly describe the method and terminology that we use to recover the true binary population. In Sect. 3 we discuss the Sco OB2 association and membership issues. In Sect. 4 we describe the available datasets with visual, spectroscopic, and astrometric binaries in Sco OB2, and outline our models for the respective selection effects. In Sects. 5-7 we recover the mass ratio distribution and the semi-major axis distribution, and we constrain the eccentricity distribution for the binary population in Sco OB2, respectively. Conclusions on the intrinsic binary fraction of Sco OB2 are drawn in Sect. 8. The possible differences between the current binary population and primordial binary population in Sco OB2 are discussed in Sect. 9. In Sect. 10 we compare our results with those of others, and we discuss the validity of our assumptions. Finally, we summarize our main results in Sect. 11.
We recover the binary population in Sco OB2 from observations using the method of simulating observations of modeled stellar populations. This method is extensively described in Kouwenhoven (2006), and is briefly summarized below.
With increasing computer power, it has become possible to create sophisticated models of star clusters and OB associations. One can compare these simulated associations with the observations of real associations in order to constrain the properties of the intrinsic binary population. However, this cannot be done directly, as the interpretation of the observational dataset is hampered by selection effects. Only a small (and biased) subset of the binary population is known. With the method of simulating observations of simulations (S.O.S.) one characterizes the selection effects, and applies these to the simulated association. The simulated observations that are then obtained can be compared directly with the real observations (see, e.g., Kouwenhoven 2006).
In order to recover the binary population in Sco OB2 we simulate OB association models with different properties. We compare each model with observational data, by simulating observations for each major binarity survey. With this comparison we identify which association model is consistent with the observations, and thus constrain the binary population in Sco OB2. Kouwenhoven (2006) shows that this is a safe method to derive the binary population. As long as the parameter space (of the binary population) is fully searched, and as long as the selection effects are well-modeled, this method allows recovery of the intrinsic binary population, as well as the uncertainties on each derived property. Furthermore, unlike the S.O.S. method used in this paper, the traditional method of correcting for selection effects (using a "correction factor'') may lead to erroneous or unphysical results.
In this paper we make several assumptions when recovering the binary population in Sco OB2.
In our model we consider only single stars and binary systems; no higher order multiples are assumed to be present. In Sect. 10.1 we will briefly return to the consequences of this assumption. We assume the distributions of the different observed parameters to be independent of each other:
In our models the overall binary fraction for the association can be described with a single number, independent of the primary mass
![]() .
Observations of other stellar populations have suggested that the binary fraction may depend on primary mass or system mass, and that binary fraction tends to increase with increasing primary mass (e.g. Sterzik & Durisen 2004; Preibisch et al. 1999), though a quantitative description for
FM(M1) is still unavailable. In our models we therefore adopt a binary fraction independent of primary mass, so as to keep our description for the binary population in Sco OB2 as simple as possible. Note that Kouwenhoven (2006) has shown that selection effects may introduce a trend between binary fraction and primary mass in the observations, even though such an intrinsic trend may not be present in reality.
However, our assumption does not influence the results significantly, as in this paper we only study the population of binary stars with an intermediate mass primary, mostly of spectral type B or A. As this corresponds to a small mass range, we neglect the possible correlation between binary fraction and primary mass (see Sect. 10.4 for a further discussion).
.
Observations of other stellar populations have suggested that the binary fraction may depend on primary mass or system mass, and that binary fraction tends to increase with increasing primary mass (e.g. Sterzik & Durisen 2004; Preibisch et al. 1999), though a quantitative description for
FM(M1) is still unavailable. In our models we therefore adopt a binary fraction independent of primary mass, so as to keep our description for the binary population in Sco OB2 as simple as possible. Note that Kouwenhoven (2006) has shown that selection effects may introduce a trend between binary fraction and primary mass in the observations, even though such an intrinsic trend may not be present in reality.
However, our assumption does not influence the results significantly, as in this paper we only study the population of binary stars with an intermediate mass primary, mostly of spectral type B or A. As this corresponds to a small mass range, we neglect the possible correlation between binary fraction and primary mass (see Sect. 10.4 for a further discussion).
Table 1:
Properties of the subgroups Upper Scorpius (US), Upper Centaurus Lupus (UCL), and Lower Centaurus Crux (LCC) of Sco OB2, and of our model for Sco OB2. Columns 2-4 list for each subgroup its distance, effective radius, and age. Column 5 lists the median interstellar extinction towards each subgroup. Column 6 lists the number of confirmed Hipparcos members of each subgroup, and is followed by the observed number of singles, binaries, triples, and higher-order systems among the confirmed members in Cols. 7-10, taken from Kouwenhoven et al. (2007). Finally, Cols. 11-13 list the observed multiplicity fraction, non-single star fraction, and companion star fraction among the confirmed members (see Kouwenhoven et al. 2005, for a definition of these fractions). Note that the latter quantities are lower limits due to the presence of unresolved binary and multiple systems. In the bottom row we list the properties of our Sco OB2 model. The number of systems N=S+B (i.e., singles and binaries) used in our model includes substellar objects with masses down to
![]() .
References: (1) de Zeeuw et al. (1999); (2) de Geus et al. (1989); (3) Preibisch et al. (2002); (4) Mamajek et al. (2002); (5) de Bruijne (1999).
.
References: (1) de Zeeuw et al. (1999); (2) de Geus et al. (1989); (3) Preibisch et al. (2002); (4) Mamajek et al. (2002); (5) de Bruijne (1999).
For the same reason, we assume the semi-major axis a and eccentricity e to be independent of primary mass.
The independence of the semi-major axis a with respect to the eccentricity e may be a good approximation, as observations suggest that these parameters are only mildly correlated for solar-type stars in the solar neighbourhood (e.g., Duquennoy & Mayor 1991; Heacox 1997); see also Sect. 7. Note, however, that even in the case that this dependence is absent in the intrinsic population, a correlation may still be present in the observations due to selection effects.
We assume that the inclination i, the argument of periastron ![]() ,
the position angle of the ascending node
,
the position angle of the ascending node ![]() ,
and the mean anomaly
,
and the mean anomaly
![]() at some instant of time are independent of each other and of all other parameters.
Finally, we assume that the binary systems have a random orientation in space (which is not necessarily implied by the previous assumptions). Even in the unlikely case that binary systems do not have a random orientation, the results do not change measurably (see Kouwenhoven 2006). Note that the primary and companion mass distributions are never independent,
at some instant of time are independent of each other and of all other parameters.
Finally, we assume that the binary systems have a random orientation in space (which is not necessarily implied by the previous assumptions). Even in the unlikely case that binary systems do not have a random orientation, the results do not change measurably (see Kouwenhoven 2006). Note that the primary and companion mass distributions are never independent,
![]() ,
as by definition
,
as by definition
![]() .
.
For reasons of simplicity, we ignore the interaction between close binary stars; our models do not include Roche Lobe overflow or common envelope evolution. Low-mass contact binaries, such as cataclysmic variables, WUMa binaries, and symbiotic stars generally appear on a timescale which is significantly longer than the age of Sco OB2. The higher-mass contact binaries, such as high-mass X-ray binaries, close binaries with mass reversal, and double pulsars could be present, or may have escaped the association as runaways. Due to the youth of Sco OB2, a few of the closest binaries may have evolved into such objects. The non-inclusion of this close binaries, however, is unlikely to affect our conclusions on the primordial binary population, as we adopt a lower limit to the period of 12 h (Sect. 6.1). If these binaries are present, our inferred binary fraction (Sect. 8) may be slightly underestimated.
Throughout this paper we denote the (intrinsic) probability density function of a binary parameter x as fx(x) and its cumulative distribution as Fx(x). The corresponding observed distributions for a binarity survey are denoted as
![]() and
and
![]() ,
respectively.
,
respectively.
Sco OB2 is currently the best studied OB association. It consists of three subgroups: Upper Scorpius (US), Upper Centaurus Lupus (UCL) and Lower Centaurus Crux (LCC) (e.g., de Zeeuw et al. 1999; Blaauw 1964). These three subgroups are likely the result of triggered star formation (e.g., Preibisch & Zinnecker 1999,2007; Blaauw 1991), and in turn may have triggered star formation in the ![]() Ophiuchus region. Several properties of the three subgroups of Sco OB2 are listed in Table 1.
Ophiuchus region. Several properties of the three subgroups of Sco OB2 are listed in Table 1.
Preibisch et al. (2002) performed an extensive study of the single star population of the US subgroup of Sco OB2. They combine their observations of PMS-stars with those of Preibisch & Zinnecker (1999) and de Zeeuw et al. (1999) and derive an empirical mass distribution in the mass range
![]() (Eq. (2)). Lodieu et al. (2006) on the other hand studied the low-mass and substellar population of Sco OB2 and find a best-fitting value
(Eq. (2)). Lodieu et al. (2006) on the other hand studied the low-mass and substellar population of Sco OB2 and find a best-fitting value
![]() of the mass distribution
of the mass distribution
![]() in the mass range 0.01-
in the mass range 0.01-
![]() .
The results of both studies overlap in the region 0.1-
.
The results of both studies overlap in the region 0.1-
![]() .
In this region Preibisch et al. (2002) find a slope
.
In this region Preibisch et al. (2002) find a slope
![]() of the mass distribution, while Lodieu et al. (2006) find
of the mass distribution, while Lodieu et al. (2006) find
![]() .
The slight difference between the measured slopes is likely statistical. It is clear, however, that the mass distribution for Sco OB2 has a break at a certain value
.
The slight difference between the measured slopes is likely statistical. It is clear, however, that the mass distribution for Sco OB2 has a break at a certain value ![]() in (or near) the mass range 0.1-
in (or near) the mass range 0.1-
![]() .
For this reason we model the mass distribution fM(M) in Sco OB2 as follows:
.
For this reason we model the mass distribution fM(M) in Sco OB2 as follows:
In our analysis we focus on deriving the properties of the intermediate mass binary population, as ample observations of these are available. Due to a lack of systematic surveys for binarity among low-mass stars in Sco OB2 we cannot constrain these. For these reasons, the form of the mass distribution fM(M) for
![]() is irrelevant, unless both the primary and the companion are directly drawn from fM(M). In Sect. 5 we show that the observations exclude the latter possibility, given any reasonable value of
is irrelevant, unless both the primary and the companion are directly drawn from fM(M). In Sect. 5 we show that the observations exclude the latter possibility, given any reasonable value of
![]() and
and ![]() .
In Sect. 5 we will also show that binary systems in Sco OB2 are well described with a primary mass distribution fM(M) and a mass ratio distribution fq(q), so that the exact values of
.
In Sect. 5 we will also show that binary systems in Sco OB2 are well described with a primary mass distribution fM(M) and a mass ratio distribution fq(q), so that the exact values of
![]() and
and ![]() are irrelevant.
are irrelevant.
We create association models using the STARLAB simulation package (see, e.g., Portegies Zwart et al. 2001). The properties of the stellar and binary population are projected onto the space of observables using an extension of the STARLAB package. We adopt a Plummer model (Plummer 1911) with a projected half-mass radius of 20 pc, and assume virial equilibrium. Note that, as in this paper we do not evolve the models over time, the latter assumptions do not affect our results.
In our model for Sco OB2 we adopt a distance of 130 pc (the median distance of the confirmed members of Sco OB2) and an age of 5 Myr. Although the subgroups UCL and LCC are older than US, the systematic error introduced by our choice of the age is small. In our models we slightly overestimate the luminosity of stars in the UCL and LCC subgroups, but this affects only the stars close to the detection limit (see Sect. 3.2), and does not affect the properties of our simulated observations significantly. The error in the age neither affects the interpretation of the observed mass ratio distribution, as each observed mass and mass ratio is derived from the absolute magnitude of the stars, assuming the correct age for the subgroup, and using the Hipparcos parallax for each star individually. The distribution of these observed mass ratios are then compared with those of the model.
We adopt the extended Preibisch mass distribution in Eq. (2) for our model of Sco OB2. We make the assumptions that (1) the mass distribution for the subgroups UCL and LCC is identical to that of US, (2) we adopt a minimum mass
![]() (i.e., we do not consider planetary-mass objects in our mass distribution), and (3) we adopt
(i.e., we do not consider planetary-mass objects in our mass distribution), and (3) we adopt
![]() for the mass distribution. As in our study we focus on intermediate-mass binaries, assumptions (2) and (3) are only of importance if both components are directly drawn from the mass distribution. In Sect. 5 we discuss this issue and we will show that the exact values of
for the mass distribution. As in our study we focus on intermediate-mass binaries, assumptions (2) and (3) are only of importance if both components are directly drawn from the mass distribution. In Sect. 5 we discuss this issue and we will show that the exact values of
![]() and
and ![]() are irrelevant for our study.
are irrelevant for our study.
Preibisch et al. (2002) estimate that the US subgroup contains approximately 2525 single/primary stars in the mass range 0.1-
![]() .
With the extension to lower mass in Eq. (2) the number of singles/primaries is higher, as we also include the very low mass stars and brown dwarfs. For a minimum mass
.
With the extension to lower mass in Eq. (2) the number of singles/primaries is higher, as we also include the very low mass stars and brown dwarfs. For a minimum mass
![]() and a value
and a value
![]() ,
and assuming that the UCL and LCC subgroups have an equal number of singles/primaries, the total number of singles/primaries in Sco OB2 is approximately 9200. For a value
,
and assuming that the UCL and LCC subgroups have an equal number of singles/primaries, the total number of singles/primaries in Sco OB2 is approximately 9200. For a value
![]() in Eq. (2) the number of singles/primaries is approximately 8000. Free-floating planets (
in Eq. (2) the number of singles/primaries is approximately 8000. Free-floating planets (
![]() )
are not included in the above statistics. We will therefore adopt
N=S+B=9000 systems (
)
are not included in the above statistics. We will therefore adopt
N=S+B=9000 systems (
![]() )
in our simulations, where S is the number of single stars, and B the number of binary systems.
)
in our simulations, where S is the number of single stars, and B the number of binary systems.
We obtain the magnitude of each simulated star in the optical and near-infrared bands using the isochrones described in Kouwenhoven et al. (2005). These isochrones consist of models from Chabrier et al. (2000) for
![]() ,
Palla & Stahler (1999) for
,
Palla & Stahler (1999) for
![]() ,
and Girardi et al. (2002) for
,
and Girardi et al. (2002) for
![]() .
We adopt the isochrone corresponding to an age of 5 Myr and solar metallicity.
By adopting 5 Myr isochrones we overestimate the brightness of 20 Myr old stars by
.
We adopt the isochrone corresponding to an age of 5 Myr and solar metallicity.
By adopting 5 Myr isochrones we overestimate the brightness of 20 Myr old stars by
![]() mag in
mag in
![]() for stars with
for stars with
![]() and by
and by
![]() mag in
mag in
![]() for stars with
for stars with
![]() .
The error introduced by the metallicity (
.
The error introduced by the metallicity (
![]() mag in
mag in
![]() )
is negligible for our purposes: see Kouwenhoven et al. (2007) for a more detailed description of these matters. The Hipparcos magnitude
)
is negligible for our purposes: see Kouwenhoven et al. (2007) for a more detailed description of these matters. The Hipparcos magnitude ![]() for each star is derived from its V magnitude and V-I colour, using the tabulated values listed in the Hipparcos Catalogue (ESA 1997, Vol. 1, Sect. 14.2). For each star we convert the absolute magnitude into the apparent magnitude using the Hipparcos parallax of each star. We do not include interstellar extinction in our models. Sco OB2 is practically cleared of gas. The median visual extinction for the member stars of the three subgroups is
for each star is derived from its V magnitude and V-I colour, using the tabulated values listed in the Hipparcos Catalogue (ESA 1997, Vol. 1, Sect. 14.2). For each star we convert the absolute magnitude into the apparent magnitude using the Hipparcos parallax of each star. We do not include interstellar extinction in our models. Sco OB2 is practically cleared of gas. The median visual extinction for the member stars of the three subgroups is
![]() mag,
mag,
![]() mag, and,
mag, and,
![]() mag, respectively (de Bruijne 1999), which translate to values of
mag, respectively (de Bruijne 1999), which translate to values of
![]() mag,
mag,
![]() mag, and,
mag, and,
![]() mag in the near-infrared (Mathis 1990). For the purpose of our study the interstellar extinction can thus be neglected, in particular for the study of the near-infrared surveys of Shatsky & Tokovinin (2002), Kouwenhoven et al. (2005), and Kouwenhoven et al. (2007).
mag in the near-infrared (Mathis 1990). For the purpose of our study the interstellar extinction can thus be neglected, in particular for the study of the near-infrared surveys of Shatsky & Tokovinin (2002), Kouwenhoven et al. (2005), and Kouwenhoven et al. (2007).
![\begin{figure}
\par\includegraphics[width=5.5cm,clip]{7719f1.ps}
\end{figure}](/articles/aa/full/2007/40/aa7719-07/img104.gif) |
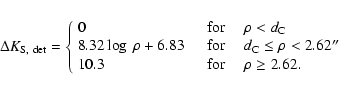
Figure 1: The completeness of the Hipparcos catalogue in the Sco OB2 region, as a function of V magnitude. The diamonds represent the ratio between the number of stars in the Hipparcos catalogue and the number of stars in the TYCHO-2 catalogue, in each V magnitude bin. The comparison above is made for the Sco OB2 region, and is similar for each of the three subgroups of Sco OB2. The solid line represents the model for the completeness adopted in this paper (Eq. (3)). |
| Open with DEXTER | |
De Zeeuw et al. (1999) have published a census of the stellar content and membership of nearby (![]() 1 kpc) OB associations. They present a list of 521 members of the Sco OB2 association, based on the Hipparcos position, proper motion, and parallax of each star. Of these members, 120 are in the US subgroup, 221 in UCL, and 180 in LCC. Due to the Hipparcos completeness limit, most of the confirmed members are bright (
1 kpc) OB associations. They present a list of 521 members of the Sco OB2 association, based on the Hipparcos position, proper motion, and parallax of each star. Of these members, 120 are in the US subgroup, 221 in UCL, and 180 in LCC. Due to the Hipparcos completeness limit, most of the confirmed members are bright (![]() mag) and mostly of spectral type B, A, and F.
mag) and mostly of spectral type B, A, and F.
| |
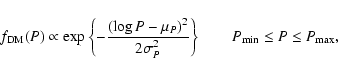
Figure 2:
Properties of the observed binary population in Sco OB2. Only the 521 confirmed members of Sco OB2 are considered. The top-left panel shows the angular separation distribution for visual binaries, at the moment of observation. The other panels show the distribution over radial velocity amplitude K1, the projected semi-major axis
|
| Open with DEXTER | |
In the analysis of the observational data (Sect. 4) we consider only the confirmed members of Sco OB2 (i.e., those identified by de Zeeuw et al. 1999), all of which are in the Hipparcos catalogue. Among the stars observed by Hipparcos it is unlikely that a Sco OB2 member star is not identified as such. On the other hand, it is possible that non-members are falsely classified as members of Sco OB2; the so-called interlopers. The fraction of interlopers among the "confirmed'' Sco OB2 members stars is estimated to be
![]() for B stars,
for B stars,
![]() for A stars, and
for A stars, and
![]() for F and G stars (see Tables A2 and C1 in de Zeeuw et al. 1999). The interlopers among B and A stars are likely Gould Belt stars, which have a distance and age comparable to that of the nearby OB associations. In our analysis we assume that all confirmed members in the list of de Zeeuw et al. (1999) are truly member stars, and do not attempt to correct for the presence of interlopers.
for F and G stars (see Tables A2 and C1 in de Zeeuw et al. 1999). The interlopers among B and A stars are likely Gould Belt stars, which have a distance and age comparable to that of the nearby OB associations. In our analysis we assume that all confirmed members in the list of de Zeeuw et al. (1999) are truly member stars, and do not attempt to correct for the presence of interlopers.
The Hipparcos completeness limit is studied in detail by Söderhjelm (2000). His prescription for the completeness is based on all entries in the Hipparcos catalogue. However, many OB associations were studied in detail by Hipparcos, based on candidate membership lists. Due to the Hipparcos crowding limit of 3 stars per square degree, only a selected subset of the candidate members of Sco OB2 was observed (see de Zeeuw et al. 1999, for details), which significantly complicates the modeling of the Hipparcos completeness.
We therefore calibrate the completeness of Hipparcos in the Sco OB2 region by comparing the number of Hipparcos entries with the number of stars of a given magnitude in the same region. We use the TYCHO-2 catalogue for this comparison. The TYCHO-2 catalogue is complete to much fainter stars than Hipparcos. In Fig. 1 we show the proportion P of stars that is in the Hipparcos catalogue, relative to the number of stars in the TYCHO-2 catalogue, as a function of V magnitude. We model the proportion P as a function of V with three line segments:
Apart from the large membership study of de Zeeuw et al. (1999), several others have been performed. Several recent studies have focused on the membership of low-mass objects, in particular of brown dwarfs (e.g. Kraus et al. 2005; Lodieu et al. 2006; Slesnick et al. 2006). These studies often focus on a small group of suspected members in a specific region of Sco OB2, and the membership is mostly based on the (less accurate) photometric method. As no census on membership of low-mass stars and brown dwarfs is currently available, we do not include these in our analysis.
Table 2: References to literature data with spectroscopic, astrometric, eclipsing, and visual binaries among the Hipparcos members of Sco OB2. The data for a number of binary systems in Sco OB2 is taken from several catalogues. This table is similar to the one presented in Kouwenhoven et al. (2005), but is updated with recent discoveries.
A large fraction of the Sco OB2 member stars is known to be part of a binary or multiple system. In Table 1 we have provided an overview of the observed binary fraction in the association, for which we included all known binary and multiple systems in Sco OB2. In total there are 266 known companions among the 521 confirmed members of Sco OB2, most of which are intermediate mass stars. The multiplicity fraction in Sco OB2 is at least 40% among these stars, assuming that all proposed companions are indeed physical companions. The references for these binary and multiple systems are listed in Table 2. Figure 2 shows several observed parameter distributions. These observed distributions are not representative of the intrinsic distributions, as selection effects prohibit the detection of a significant fraction of the companion stars. Furthermore, it is possible that several of the reported companions are spurious, including for example bright background stars that are projected close to a Sco OB2 member star.
Table 3: An overview of the datasets used to derive the properties of the binary population in Sco OB2. Columns 1-3 list the dataset acronym, the reference, and the type of binary studied in the dataset. Columns 4 and 5 list the number of targets in the original dataset, and the number of companions found for these targets. Columns 6 and 7 list the number of targets and companions used in our analysis. This dataset is smaller than the original dataset, as we do not include the non-members of Sco OB2 in our analysis and at most one companion per targeted star in the case of a multiple systems. The datasets partially overlap, which is taken into account when these are combined in the following sections. We list in this table the total number of spectroscopic binaries, including the radial velocity variables (RVVs; irrespective of their true nature), SB1s, and SB2s. For the Hipparcos observations we list the number of entries in the categories (X), (O), (G), (C), and (S), among the confirmed members of Sco OB2.
The known binary systems in Sco OB2 were discovered by different observers, using various techniques and instruments. As each of these observing runs is characterized by specific selection effects, it is difficult to study each of these in detail. We therefore focus primarily on a subset of the surveys: those of Shatsky & Tokovinin (2002); Kouwenhoven et al. (2007,2005); Brown & Verschueren (1997); Levato et al. (1987), and those detected by Hipparcos (ESA 1997). We refer to these papers and the corresponding datasets as KO5, KO6, SHT, LEV, BRV, and HIP, hereafter. An overview of the number of observed targets and detected binary systems in each dataset is presented in Table 3. Combined, these datasets contain a large fraction of the known binary and multiple systems in Sco OB2. The selection effects for each of these datasets can be modeled, making it possible to use the method of simulated observations. In the following sections we describe these five datasets, and discuss our model for the selection effects.
In our approach we follow the modeling of the selection effects for visual, spectroscopic, and astrometric binarity surveys, which is extensively discussed in Kouwenhoven (2006). A summary of the modeled selection effects for each of the surveys is given in Table 4. With the sample bias we refer to the process of selecting the targets of interest. A selected sample for a survey usually consists of a group of stars with specific properties, such as the solar-type stars in the solar neighbourhood, or the B stars in an association. In the case of a binary survey among the members of an OB association, the observer may erroneously include a bright background star, assuming that it is an association member. We consider this part of the sample bias, although we do not discuss this aspect in this paper. When the selected targets are surveyed for binarity, observational constraints are responsible for the instrument bias. For example, the minimum and maximum detectable angular separation of binary stars is determined by the properties of the telescope and the detector. We include in the instrument bias the selection effects imposed by the telescope-instrument combination and atmospheric conditions. We additionally include the bias that results from the difficulties of identifying companions. For example, faint companions at a large separation of their primary may not always be identified as such, due to the confusion with background stars.
Table 4: An overview of the models for the selection effects used to generate simulated observations of simulated OB associations, for the six major datasets discussed in Sects. 4.1 to 4.6. The sample bias, resulting from the choice of the sample alone, includes the observer's choice and the brightness constraint. All other constraints result from the properties of the telescope, detector, atmospheric conditions, and confusion with background stars, and are in this paper referred to as the instrument bias. For a detailed description of the constraints mentioned in this table we refer to Sect. 4.5 of Kouwenhoven (2006).
Kouwenhoven et al. (2005) performed a near-infrared adaptive optics binarity survey among A and late-B members of Sco OB2. Their observations were obtained with the ADONIS/SHARPII+ system on the ESO 3.6 meter telescope at La Silla, Chile. Adaptive optics was used to obtain high spatial resolution, in order to bridge the gap between the known close spectroscopic and wide visual binaries.
The survey was performed in the near-infrared, as in this wavelength regime the contrast between the components of a binary system with a high mass ratio is less than in the visual regime.
All targets were observed in the ![]() band, and several additionally in the J and H bands.
KO5 selected their sample of A and late-B targets from the list of confirmed Hipparcos members that were identified by de Zeeuw et al. (1999). All targets have
band, and several additionally in the J and H bands.
KO5 selected their sample of A and late-B targets from the list of confirmed Hipparcos members that were identified by de Zeeuw et al. (1999). All targets have
![]() ,
which corresponds to similar limits in the
,
which corresponds to similar limits in the ![]() band.
band.
With their observations KO5 are sensitive to companions as faint as
![]() mag, corresponding to the brightness of a massive planet in Sco OB2. Due to the large probability of finding faint background stars in the field of view, KO5 classify all secondaries with
mag, corresponding to the brightness of a massive planet in Sco OB2. Due to the large probability of finding faint background stars in the field of view, KO5 classify all secondaries with
![]() mag as background stars, and those with
mag as background stars, and those with
![]() mag as candidate companion stars. The
mag as candidate companion stars. The
![]() criterion separates companion stars and background stars in a statistical manner, and is based on the background star study of SHT. A member of Sco OB2 with
criterion separates companion stars and background stars in a statistical manner, and is based on the background star study of SHT. A member of Sco OB2 with
![]() mag has a mass close to the hydrogen-burning limit. The follow-up study of KO6 with VLT/NACO (see Sect. 4.2) has shown that the
mag has a mass close to the hydrogen-burning limit. The follow-up study of KO6 with VLT/NACO (see Sect. 4.2) has shown that the
![]() criterion correctly classifies secondaries as companions in 80-
criterion correctly classifies secondaries as companions in 80-![]() of the cases.
With their survey KO5 find 151 secondaries around the 199 target stars. Out of these 151 secondaries, 74 are candidate companions (
of the cases.
With their survey KO5 find 151 secondaries around the 199 target stars. Out of these 151 secondaries, 74 are candidate companions (
![]() mag), and 77 are background stars (
mag), and 77 are background stars (
![]() mag).
KO5 find that the mass ratio distribution fq(q) for late-B and A type stars in Sco OB2 is consistent with
mag).
KO5 find that the mass ratio distribution fq(q) for late-B and A type stars in Sco OB2 is consistent with
![]() ,
and exclude random pairing between primary and companion.
,
and exclude random pairing between primary and companion.
All 199 targets in the KO5 dataset are confirmed members of Sco OB2, and are therefore included in our analysis. We use in our analysis a subset of the companions identified in KO5.
Several targets in the ADONIS survey have more than one candidate or confirmed companion. In this paper we do not study triples and higher-order multiples; we consider at most one companion per target star. For each of these candidate multiple systems we include the (candidate) companion that is most likely a physical companion.
For HIP 52357 we include the companion with
![]() ,
as it is brighter and closer to the target star than the candidate companion with
,
as it is brighter and closer to the target star than the candidate companion with
![]() .
For the same reason, we do not include the wide and faint candidate companion of HIP 61796 with
.
For the same reason, we do not include the wide and faint candidate companion of HIP 61796 with
![]() in our analysis. KO5 find two bright and close companions of HIP 76001, with
in our analysis. KO5 find two bright and close companions of HIP 76001, with
![]() and
and
![]() ,
respectively. Although HIP 76001 is likely a physical triple, we choose to retain only the innermost candidate companion.
KO5 find a bright secondary separated 1.8'' from HIP 63204. With their follow-up study, KO6 find a close companion at
,
respectively. Although HIP 76001 is likely a physical triple, we choose to retain only the innermost candidate companion.
KO5 find a bright secondary separated 1.8'' from HIP 63204. With their follow-up study, KO6 find a close companion at
![]() .
KO6 show that this close companion is physical, while the secondary at 1.8'' is optical; we do not consider the latter secondary in our analysis.
.
KO6 show that this close companion is physical, while the secondary at 1.8'' is optical; we do not consider the latter secondary in our analysis.
HIP 68532 and HIP 69113 are both confirmed triple systems, each with a primary and a "double companion''. For both HIP 68532 and HIP 69113, the two stars in the "double companion'' have a similar separation and position angle with respect to the primary, and a similar magnitude. In physical terms, the double companions of HIP 68532 and HIP 69113 could have originated from a more massive companion that fragmented into a binary. We therefore model the double companions of these stars as single companions, taking the average ![]() and
and ![]() ,
the combined
,
the combined ![]() magnitude, and the total mass of each double companion.
magnitude, and the total mass of each double companion.
For the comparison with the simulated observations the targets HIP 77315 and HIP 77317 are both considered as individual, single stars. The star HIP 77317 is known to be a companion of HIP 77315 at
![]() ,
and is for that reason listed as such in KO5. This binary system is far too wide to be detected with the observing strategy of KO5; both stars are therefore treated as individual stars.
With the ADONIS survey KO5 find three candidate companions of HIP 81972. Of these three, only the secondary at separation 5.04'' is a confirmed companion in the follow-up study of Kouwenhoven et al. (2007). As HIP 81972 is near the Galactic plane, the other two secondaries are likely background stars, and are thus not included in the dataset.
,
and is for that reason listed as such in KO5. This binary system is far too wide to be detected with the observing strategy of KO5; both stars are therefore treated as individual stars.
With the ADONIS survey KO5 find three candidate companions of HIP 81972. Of these three, only the secondary at separation 5.04'' is a confirmed companion in the follow-up study of Kouwenhoven et al. (2007). As HIP 81972 is near the Galactic plane, the other two secondaries are likely background stars, and are thus not included in the dataset.
KO5 separated the secondaries into candidate companions and background stars using the ![]() magnitude of each secondary. The follow-up study of KO6, using multi-colour analysis, has shown that several of these candidate companions are background stars. We do not consider in our analysis these secondaries, indicated with HIP 53701-1 (
magnitude of each secondary. The follow-up study of KO6, using multi-colour analysis, has shown that several of these candidate companions are background stars. We do not consider in our analysis these secondaries, indicated with HIP 53701-1 (
![]() mag), HIP 60851-1 (
mag), HIP 60851-1 (
![]() mag), HIP 60851-2 (
mag), HIP 60851-2 (
![]() mag), HIP 80142-1 (
mag), HIP 80142-1 (
![]() mag), and HIP 80474-1 (
mag), and HIP 80474-1 (
![]() mag) in KO6.
mag) in KO6.
The resulting KO5 dataset that we use for our analysis contains data for 199 targets with a total of 60 companion stars. For each of these targets and their companions we use the measurements given in KO5, unless more recent (and more accurate) measurements for these stars are presented in the follow-up study of KO6. For each of the targets HIP 63204, HIP 73937, and HIP 79771 a new close companion is resolved by KO6, which was unresolved in the observations of KO5. For these three targets we use the properties of the primary star as provided by KO6.
The mass of each primary and companion is derived from the near-infrared magnitude. If available, the mass of each star is taken from KO6, who use the
![]() magnitude to derive the mass. In all other cases the mass is taken from KO5, who derive the mass from the
magnitude to derive the mass. In all other cases the mass is taken from KO5, who derive the mass from the ![]() magnitude only. The more recently determined masses allow us to better constrain the properties of the binary population in Sco OB2. Finally, the mass ratio
q = M2/M1 is calculated for each binary system. In the Appendix (Table A.1) we list the properties of the binaries used for comparison with simulated observations.
magnitude only. The more recently determined masses allow us to better constrain the properties of the binary population in Sco OB2. Finally, the mass ratio
q = M2/M1 is calculated for each binary system. In the Appendix (Table A.1) we list the properties of the binaries used for comparison with simulated observations.
We model the sample bias in KO5 as follows. The authors selected the A and late-B members of Sco OB2. As these members were identified as such in the Hipparcos membership study of de Zeeuw et al. (1999) we first impose the Hipparcos completeness (see Sect. 3.3) on the simulated association. Based on the properties of the target list of KO5, we model the observer's choice and brightness constraint by removing all targets (i.e. singles and primaries) with V < 5.3 mag, all targets with V > 9.5 mag, and all targets with
![]() from the sample.
from the sample.
We model the detection limit of the KO5 observations using the analysis presented in KO6, who describe these in detail. We study the 50% detection limit (in terms of the magnitude difference
![]() )
and find its dependence on angular separation and Strehl ratio (SR). We parametrize the dependence of the detection limit
)
and find its dependence on angular separation and Strehl ratio (SR). We parametrize the dependence of the detection limit
![]() in magnitudes on Strehl ratio (SR) as
in magnitudes on Strehl ratio (SR) as
![\begin{figure}
\par\includegraphics[width=6cm,clip]{7719f3.ps}
\end{figure}](/articles/aa/full/2007/40/aa7719-07/img160.gif) |
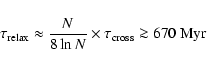
Figure 3:
The 50% detection limit
|
| Open with DEXTER | |
KO5 considered only the secondaries with
![]() mag as physical companions. The follow-up study of KO6 has shown that this
mag as physical companions. The follow-up study of KO6 has shown that this
![]() criterion indeed correctly classifies most of the companions and background stars. We therefore identify in our simulated observations only the companions with
criterion indeed correctly classifies most of the companions and background stars. We therefore identify in our simulated observations only the companions with
![]() mag as true companions.
mag as true companions.
Each measurement is assigned a detection probability
![]() as a function of angular separation
as a function of angular separation ![]() .
This detection probability refers solely to whether or not a companion is projected into the field of view. As the field of view is not circular, the detection probability of a companion is a function of angular separation. For ADONIS we have a square field of view sized
.
This detection probability refers solely to whether or not a companion is projected into the field of view. As the field of view is not circular, the detection probability of a companion is a function of angular separation. For ADONIS we have a square field of view sized
![]() .
KO5 observed each target four times, each time with the target in another quadrant of the field of view, so that the effective field of view is
.
KO5 observed each target four times, each time with the target in another quadrant of the field of view, so that the effective field of view is
![]() .
The probability
.
The probability ![]() that a secondary with an angular separation
that a secondary with an angular separation ![]() is in the field-of-view is then given by:
is in the field-of-view is then given by:
![\begin{figure}
\par\includegraphics[width=6cm,clip]{7719f4.ps}
\end{figure}](/articles/aa/full/2007/40/aa7719-07/img166.gif) |
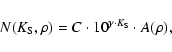
Figure 4:
In the three imaging surveys for binarity discussed in this paper (KO5, KO6, and SHT) the field-of-view is non-circular. Whether a secondary is in the field of view, depends therefore not only on its separation |
| Open with DEXTER | |
The results of the ADONIS binarity survey performed by KO5 raised several questions, in particular on the absence of faint secondaries in the 1''-4'' separation range, and on the validity of the
![]() criterion that KO5 used to separate secondaries into companion stars and background stars. Although SHT and KO5 argue that the latter criterion statistically classifies the background stars correctly, the correct classification of the companion stars with
criterion that KO5 used to separate secondaries into companion stars and background stars. Although SHT and KO5 argue that the latter criterion statistically classifies the background stars correctly, the correct classification of the companion stars with
![]() mag was still uncertain.
To address this issue, KO6 performed follow-up multi-colour
mag was still uncertain.
To address this issue, KO6 performed follow-up multi-colour
![]() observations of a subset of the ADONIS targets. With multi-colour observations, each secondary can be placed in the colour-magnitude diagram, and compared with the isochrone of the Sco OB2 subgroups. Companion stars are expected to be near the isochrone, while background stars are (generally) expected to be far from the isochrone.
observations of a subset of the ADONIS targets. With multi-colour observations, each secondary can be placed in the colour-magnitude diagram, and compared with the isochrone of the Sco OB2 subgroups. Companion stars are expected to be near the isochrone, while background stars are (generally) expected to be far from the isochrone.
The observations described in KO6 were carried out with the adaptive optics instrument NAOS-CONICA (NACO), mounted on the ESO Very Large Telescope on Paranal, Chile. A subset of 22 (out of 199) KO5 targets were selected for follow-up observations. The subset was not randomly selected, but preference was given to faint and close background stars, to secondaries with
![]() mag, and to newly discovered candidate companions.
KO6 analyzed the
mag, and to newly discovered candidate companions.
KO6 analyzed the
![]() observations of these 22 stars observed with NACO, including the multi-colour ADONIS observations of 9 targets. With their observations KO6 found three new close companions (of HIP 63204, HIP 73937, and HIP 79771) that were unresolved in the survey of KO5.
observations of these 22 stars observed with NACO, including the multi-colour ADONIS observations of 9 targets. With their observations KO6 found three new close companions (of HIP 63204, HIP 73937, and HIP 79771) that were unresolved in the survey of KO5.
For our analysis we consider all 22 targets observed by KO6, all of which are confirmed members of Sco OB2. The 9 ADONIS targets that were also studied in KO6 are not considered here, simply because they were not observed in the campaign of KO6. Around the 22 NACO targets KO6 find 62 secondaries, of which they classify 18 as confirmed companions (c), 11 as possible companions (?), and 33 as background stars (b).
In our analysis we use the data for 15 (out of 18) confirmed companions, and 5 (out of 8) candidate companions. Both HIP 68532 and HIP 69113 have a tight "double companion''. We treat each of these as a single companion, by combining the separation and mass of the individual companions (see Sect. 4.1.1). The targets HIP 67260, HIP 79771, and HIP 81949 all have three (candidate) companions, for which we only include the inner companion in our analysis. We do not include the very faint secondary of HIP 80142, as this is likely a background star. For HIP 81972 we only include the companion HIP 81972-3, which is by far the most massive companion, in our analysis.
The final KO6 dataset used in this paper consists of 22 targets with 18 companions. Note that when this dataset is compared with simulated observations, a discrepancy may be present, as the sample was composed to study candidate companions and background stars with particular properties. In Table A.2 we list the properties of the binaries used for comparison with simulated observations.
A subset of
![]() of the targets in the KO5 sample are observed with NACO by KO6. We model the KO6 sample by randomly drawing 11% of the targets in the simulated KO5 target sample. Note that in reality, the subset was not random (see above); instead, the targets were selected based on the properties of their secondaries. The simulated KO6 observations therefore cannot be directly compared with the results of the KO6 observations. However, they can be used to find the expected number of close and/or faint companions with KO6; companions that could not be found with the KO5 survey.
of the targets in the KO5 sample are observed with NACO by KO6. We model the KO6 sample by randomly drawing 11% of the targets in the simulated KO5 target sample. Note that in reality, the subset was not random (see above); instead, the targets were selected based on the properties of their secondaries. The simulated KO6 observations therefore cannot be directly compared with the results of the KO6 observations. However, they can be used to find the expected number of close and/or faint companions with KO6; companions that could not be found with the KO5 survey.
We use the 50% detection limit from the analysis presented in KO6, and parameterize it with the Strehl ratio (SR) of the observations. The 50% detection limit as a function of ![]() ,
for targets with a different brightness is derived using simulations (Kouwenhoven et al. 2007, Sect. 3). From the observational data we derive a detection limit
,
for targets with a different brightness is derived using simulations (Kouwenhoven et al. 2007, Sect. 3). From the observational data we derive a detection limit
![]() in magnitude, consisting of four line segments:
in magnitude, consisting of four line segments:
Shatsky & Tokovinin (2002) performed an imaging survey for binarity among 115 B type stars in the Sco OB2 region. Their observations were carried out in 2000 with the near-infrared adaptive optics instrument ADONIS at the ESO 3.6 meter telescope on La Silla, Chile.
Their sample is based on the study of Brown & Verschueren (1997); see Sect. 4.5. Among the 115 B-type stars surveyed by SHT, 87 are confirmed members of Sco OB2 according to de Zeeuw et al. (1999). Among the total sample of these 115 stars SHT find 96 secondaries in the angular separation range 0.3''-6.4'', of which they identify 10 as new physical companions.
The authors conclude that the mass ratio distribution fq(q) for B-type stars in Sco OB2 is consistent with
![]() ,
and that random pairing can be excluded.
,
and that random pairing can be excluded.
Near the 87 confirmed members of Sco OB2 targeted by SHT, 80 secondaries are found, of which 61 likely optical and 19 likely physical companions. Of this set of 19 physical companions, we use a subset of 17 for our analysis. The target HD 132200 is probably a physical triple system. As we consider in this paper only single and binary systems, we do not include the widest and faintest component of HD 132200, and retain the component with
![]() and
and
![]() mag. The secondary HD 133937P is incorrectly reported in SHT. For this secondary
mag. The secondary HD 133937P is incorrectly reported in SHT. For this secondary
![]() and
and
![]() mag (N. Shatsky & A. Tokovinin, private communication). Due to its large
mag (N. Shatsky & A. Tokovinin, private communication). Due to its large
![]() value, and as J>13 mag, this secondary is likely a background star. We therefore do not consider HD 133937P in our analysis.
value, and as J>13 mag, this secondary is likely a background star. We therefore do not consider HD 133937P in our analysis.
Several targets were not included in the observed sample of SHT. These targets were known to have close companions and thus not suitable for wavefront sensing. These unobserved targets were included in the analysis of SHT though. Seven of these (HIP 53701, HIP 57851, HIP 62322, HIP 64425, HIP 74117, HIP 76371, and HIP 77840) are confirmed members of Sco OB2. We include these non-observed targets in our analysis, either as single or as a binary system, depending on whether their companions would have been detected with the SHT observing strategy. Technically, the non-inclusion of a set of stars falls under the "observer's choice''. The latter constraint is difficult to model, as it would involve modeling of pre-SHT observations of close binaries, as well as the determination whether or not such a binary is suitable for wavefront sensing. We choose, however, to manually add these stars to the list of observed targets, as the properties of these stars and their companions are well-understood (making detailed models of the observer's choice redundant). Note that non-inclusion of these unobserved stars introduces a small bias, as these stars would have been surveyed by SHT if their companions were unknown at that time. The member stars HIP 57851, HIP 62322, HIP 74117, HIP 76371, and HIP 77840 were reported as visually resolved (C)-binaries in the Hipparcos catalogue. We use the angular separation and magnitude of these components as given in the catalogue, and include the stars in the sample. HIP 64425 is a known triple system (Tokovinin 1997) for which we use the massive inner binary in our analysis. We treat the non-observed star HIP 53701 as a single star, as KO6 have shown that its secondary is a background star.
For the stars observed by SHT, we derive the mass of target and companion star from the ![]() magnitude, using the evolutionary models described in Sect. 3. For the stars that are analysed by SHT, but not observed by these authors (see above), we derive the mass using the V band magnitude and Hipparcos
magnitude, using the evolutionary models described in Sect. 3. For the stars that are analysed by SHT, but not observed by these authors (see above), we derive the mass using the V band magnitude and Hipparcos ![]() magnitude. For each star we adopt the distance given by the Hipparcos parallax and the age of the subgroup of which the target is a member (Table 1).
magnitude. For each star we adopt the distance given by the Hipparcos parallax and the age of the subgroup of which the target is a member (Table 1).
The final dataset from the SHT survey that we use in our analysis of the binary population in Sco OB2 comprises 87 targets with 23 physical companions. The properties of these 23 companions are listed in Table A.3.
We require that all targets are confirmed Hipparcos members of Sco OB2, and so first impose the Hipparcos detection limit on the simulated association. We model the brightness constraint of the SHT observations by adopting a minimum mass of
![]() ,
and a minimum brightness of V=7 mag for the targets.
,
and a minimum brightness of V=7 mag for the targets.
SHT show the typical detection limit of their observations in their Fig. 3. The detection limit is obviously different for the observations with and without the coronograph. The observations with coronograph are deeper, and the observations without the coronograph provide a larger range in angular separation. A companion star is detected if it is observed either in the coronographic mode or in the non-coronographic mode.
In the non-coronographic observations, each companion is assigned a detection probability
![]() as a function of its separation
as a function of its separation ![]() .
In the non-coronographic observations, SHT observed each target twice in the non-coronographic mode, both times with the target in a quadrant of the detector. Due to the square shape of the detector, and due to the observing strategy, the position angle is of importance to whether a companion at separation
.
In the non-coronographic observations, SHT observed each target twice in the non-coronographic mode, both times with the target in a quadrant of the detector. Due to the square shape of the detector, and due to the observing strategy, the position angle is of importance to whether a companion at separation ![]() is in the field-of-view. We model this dependence by assigning a probability
is in the field-of-view. We model this dependence by assigning a probability
![]() that a companion is in the field of view, depending on
that a companion is in the field of view, depending on ![]() .
For a square field-of-view of a detector with linear size L, and a separation K between the two observations (along the diagonal of the field-of-view), the probability is given by
.
For a square field-of-view of a detector with linear size L, and a separation K between the two observations (along the diagonal of the field-of-view), the probability is given by
 |
(12) |
SHT additionally observe each target using the coronograph. They do not perform their coronographic observations in mosaic-mode; only one pointing is used. Each measurement is therefore assigned a detection probability
![]() as a function of angular separation
as a function of angular separation ![]() ,
given by
,
given by
SHT additionally studied the background star population in the Sco OB2 region. Due to the large number of background stars, it is likely that a very faint or red secondary is a background star.
SHT classify a secondary as a background star if J>13 mag, if
![]() mag, or if
mag, or if
![]() mag (unless the secondary is a known companion). In our model for the selection effects, we adopt these limits in magnitude and colour when obtaining the simulated observations.
mag (unless the secondary is a known companion). In our model for the selection effects, we adopt these limits in magnitude and colour when obtaining the simulated observations.
Levato et al. (1987) performed a large radial velocity survey for binarity among early-type stars in the Sco OB2 region. They performed their observations in May 1974 with the 0.9 m and 1.5 m CTIO telescopes, and in 1976 with the 2.1 m telescope at KPNO.
Their sample consists of 81 candidate members of Sco OB2, and is based on that of Slettebak (1968) who composed a list of suspected Sco OB2 members for a study on stellar rotation. All except 4 of the 82 targets of Slettebak (1968), and 3 additional targets were observed by LEV. The spectral type of the observed targets ranges from B0 V to A0 V. The targets in the sample have
![]() .
.
On average, each star is observed over an interval of
![]() year, with a spread of
year, with a spread of
![]() year. Each target is observed 5-12 times, with an average observing interval
year. Each target is observed 5-12 times, with an average observing interval
![]() year and a corresponding spread of
year and a corresponding spread of
![]() year.
For each target LEV list the internal error in the radial velocity measurements. Averaged over all targets, this error is
year.
For each target LEV list the internal error in the radial velocity measurements. Averaged over all targets, this error is
![]() km s-1, with a spread of 1.0 km s-1; approximately 90% of the targets have
km s-1, with a spread of 1.0 km s-1; approximately 90% of the targets have
![]() km s-1.
km s-1.
In their Table 3 LEV list their conclusions on binarity. Of the 53 confirmed members of Sco OB2 that they observed, 14 have a constant radial velocity (within the measurement errors), 23 have a variable radial velocity (RVV), 8 are SB1, and 8 are SB2. Given these observations, the spectroscopic binary fraction is at least
![]() ,
in the case that all RVVs are spurious. If all reported RVV targets are indeed binaries, the observed spectroscopic binary fraction is
,
in the case that all RVVs are spurious. If all reported RVV targets are indeed binaries, the observed spectroscopic binary fraction is
![]() .
The observed spectroscopic binary fraction is a lower limit for FM, as binaries that are unresolved in the survey of LEV (e.g. visual binaries) are not included in these statistics.
.
The observed spectroscopic binary fraction is a lower limit for FM, as binaries that are unresolved in the survey of LEV (e.g. visual binaries) are not included in these statistics.
For the comparison between the observational data and the simulated observations, we only consider the 53 confirmed members (according to de Zeeuw et al. 1999) of Sco OB2 that LEV observed. In their Tables 3 and 4, LEV include the star HIP 76945 (HD 140008), a confirmed member of the UCL subgroup. LEV did not observe this SB2, but take the orbital elements from Thackeray & Hutchings (1965). Our simulations indicate that the radial velocity variability of a binary with properties such as those of HIP 76945 would practically always be detected in a survey similar to that of LEV. It is unclear, however, whether LEV would have been able to derive the orbital elements for this binary, i.e., if they would have detected it as an SB1 or SB2. We include HIP 76945 as an SB2 in the dataset, as Thackeray & Hutchings (1965) were able to derive the orbital elements several decades before the study of LEV. For a subset of the targets LEV derive the orbital elements. In their Table 4, LEV list the elements of 22 targets, of which 16 are confirmed members of Sco OB2. In Table A.4 we list the properties of these 16 SB1 and SB2 systems from the LEV dataset that are confirmed members of Sco OB2. We also list the 23 radial velocity variables (RVVs), for which the orbital elements are unavailable. The LEV dataset consists of 53 targets, of which 16+23= 39 are detected as binary systems.
In this paper we consider only the confirmed Hipparcos members of Sco OB2, i.e., first impose the Hipparcos detection limit on the association. We model the choice of the sample of LEV by removing all binary systems with a combined magnitude fainter than V=8.1 mag from the simulated observations.
We model the instrument bias of LEV using windowed sampling (SB-W; see Kouwenhoven 2006). Briefly summarized; in order to compare the model predictions with the observations, we simulate the detection of the spectroscopic binaries in our models as follows. We obtain radial velocity measurements of all binary systems in the simulated association, at regular intervals ![]() for a time-span T (windowed sampling). We assume a value for the measurement error
for a time-span T (windowed sampling). We assume a value for the measurement error
![]() ,
which is constant over the time of observations. If the radial velocity measurements show a spread significantly larger than the error, the binarity is detected.
For each single star and binary system we test the hypothesis that the observed velocity measurements
,
which is constant over the time of observations. If the radial velocity measurements show a spread significantly larger than the error, the binarity is detected.
For each single star and binary system we test the hypothesis that the observed velocity measurements ![]() result from a constant velocity. We calculate the
result from a constant velocity. We calculate the ![]() of the set of Nv radial velocity measurements:
of the set of Nv radial velocity measurements:
 |
(16) |
 |
(17) |
In our model for the LEV observations we use windowed sampling, adopting an observing run of T=2.74 year, an observing interval
![]() year, and a radial velocity accuracy of
year, and a radial velocity accuracy of
![]() km s-1. The latter assumption is a simplification, as the value of
km s-1. The latter assumption is a simplification, as the value of
![]() is slightly different for each observation in the LEV dataset (with a spread of
is slightly different for each observation in the LEV dataset (with a spread of ![]() km s-1). A star is more easily detected if
km s-1). A star is more easily detected if
![]() km s-1, and less easy if
km s-1, and less easy if
![]() is larger. Our simulations show, however, that our assumption of a constant
is larger. Our simulations show, however, that our assumption of a constant
![]() introduces an error significantly smaller than the error introduced by low-number statistics, justifying our assumption.
introduces an error significantly smaller than the error introduced by low-number statistics, justifying our assumption.
Table 5:
Candidate and confirmed astrometric binaries in the Hipparcos catalogue. For each subgroup we list the number ![]() of known members, the number of stochastic (X); orbital (O); acceleration (G); component (C); and suspected (S) binaries in the Hipparcos catalogue. For each (S) binary we list between brackets how many of these are also (X)-flagged. The last three columns list the "astrometric binary fraction'' - including the (X), (O), (G) binaries - without the (S) binaries and with the (S) binaries included, and the Hipparcos "visual'' binary fraction, for the (C) binaries only. (V) binaries are not present in Sco OB2.
of known members, the number of stochastic (X); orbital (O); acceleration (G); component (C); and suspected (S) binaries in the Hipparcos catalogue. For each (S) binary we list between brackets how many of these are also (X)-flagged. The last three columns list the "astrometric binary fraction'' - including the (X), (O), (G) binaries - without the (S) binaries and with the (S) binaries included, and the Hipparcos "visual'' binary fraction, for the (C) binaries only. (V) binaries are not present in Sco OB2.
Brown & Verschueren (1997) studied stellar rotation among members of the Sco OB2 association. The observations were carried out between 1991 and 1993 using the ECHELEC spectrograph at the ESO 1.52 m telescope on La Silla, Chile. The sample of BRV contains the pre-Hipparcos candidate and established members of Sco OB2, based on the studies of Blaauw (1964), Bertiau (1958), and de Geus et al. (1989).
The observations and data reduction procedure are described in detail in Verschueren et al. (1997), and the results on duplicity are described in Verschueren et al. (1996) and Brown & Verschueren (1997).
Their sample consists of 156 targets in the Sco OB2 region, mostly of spectral type B.
They find that
![]() of the binary systems exhibit a significant radial velocity variation. After combination of their data with those of LEV and those of the Bright Star Catalogue (Hoffleit & Jaschek 1982; Hoffleit et al. 1983), they obtain a binary fraction of 74%.
of the binary systems exhibit a significant radial velocity variation. After combination of their data with those of LEV and those of the Bright Star Catalogue (Hoffleit & Jaschek 1982; Hoffleit et al. 1983), they obtain a binary fraction of 74%.
Among the 156 observed targets there are 71 confirmed members of Sco OB2 (18 in US, 30 in UCL, and 23 in LCC). Among these 71 targets, 7 are SB1, 10 are SB2, 30 are RVV, and 12 have a constant radial velocity (CON). For 12 targets, insufficient measurements are available to make a statement about the radial velocity variation.
Two out of the 30 RVV binaries are known to exhibit radial velocity variation due to line profile variability. HD 120324 is a non-radial pulsator and HD 136298 is a ![]() Cephei variable. For both stars, this is likely the reason that they are classified as RVV. These stars are therefore not considered as binary systems in our analysis.
Cephei variable. For both stars, this is likely the reason that they are classified as RVV. These stars are therefore not considered as binary systems in our analysis.
The final BRV dataset used in our analysis consists of 71 confirmed members. Of these targets, 12 are spectroscopically single, 7 are SB1, 10 are SB2, 28 are RVV, and 12 have insufficient data to determine whether the radial velocity is variable. The binary fraction is thus at least
![]() ,
if none of the RVV and CON targets are binary, and (71-
,
if none of the RVV and CON targets are binary, and (71-
![]() if all RVV and CON targets are binary. Among the target stars with sufficient data to make a statement on duplicity (i.e., without the 12 CON targets included), the observed binary fraction is
if all RVV and CON targets are binary. Among the target stars with sufficient data to make a statement on duplicity (i.e., without the 12 CON targets included), the observed binary fraction is
![]() at least and
at least and
![]() at most.
at most.
We model the choice of the BRV sample in a way similar as we did for the LEV dataset. Each target is observed three times over an interval of T=2.25 year, so that
![]() year. Following the reduction of the original data (Verschueren et al. 1996), we classify each target with a radial velocity variation larger than
year. Following the reduction of the original data (Verschueren et al. 1996), we classify each target with a radial velocity variation larger than
![]() km s-1 as a RVV (see Sect. 4.4.2).
km s-1 as a RVV (see Sect. 4.4.2).
Table 6: A model for the instrument bias of the Hipparcos catalogue, based on the analysis of Lindegren et al. (1997). The binary systems satisfying the above constraints are resolved with Hipparcos in our models. For the comparison between the observations and the simulated observations, we consider two sets of Hipparcos binaries: the visual binaries and the astrometric binaries. No orbital motion is detected for the (C) binaries; these are visually resolved and therefore technically visual binaries. The Hipparcos astrometric binaries contain the targets with (X), (O), (G), and optionally (S) entries. No difference between the latter categories is made for the comparison with the astrometric binaries. Binary systems that do not satisfy the constraints listed in this table remain undetected in our simulated observations for Hipparcos. We do not model the (V)-binaries (variability-induced movers; VIMs) and (S)-binaries (suspected non-single stars). Note that in our model we overpredict the number of binaries in categories (X), (O), and (S), as not all binaries with the properties above are detected by Hipparcos as such.
In the Hipparcos catalogue, the (possible) binary nature of a target is indicated in field H59 with the flags (X), (O), (G), (C), or (V), and in field H61 with the flag (S). For the targets with a (C) flag both stars in the binary system are resolved, but no orbital motion is detected. These systems are considered as visual (or optical) binaries. Hipparcos entries with an (X)-flag have a stochastic solution. These stars exhibit an apparent motion significantly larger than the statistical uncertainties, although no double star solution could be found. For entries with an (O)-flag, at least one of the orbital elements could be derived from the apparent motion. Entries with a (G)-flag show a significant acceleration in the apparent motion, but no solution could be found. These are likely long-period binaries. The (V)-flagged entries are variability-induced movers. For this group of binaries, the photocenter exhibits apparent motion due to variability of one of the components. Finally, (S)-flagged entries are suspected non-single stars. These targets are effectively single as observed by Hipparcos (ESA 1997, Sect. 2.1), although no convincing single-star astrometric model could be fit to the observations. Several of the (S) binaries are also (X)-flagged, indicating that these are likely non-single.
Among the 521 confirmed members of Sco OB2, 46 are candidate or confirmed astrometric binaries - i.e., those in the categories (X), (O), (G), and (S) - in the Hipparcos catalogue: 12 in US, 17 in UCL, and 17 in LCC. An additional 79 Sco OB2 members are classified as (C)-binaries; these are visually resolved binaries. Table 5 lists for the three subgroups of Sco OB2 the number of entries in each of the Hipparcos categories. As for the binaries in the category (C) no orbital motion is detected, we will consider this group as visual binaries. (V)-binaries are not present among the confirmed Sco OB2 members. HIP 78918 is the only member of Sco OB2 with an orbital solution (O). The three (X)-flagged members of Sco OB2 are also flagged as suspected non-single stars (S).
In our analysis we consider each target in the categories (X), (O), (G), and (C) in Table 5 as a binary system. Binarity among the stars in the (S) category (the "suspected non-single'' targets) is rather uncertain. We therefore compare our results with the Hipparcos data, with and without the suspected (S) binaries included.
Note that not all targets in the category (X) are necessarily binary systems. For example, the flag (X) of HIP 80763 (![]() Sco) may be due to the extended nature of the star, which is surrounded by a dust-shell (Cruzalebes et al. 1998). This may induce photocentric motion that is not related to binarity.
Sco) may be due to the extended nature of the star, which is surrounded by a dust-shell (Cruzalebes et al. 1998). This may induce photocentric motion that is not related to binarity.
The observer's choice and sample bias for the Hipparcos member list of Sco OB2 are discussed in Sect. 3.3; our adopted model to describe these biases is given in Eq. (3). The instrument bias for Hipparcos was described in detail in Lindegren et al. (1997) and is summarized in Table 6 (see Kouwenhoven 2006, for further details).
The binaries in category (C) are considered as visual binaries, as both components of such binaries are resolved, while no astrometric motion is detected. The detection of the (C)-binaries is modeled using the prescription in Table 6 and is then compared with the observations.
The binaries in the categories (X), (O), and (G) are considered as astrometric binaries, and are modeled using the prescriptions in Table 6. As we do not model the Hipparcos observations in detail, we are unable to accurately predict in which of these categories each Hipparcos target falls. The simple model that we adopt for the Hipparcos biases results in an overlap between the properties of the stars in these categories, and furthermore, we overpredict the number of stars observed in these categories. Lindegren et al. (1997) have analyzed the properties of the binary systems in each of the categories. But this does not mean that each binary system with these properties is observed as such. In our model we make the latter assumption, resulting in an overestimation of the number of binaries detected by Hipparcos, and an overlap between the modeled categories (O) and (G). We therefore combine the number of detected (X), (O), and (G) binaries in the simulated observations, and use the resulting astrometric binary fraction
![]() as an upper limit for the comparison with the observations.
as an upper limit for the comparison with the observations.
We do not include stellar variability in our model, and are therefore unable to model the (V)-flagged binaries (field H59). We do not model the (S)-flagged binaries (field H61) either, as the determination whether a target is classified as such in the Hipparcos catalogue is based on an internal and external comparison performed by the two Hipparcos data reduction teams.
In this and the following sections we discuss the determination of the binary population in Sco OB2 from observations. We adopt the strategy described in Kouwenhoven (2006). First we derive the pairing function and mass ratio distribution in Sect. 5. We recover the semi-major axis, the period distribution and the binary fraction in Sect. 6, and the eccentricity distribution in Sect. 7. Finally, we present a discussion on the derived binary fraction and its associated error in Sect. 8.
Kouwenhoven (2006) discusses five possible ways of pairing the components of a binary system. These include random pairing (RP), primary-constrained random pairing (PCRP), and three variants of primary-constrained pairing (PCP-I, PCP-II, and PCP-III). For the models with random pairing the primary mass M1 and companion mass M2 are both drawn from the mass distribution. For PCRP both masses are drawn from the mass distribution, with the additional constraint that the companion mass is smaller than that of the primary. In the three PCP pairing models the primary mass is drawn from the mass distribution, and the companion mass is derived from the mass ratio
![]() which is drawn from a distribution fq(q). The difference between the three PCP models lies in the treatment of the very low mass companions that are generated. Each of these five pairing functions result in a different binary population.
Kouwenhoven (2006) has shown that for binary systems with intermediate mass primaries the pairing functions PCP-I, PCP-II, PCP-III practically give the same results. As we focus on intermediate mass binaries in this paper, we will therefore consider three pairing functions in our analysis: RP, PCRP, and PCP (where PCP represents either PCP-I, PCP-II, or PCP-III).
which is drawn from a distribution fq(q). The difference between the three PCP models lies in the treatment of the very low mass companions that are generated. Each of these five pairing functions result in a different binary population.
Kouwenhoven (2006) has shown that for binary systems with intermediate mass primaries the pairing functions PCP-I, PCP-II, PCP-III practically give the same results. As we focus on intermediate mass binaries in this paper, we will therefore consider three pairing functions in our analysis: RP, PCRP, and PCP (where PCP represents either PCP-I, PCP-II, or PCP-III).
As shown by Kouwenhoven (2006) the mass ratio distribution fq(q) resulting from pairing function RP or PCRP depends strongly on the mass distribution fM(M), in particular on the shape of the mass distribution in the brown dwarf regime. The mass distribution for Sco OB2 is fairly well constrained (Eq. (2)), although the exact values of the parameters
![]() and
and ![]() are as yet unknown. However, the mass distribution can still be used to rule out pairing functions RP and PCRP for Sco OB2, by considering the extreme values for
are as yet unknown. However, the mass distribution can still be used to rule out pairing functions RP and PCRP for Sco OB2, by considering the extreme values for
![]() and
and ![]() .
.
Shatsky & Tokovinin (2002) and Kouwenhoven et al. (2005) have already shown that their observed mass ratio distribution is inconsistent with random pairing (RP). Below we show that both pairing functions RP and PCRP can be excluded based on their observations. The two free parameters in the mass distribution of Sco OB2 (Eq. (2)) are in the range
![]() and
and
![]() .
The shape of the resulting mass ratio distribution for these pairing functions depends on the exact values of
.
The shape of the resulting mass ratio distribution for these pairing functions depends on the exact values of
![]() and
and ![]() .
Below we will show that even for the "most favourable'' values of
.
Below we will show that even for the "most favourable'' values of
![]() and
and ![]() both RP and PCRP can be excluded.
both RP and PCRP can be excluded.
The mass distribution in Eq. (2) results in a large number of low-mass stars. The probability to obtain a binary consisting of two intermediate or high-mass stars is small (e.g. Kouwenhoven 2006). We use this property of pairing functions RP and PCRP to show that these are inconsistent with the observations. Let Q denote the ratio between the number of binaries with mass ratio
![]() and the number of targets
and the number of targets
![]() :
:
 |
(18) |
![\begin{figure}
\par\includegraphics[width=5.1cm,clip]{7719f5a.ps}\hspace*{3mm}
...
...b.ps}\hspace*{3mm}
\includegraphics[width=4.8cm,clip]{7719f5c.ps}
\end{figure}](/articles/aa/full/2007/40/aa7719-07/img254.gif) |
Figure 5:
How well can the intermediate-mass binary population in Sco OB2 be described by a mass ratio distribution of the form
|
| Open with DEXTER | |
We simulate two associations with the latter properties (one with pairing function RP and one with PCRP) and extract the sample of KO5 using the constraints listed in Table 4. The resulting intrinsic values of Q for the KO5 sample are
![]() .
These values are upper limits because of the adopted values for
.
These values are upper limits because of the adopted values for
![]() ,
,
![]() ,
and FM. Also, the corresponding observed values
,
and FM. Also, the corresponding observed values ![]() of the simulated observations are significantly smaller due to the non-detection of very close and wide binaries, binaries with a high mass ratio, etc.
of the simulated observations are significantly smaller due to the non-detection of very close and wide binaries, binaries with a high mass ratio, etc.
Among the 199 targets in the KO5 sample, 10 binary systems with
![]() are detected. The observed fraction of binaries with q>0.8 is therefore
are detected. The observed fraction of binaries with q>0.8 is therefore
![]() .
Due to selection effects KO5 have certainly missed several binaries with q>0.8 at separations smaller than the spatial resolution, or outside the field of view, so that the true value is
.
Due to selection effects KO5 have certainly missed several binaries with q>0.8 at separations smaller than the spatial resolution, or outside the field of view, so that the true value is
![]() .
As
.
As
![]() and
and
![]() ,
both pairing functions RP and PCRP can thus be excluded with strong confidence.
,
both pairing functions RP and PCRP can thus be excluded with strong confidence.
The observations are consistent with pairing function PCP, which is characterized by a mass ratio distribution fq(q). The unknown slope ![]() and the value
and the value ![]() for the mass distribution (Eq. (2)) are now irrelevant, as the distribution over companion masses among intermediate mass stars is independent of
for the mass distribution (Eq. (2)) are now irrelevant, as the distribution over companion masses among intermediate mass stars is independent of ![]() .
The mass ratio distribution and binary fraction for high-mass and intermediate mass targets is the same for the three pairing functions (Kouwenhoven 2006). As we do not have detailed information on binarity among low-mass stars in Sco OB2, we cannot discriminate between PCP-I, PCP-II, and PCP-III. A detailed membership study for low-mass stars in Sco OB2, followed by a detailed binary study, is necessary to establish the difference. Kouwenhoven (2006) also shows that for the three PCP pairing functions the mass ratio distribution for binaries with a high-mass primary is approximately equal to the generating mass ratio distribution fq(q) of an association.
.
The mass ratio distribution and binary fraction for high-mass and intermediate mass targets is the same for the three pairing functions (Kouwenhoven 2006). As we do not have detailed information on binarity among low-mass stars in Sco OB2, we cannot discriminate between PCP-I, PCP-II, and PCP-III. A detailed membership study for low-mass stars in Sco OB2, followed by a detailed binary study, is necessary to establish the difference. Kouwenhoven (2006) also shows that for the three PCP pairing functions the mass ratio distribution for binaries with a high-mass primary is approximately equal to the generating mass ratio distribution fq(q) of an association.
The mass ratio distribution among intermediate mass stars in Sco OB2 was obtained by both KO5 and SHT. SHT find a mass ratio distribution of the form
![]() with
with
![]() in their B star survey, and KO5 find
in their B star survey, and KO5 find
![]() in their A and late-B star survey.
Subsequently, we adopt a mass ratio distribution of the form
in their A and late-B star survey.
Subsequently, we adopt a mass ratio distribution of the form
![]() and study for which value of
and study for which value of ![]() the simulated observations correspond best to the observations of KO5 and SHT. We compare the observed mass ratio distribution
the simulated observations correspond best to the observations of KO5 and SHT. We compare the observed mass ratio distribution
![]() with that of the simulated observations using the Kolmogorov-Smirnov (KS) test, and we compare the observed binary fraction
with that of the simulated observations using the Kolmogorov-Smirnov (KS) test, and we compare the observed binary fraction
![]() with the predictions using the Pearson
with the predictions using the Pearson ![]() test. In both cases, we test the hypothesis that the observations and simulated observations are realizations of the same underlying association model.
All models have a semi-major axis distribution of the form
test. In both cases, we test the hypothesis that the observations and simulated observations are realizations of the same underlying association model.
All models have a semi-major axis distribution of the form
![]() with
with
![]() (see Sects. 6.1, 6.2, and 6.5, for a motivation) and a thermal eccentricity distribution
fe(e) = 2e with
(see Sects. 6.1, 6.2, and 6.5, for a motivation) and a thermal eccentricity distribution
fe(e) = 2e with
![]() (see Sect. 7, for a motivation). We perform our simulations with different intrinsic binary fractions, ranging from
(see Sect. 7, for a motivation). We perform our simulations with different intrinsic binary fractions, ranging from
![]() to
to ![]() .
.
Figure 5 shows the results of this comparison for models with a varying value of ![]() and a varying intrinsic binary fraction FM.
The left-hand panel shows the probability associated with the KS comparison between the observed
and a varying intrinsic binary fraction FM.
The left-hand panel shows the probability associated with the KS comparison between the observed
![]() and that of the simulated observations. A small value for the goodness-of-fit means that the model can be excluded with high confidence. The three horizontal dotted lines indicate the
and that of the simulated observations. A small value for the goodness-of-fit means that the model can be excluded with high confidence. The three horizontal dotted lines indicate the ![]() ,
,
![]() and
and ![]() confidence limits for rejection of the model, respectively. Models outsize the range
confidence limits for rejection of the model, respectively. Models outsize the range
![]() can be rejected with
can be rejected with ![]() confidence. The best-fitting models have
confidence. The best-fitting models have
![]() (vertical dotted line), which is the value we adopt for Sco OB2. However,
(vertical dotted line), which is the value we adopt for Sco OB2. However, ![]() is also constrained using the additional information provided by the observed visual and spectroscopic binary fraction.
is also constrained using the additional information provided by the observed visual and spectroscopic binary fraction.
The middle panel of Fig. 5 indicates how well the observed visual binary fraction for Sco OB2 compares with the predictions of the models with different values of ![]() and FM. Models with a small value of
and FM. Models with a small value of ![]() underpredict
underpredict
![]() .
Most binaries have a small mass ratio in this case, making it more difficult to detect the companion star, and hence resulting in a lower visual binary fraction. Models with a
.
Most binaries have a small mass ratio in this case, making it more difficult to detect the companion star, and hence resulting in a lower visual binary fraction. Models with a
![]() can be excluded with
can be excluded with ![]() confidence or more, for any value of
confidence or more, for any value of
![]() (under the condition that our assumptions hold).
(under the condition that our assumptions hold).
The right-hand panel of Fig. 5 shows the predicted spectroscopic binary fraction as a function of ![]() and FM. Note that, unlike the middle panel of Fig. 5, we do not show the goodness-of-fit between the observed and predicted spectroscopic binary fraction, as we only have lower and upper limits of the former (see below).
More spectroscopic binaries are detected for models with a large
and FM. Note that, unlike the middle panel of Fig. 5, we do not show the goodness-of-fit between the observed and predicted spectroscopic binary fraction, as we only have lower and upper limits of the former (see below).
More spectroscopic binaries are detected for models with a large ![]() ,
as the radial velocity amplitude increases with higher companion mass. The horizontal dotted lines in this panel indicate the limits for the observed spectroscopic binary fraction:
,
as the radial velocity amplitude increases with higher companion mass. The horizontal dotted lines in this panel indicate the limits for the observed spectroscopic binary fraction:
![]() (with likely
(with likely
![]() ). For models with
). For models with
![]() ,
the models with an intrinsic binary fraction
,
the models with an intrinsic binary fraction
![]() are most consistent with the observations. Note that the spectroscopic binary fraction as predicted by the models is rather small as compared to the observed spectroscopic binary fraction, even for an intrinsic binary fraction
are most consistent with the observations. Note that the spectroscopic binary fraction as predicted by the models is rather small as compared to the observed spectroscopic binary fraction, even for an intrinsic binary fraction
![]() .
This apparent underprediction is also present in the following sections, where we study different semi-major axis and period distribution, and may result from the presence of triple and higher-order systems among the members of Sco OB2. In Sect. 10.1 we will return to this issue.
.
This apparent underprediction is also present in the following sections, where we study different semi-major axis and period distribution, and may result from the presence of triple and higher-order systems among the members of Sco OB2. In Sect. 10.1 we will return to this issue.
A good model for Sco OB2 should correctly predict
![]() ,
the visual binary fraction and spectroscopic binary fraction. The distribution
,
the visual binary fraction and spectroscopic binary fraction. The distribution
![]() suggests that
suggests that
![]() ,
with a best-fit for
,
with a best-fit for
![]() ,
while the observed binary fractions are best fitted by models with a large value of
,
while the observed binary fractions are best fitted by models with a large value of ![]() .
A combination of these data is not trivial, as it involves a choice for the relative weights given to each of the goodness-of-fits for each quantity. For example, if
.
A combination of these data is not trivial, as it involves a choice for the relative weights given to each of the goodness-of-fits for each quantity. For example, if
![]() and the visual binary fraction are given equal weight, the combined best-fitting value is
and the visual binary fraction are given equal weight, the combined best-fitting value is
![]() ,
while if
,
while if
![]() is a ten times heavier weight, the combined best-fitting value is
is a ten times heavier weight, the combined best-fitting value is
![]() .
Inclusion of the spectroscopic binary fraction is not trivial, as we only have lower and upper limits for this quantity. An inspection of the three panels suggets that the mass ratio distribution can be well described by the expression
.
Inclusion of the spectroscopic binary fraction is not trivial, as we only have lower and upper limits for this quantity. An inspection of the three panels suggets that the mass ratio distribution can be well described by the expression
![]() with
with
![]() .
This value is bracketed by, and consistent with the values derived by KO5 and SHT. The comparison further indicates that the intrinsic binary fraction is larger than
.
This value is bracketed by, and consistent with the values derived by KO5 and SHT. The comparison further indicates that the intrinsic binary fraction is larger than ![]() 95%, with
95%, with ![]() confidence.
confidence.
The orbital size distribution of a binary population can be quantified in several ways. Observers of visual binaries often express their results with a semi-major axis distribution fa(a), derived from the observed angular separation distribution. Observers of spectroscopic binary systems on the other hand, often express their results with an orbital period distribution fP(P), as the period of a spectroscopic binary can often be measured directly. Authors of theoretical/simulation papers mostly describe the orbital size distribution using the orbital energies (e.g. in units of kT). Over the past several decades, observational studies have brought forward two widely accepted distributions: a flat distribution in logarithmic semi-major axis, and a log-normal period distribution. In the this section we compare these distributions with the observations. We wish to stress that the discussion of fa(a) and fP(P) should nowhere be taken to imply that a power-law distribution in a would result in a log-normal distribution in P.
The flat distribution in ![]() ,
commonly known as Öpik's law, has been derived for a wide range of stellar populations (e.g., van Albada 1968; Öpik 1924; Poveda & Allen 2004; Vereshchagin et al. 1988), and is equivalent to
,
commonly known as Öpik's law, has been derived for a wide range of stellar populations (e.g., van Albada 1968; Öpik 1924; Poveda & Allen 2004; Vereshchagin et al. 1988), and is equivalent to
 |
(20) |
Duquennoy & Mayor (1991) studied binarity among solar-type stars in the solar neighbourhood and find a log-normal period distribution:
 |
(22) |
Table 7:
The five known binaries in Sco OB2 with an orbital period less than two days. Columns 1-3 list the primary star, the primary spectral type, and the measured orbital period. Columns 4 and 5 list the primary mass estimate as derived from the V-band magnitude, under the assumption that the mass ratio is ![]() and q=1, respectively. Columns 6 and 7 list extremes for the semi-major axis of the binary, as derived using Kepler's third law, under the assumption of a mass ratio
and q=1, respectively. Columns 6 and 7 list extremes for the semi-major axis of the binary, as derived using Kepler's third law, under the assumption of a mass ratio ![]() (6th column), and q=1 (7th column). Finally, Cols. 8 and 9 list the subgroup of which the binary is a member and the reference for the orbital period. It is possible that a small number of closer, yet undiscovered binaries exist in Sco OB2.
(6th column), and q=1 (7th column). Finally, Cols. 8 and 9 list the subgroup of which the binary is a member and the reference for the orbital period. It is possible that a small number of closer, yet undiscovered binaries exist in Sco OB2.
In our binarity dataset for Sco OB2, most information on the orbital size distribution is provided by the observed angular separation distribution
![]() ,
the observed visual binary fraction and the observed spectroscopic binary fraction. The latter two parameters are additionally linearly dependent on the intrinsic binary fraction FM of Sco OB2, so we derive FM simultaneously.
,
the observed visual binary fraction and the observed spectroscopic binary fraction. The latter two parameters are additionally linearly dependent on the intrinsic binary fraction FM of Sco OB2, so we derive FM simultaneously.
For the comparison of the observed angular separation distribution
![]() we use the angular separation measurements of the combined observations of the KO5 and SHT datasets (see Sects. 4.1 and 4.3). The observed (visual) binary fraction
we use the angular separation measurements of the combined observations of the KO5 and SHT datasets (see Sects. 4.1 and 4.3). The observed (visual) binary fraction
![]() is
is ![]() for the KO5 dataset and
for the KO5 dataset and ![]() for the SHT dataset. The visual binary fraction for the combined KO5/SHT dataset is
for the SHT dataset. The visual binary fraction for the combined KO5/SHT dataset is
![]() (taking into account the 23 targets that appear in both datasets, and their companions). We will use the latter value for comparison with the simulated observations.
For the comparison between the observed spectroscopic binary fraction and the predictions we use the observations of LEV. The LEV sample (see Sect. 4.4) consists of 53 confirmed members of Sco OB2. Among these targets there are 8 SB1s, 8 SB2s, 23 RVVs, and 14 targets with a constant radial velocity (within the measurement errors). For the 23 RVVs it is unknown whether these are truly binary systems, as the radial velocity variations may also result from line profile variability. The true value for the observed spectroscopic binary fraction in the LEV dataset is thus in the range between
(taking into account the 23 targets that appear in both datasets, and their companions). We will use the latter value for comparison with the simulated observations.
For the comparison between the observed spectroscopic binary fraction and the predictions we use the observations of LEV. The LEV sample (see Sect. 4.4) consists of 53 confirmed members of Sco OB2. Among these targets there are 8 SB1s, 8 SB2s, 23 RVVs, and 14 targets with a constant radial velocity (within the measurement errors). For the 23 RVVs it is unknown whether these are truly binary systems, as the radial velocity variations may also result from line profile variability. The true value for the observed spectroscopic binary fraction in the LEV dataset is thus in the range between
![]() and
and
![]() ,
depending on how many of the RVVs are true binary systems. Note that it is unlikely that the majority of the observed RVVs are spurious binaries; the true spectroscopic binary fraction is likely close to 74%.
,
depending on how many of the RVVs are true binary systems. Note that it is unlikely that the majority of the observed RVVs are spurious binaries; the true spectroscopic binary fraction is likely close to 74%.
In this section we recover the orbital size distribution of binaries in Sco OB2, which can be described with either fa(a) or fP(P). We simultaneously determine the intrinsic binary fraction FM. We determine the lower limits
![]() and
and
![]() in Sect. 6.1 and the upper limits
in Sect. 6.1 and the upper limits
![]() and
and
![]() in Sect. 6.2.
The best-fitting (power-law) semi-major axis distribution is discussed in Sect. 6.3, and the best-fitting (log-normal) period distribution in Sect. 6.4. A further discussion on the validity of the independent derivation of the orbital size distribution and fq(q) is presented in Sect. 6.5. Finally, we summarize our conclusions on the orbital size distribution and FM in Sect. 6.6.
in Sect. 6.2.
The best-fitting (power-law) semi-major axis distribution is discussed in Sect. 6.3, and the best-fitting (log-normal) period distribution in Sect. 6.4. A further discussion on the validity of the independent derivation of the orbital size distribution and fq(q) is presented in Sect. 6.5. Finally, we summarize our conclusions on the orbital size distribution and FM in Sect. 6.6.
The shortest period
![]() can in principle be constrained using observations of spectroscopic binaries. Table 7 lists the five known binaries in Sco OB2 with an orbital period less than two days. These data indicate that the minimum period
can in principle be constrained using observations of spectroscopic binaries. Table 7 lists the five known binaries in Sco OB2 with an orbital period less than two days. These data indicate that the minimum period
![]() is less than of order one day. Binary systems with an orbital period shorter than one day may be present in Sco OB2, but this orbital period is close to the physical minimum period, leading to Roche Lobe overflow. Only a very small fraction of systems is expected to have such a short orbital period, as stars in such binaries would have been in physical contact during their contraction phase.
is less than of order one day. Binary systems with an orbital period shorter than one day may be present in Sco OB2, but this orbital period is close to the physical minimum period, leading to Roche Lobe overflow. Only a very small fraction of systems is expected to have such a short orbital period, as stars in such binaries would have been in physical contact during their contraction phase.
For each short-period binary in Table 7 we have obtained an estimate for the semi-major axis, using Kepler's third law. We derive the absolute V-band magnitude from the observed V-band magnitude using the improved Hipparcos parallax and interstellar extinction for each star (de Bruijne 1999). We estimate a lower and upper mass limit for the primary star, assuming that the mass ratio is either ![]() or q=1.
As the mass ratio of each of these binaries is unknown, we show the corresponding inferred semi-major axis for the extremes
or q=1.
As the mass ratio of each of these binaries is unknown, we show the corresponding inferred semi-major axis for the extremes ![]() and q=1. As the five short-period binary systems are all spectroscopic binaries, the value of the mass ratio is likely
and q=1. As the five short-period binary systems are all spectroscopic binaries, the value of the mass ratio is likely ![]() .
From the semi-major axis estimates in Table 7 we thus conclude that
.
From the semi-major axis estimates in Table 7 we thus conclude that
![]() must be of order
must be of order
![]() or smaller.
or smaller.
As a result of selection effects, the observations cannot be used to constrain
![]() and
and
![]() any further. However, physical arguments can be used to obtain estimates for the lower limits for
any further. However, physical arguments can be used to obtain estimates for the lower limits for
![]() and
and
![]() .
The value of
.
The value of
![]() cannot be significantly smaller than the semi-major axis at which Roche lobe overflow occurs for one of the components of a binary system. One of the components of such a tight binary may fill its Roche Lobe if the binary separation a is less than about 2-3 times the radius of that star (see, e.g., Hilditch 2001; Eggleton 1983). Assuming zero eccentricity, the estimates for
cannot be significantly smaller than the semi-major axis at which Roche lobe overflow occurs for one of the components of a binary system. One of the components of such a tight binary may fill its Roche Lobe if the binary separation a is less than about 2-3 times the radius of that star (see, e.g., Hilditch 2001; Eggleton 1983). Assuming zero eccentricity, the estimates for
![]() are of order 12, 4.0, 2.5 and
are of order 12, 4.0, 2.5 and
![]() for binaries with a primary of spectral type B0 V, A0 V, F0 V and G0 V, respectively. Adopting a typical mass ratio of
for binaries with a primary of spectral type B0 V, A0 V, F0 V and G0 V, respectively. Adopting a typical mass ratio of
![]() ,
these correspond to minimum orbital periods of
,
these correspond to minimum orbital periods of
![]() ,
11, 8, and 6 h, respectively. In reality the latter values are larger due to the presence of eccentric binary systems in Sco OB2. A combination of these estimates indicates that
,
11, 8, and 6 h, respectively. In reality the latter values are larger due to the presence of eccentric binary systems in Sco OB2. A combination of these estimates indicates that
![]() and
and
![]() h. Binary systems with shorter orbital periods are known (see Sect. 2). Although several members of Sco OB2 may have evolved into such a tight systems (with
h. Binary systems with shorter orbital periods are known (see Sect. 2). Although several members of Sco OB2 may have evolved into such a tight systems (with ![]() h), our conclusions on the primordial binary population will not be affected by this assumption. If these binaries are present, our inferred binary fraction (Sect. 8) may be mildly underestimated.
h), our conclusions on the primordial binary population will not be affected by this assumption. If these binaries are present, our inferred binary fraction (Sect. 8) may be mildly underestimated.
Table 8:
The widest known binary systems in Sco OB2. For each of these binary systems we list the angular separation, the Hipparcos parallax, an estimate for the semi-major axis
![]() ,
the subgroup, and the spectral type of the primary. The last column lists the reference. Note that this list must be incomplete, as very wide binaries are difficult to detect. Furthermore, several of these binaries may be optical due to confusion with background stars, i.e., not physically bound. References: (1) Lindroos (1985); (2) Worley (1978); (3) Worley & Douglass (1997); (4) Oblak (1978); (5) Tokovinin (1997).
,
the subgroup, and the spectral type of the primary. The last column lists the reference. Note that this list must be incomplete, as very wide binaries are difficult to detect. Furthermore, several of these binaries may be optical due to confusion with background stars, i.e., not physically bound. References: (1) Lindroos (1985); (2) Worley (1978); (3) Worley & Douglass (1997); (4) Oblak (1978); (5) Tokovinin (1997).
Using observations and physical limitations, we have constrained the values
![]() and
and
![]() day. Note that these are rather rough constraints. In Sect. 8 we will return to this issue when deriving the binary fraction of Sco OB2.
day. Note that these are rather rough constraints. In Sect. 8 we will return to this issue when deriving the binary fraction of Sco OB2.
![\begin{figure}
\par\includegraphics[width=5cm,clip]{7719f6a.ps}\hspace*{4mm}
\i...
...b.ps}\hspace*{4mm}
\includegraphics[width=4.6cm,clip]{7719f6c.ps}
\end{figure}](/articles/aa/full/2007/40/aa7719-07/img316.gif) |
Figure 6:
How well can the intermediate-mass binary population in Sco OB2 be described by a semi-major axis distribution of the form
|
| Open with DEXTER | |
It is difficult to characterize the properties of the widest orbits from observations due to confusion with background stars. However, observations of the widest binaries can be used to derive a lower limit for the maximum semi-major axis
![]() .
Table 8 lists the known binaries in Sco OB2 with angular separation larger than 25''. Under the assumption that these wide binary systems are all physically bound, we additionally list a first-order estimate for the semi-major axis
.
Table 8 lists the known binaries in Sco OB2 with angular separation larger than 25''. Under the assumption that these wide binary systems are all physically bound, we additionally list a first-order estimate for the semi-major axis
![]() ,
where D is the distance to the binary, and
,
where D is the distance to the binary, and ![]() the angular separation. Table 8 shows that the maximum semi-major axis is of order
the angular separation. Table 8 shows that the maximum semi-major axis is of order
![]() or larger. Using Kepler's third law we find that the orbital period of the binary systems listed in Table 8 is in the range between
or larger. Using Kepler's third law we find that the orbital period of the binary systems listed in Table 8 is in the range between
![]() Myr and
Myr and
![]() Myr (assuming a system mass of
Myr (assuming a system mass of
![]() for each binary listed in Table 8).
for each binary listed in Table 8).
A theoretical limit to the maximum semi-major axis
![]() is obtained from the argument of tidal disruption of
binary systems. In the Galactic field the maximum observed semi-major axis is of
the order of
is obtained from the argument of tidal disruption of
binary systems. In the Galactic field the maximum observed semi-major axis is of
the order of
![]() pc (
pc (
![]()
![]() Chanamé & Gould 2004; Bahcall et al. 1985; Close et al. 1990). The analysis of Close et al. (1990)
shows that
Chanamé & Gould 2004; Bahcall et al. 1985; Close et al. 1990). The analysis of Close et al. (1990)
shows that
![]() of the Galactic disk binaries has a separation larger than 0.01 pc
(
of the Galactic disk binaries has a separation larger than 0.01 pc
(
![]()
![]() ). Binaries in the Galactic halo could be as wide as 1 pc due to the lower ambient stellar density (Chanamé & Gould 2004). The results of the wide binary searches and dynamical simulations above indicate that binary systems with a semi-major axis larger than a certain value
). Binaries in the Galactic halo could be as wide as 1 pc due to the lower ambient stellar density (Chanamé & Gould 2004). The results of the wide binary searches and dynamical simulations above indicate that binary systems with a semi-major axis larger than a certain value
![]() are unstable in the Galactic tidal field and are ionized quickly, and that
are unstable in the Galactic tidal field and are ionized quickly, and that
![]() pc (=
pc (=
![]() )
.
)
.
OB associations are expanding groups and are likely unbound (Brown et al. 1999; Blaauw 1964), so that they will dissolve in the field star population within a few tens of Myr. If Sco OB2 is indeed an expanding association, the association must have been denser in the past. The upper limit for the semi-major axis may therefore be smaller than
![]() .
For binary systems with a total mass of
.
For binary systems with a total mass of
![]() ,
this tidal limit corresponds to
,
this tidal limit corresponds to ![]() Myr. Note that if such a binary system would exist in Upper Scorpius, it would have completed only one revolution since its birth. For lower-mass binaries, the period corresponding to a=0.2 pc would be significantly larger.
Myr. Note that if such a binary system would exist in Upper Scorpius, it would have completed only one revolution since its birth. For lower-mass binaries, the period corresponding to a=0.2 pc would be significantly larger.
The goal of our study is to find the primordial binary population, so that theories on star formation can be constrained with observations. For our purpose the exact value of
![]() is not a parameter of crucial importance. Binary systems with a semi-major axis of order a=0.2 pc have an orbital period larger than
is not a parameter of crucial importance. Binary systems with a semi-major axis of order a=0.2 pc have an orbital period larger than ![]() Myr. In the context of star formation, the components of these wide binaries may possibly be considered as single, as both stars may have formed practically independent from each other.
Myr. In the context of star formation, the components of these wide binaries may possibly be considered as single, as both stars may have formed practically independent from each other.
Combining the information above, we have constrained
![]() ,
or alternatively
,
or alternatively
![]() .
In Sect. 8 we will return to this issue when deriving the binary fraction of Sco OB2.
.
In Sect. 8 we will return to this issue when deriving the binary fraction of Sco OB2.
Now that the lower and upper limits for the semi-major axis and period distributions are constrained, it is possible to evaluate these distributions.
We first study the possibility that the binary population is characterized by a semi-major axis distribution of the form
![]() ,
and determine for which value of
,
and determine for which value of ![]() the simulated observations correspond best to the observations. We compare the observed angular separation distribution
the simulated observations correspond best to the observations. We compare the observed angular separation distribution
![]() with that of the simulated observations using the KS test, and we compare the observed visual and spectroscopic binary fractions with the predictions using the Pearson
with that of the simulated observations using the KS test, and we compare the observed visual and spectroscopic binary fractions with the predictions using the Pearson ![]() test. In both cases, we test the hypothesis that the observations and simulations are realizations of the same underlying association model. In our models we adopt semi-major axis limits
test. In both cases, we test the hypothesis that the observations and simulations are realizations of the same underlying association model. In our models we adopt semi-major axis limits
![]() ,
a thermal eccentricity distribution
fe(e) = 2e and a mass ratio distribution of the form
,
a thermal eccentricity distribution
fe(e) = 2e and a mass ratio distribution of the form
![]() with
with
![]() .
Later in this paper we will discuss the validity of these assumptions.
.
Later in this paper we will discuss the validity of these assumptions.
Figure 6 shows the results of this comparison for models with a varying value of ![]() .
The left-hand panel shows the probability associated with the KS test when comparing the observed
.
The left-hand panel shows the probability associated with the KS test when comparing the observed
![]() and that of the simulated observations. The models with
and that of the simulated observations. The models with
![]() produce an observed angular separation distribution very similar to that of KO5/SHT, and consequently have a large goodness-of-fit value.
produce an observed angular separation distribution very similar to that of KO5/SHT, and consequently have a large goodness-of-fit value.
The middle panel shows the probability associated with the Pearson ![]() test when comparing the observed visual binary fraction
test when comparing the observed visual binary fraction
![]() and that of the simulated observations for models as a function of
and that of the simulated observations for models as a function of ![]() with varying intrinsic binary fraction FM. Models with
with varying intrinsic binary fraction FM. Models with
![]() produce a visual binary fraction similar to that of the observations, but only if the intrinsic binary fraction is close to 100%.
produce a visual binary fraction similar to that of the observations, but only if the intrinsic binary fraction is close to 100%.
The right-hand panel shows the predicted spectroscopic binary fraction (SB1, SB2 and RVV) as a function of ![]() and FM. Note that, unlike the middle panel of Fig. 6, we do not show the goodness-of-fit between for the observed and predicted spectroscopic binary fraction, as we only have lower and upper limits of the former (see below). The two horizontal dotted lines in the right-hand panel indicate the lower limit of
and FM. Note that, unlike the middle panel of Fig. 6, we do not show the goodness-of-fit between for the observed and predicted spectroscopic binary fraction, as we only have lower and upper limits of the former (see below). The two horizontal dotted lines in the right-hand panel indicate the lower limit of ![]() (SB1 and SB2) and the "upper limit'' of
(SB1 and SB2) and the "upper limit'' of ![]() (SB1, SB2 and RVV) for the observed spectroscopic binary fraction
(SB1, SB2 and RVV) for the observed spectroscopic binary fraction
![]() .
The spectroscopic binary fraction increases with decreasing
.
The spectroscopic binary fraction increases with decreasing ![]() ,
as the average orbital separation decreases. Models with
,
as the average orbital separation decreases. Models with
![]() result in a spectroscopic binary fraction that is compatible with the observations. For models with
result in a spectroscopic binary fraction that is compatible with the observations. For models with
![]() ,
an intrinsic binary fraction very close to 100% is required in order to reproduce the lower limit for the observed spectroscopic binary fraction.
,
an intrinsic binary fraction very close to 100% is required in order to reproduce the lower limit for the observed spectroscopic binary fraction.
Considering the results in all three panels of Fig. 6, we find that the semi-major axis distribution for intermediate mass stars in Sco OB2 is best described by
![]() with
with
![]() .
The observations are therefore reasonably consistent with models with Öpik's law (
.
The observations are therefore reasonably consistent with models with Öpik's law (
![]() ). Models with slightly smaller values of
). Models with slightly smaller values of ![]() correspond somewhat better to
correspond somewhat better to
![]() and the spectroscopic binary fraction, while those with slightly larger values of
and the spectroscopic binary fraction, while those with slightly larger values of ![]() correspond better to the observed visual binary fraction. The observed visual and spectroscopic binary fractions are only reproduced by models with an intrinsic binary fraction close to
correspond better to the observed visual binary fraction. The observed visual and spectroscopic binary fractions are only reproduced by models with an intrinsic binary fraction close to ![]() .
.
![\begin{figure}
\par\includegraphics[width=5.5cm,clip]{7719f7.ps}
\end{figure}](/articles/aa/full/2007/40/aa7719-07/img338.gif) |
Figure 7:
How well does a model with a log-normal period distribution
|
| Open with DEXTER | |
We also study the possibility that the binary population can be described with a log-normal period distribution (Eq. (21)) for a certain combination of ![]() and
and ![]() .
We simulate associations with period distribution
.
We simulate associations with period distribution
![]() for various values of
for various values of ![]() and
and ![]() ,
and compare simulated observations with the real observations. Again, we consider the observed angular separation distribution
,
and compare simulated observations with the real observations. Again, we consider the observed angular separation distribution
![]() ,
the observed visual binary fraction and the observed spectroscopic binary fraction. The best-fitting log-normal distribution is obtained by combining the results in Figs. 7 and 8, which we describe below.
,
the observed visual binary fraction and the observed spectroscopic binary fraction. The best-fitting log-normal distribution is obtained by combining the results in Figs. 7 and 8, which we describe below.
In Fig. 7 we compare the observed angular separation distribution
![]() for models with varying values of
for models with varying values of ![]() and
and ![]() .
The darkest regions in the figure indicate the best-fitting combinations of
.
The darkest regions in the figure indicate the best-fitting combinations of ![]() and
and ![]() .
In general, the models with a large value for
.
In general, the models with a large value for ![]() fit the observations well. These models have a very broad period distribution, resulting in a fa(a) that is very similar to Öpik's law, which was shown to be consistent with the observations in Sect. 6.3. Models with a period distribution similar to that found by Duquennoy & Mayor (1991), i.e.,
fit the observations well. These models have a very broad period distribution, resulting in a fa(a) that is very similar to Öpik's law, which was shown to be consistent with the observations in Sect. 6.3. Models with a period distribution similar to that found by Duquennoy & Mayor (1991), i.e.,
![]() and
and
![]() are consistent with
are consistent with
![]() as well. Models with
as well. Models with
![]() are consistent with the observed distribution
are consistent with the observed distribution
![]() ,
as for these models the peak of
,
as for these models the peak of ![]() falls in the visual binary regime. This results in an angular separation distribution similar to Öpik's law.
Figure 7 shows that most models with a large value of
falls in the visual binary regime. This results in an angular separation distribution similar to Öpik's law.
Figure 7 shows that most models with a large value of ![]() are consistent with the observed angular separation distribution. These models resemble those with Öpik's law, which was shown to be consistent with the observations in the previous section. Of the models with a large
are consistent with the observed angular separation distribution. These models resemble those with Öpik's law, which was shown to be consistent with the observations in the previous section. Of the models with a large ![]() ,
only those with extremely wide binary populations (
,
only those with extremely wide binary populations (![]() )
produce an incompatible
)
produce an incompatible
![]() ,
as only the tail of the distribution then falls in the visual regime.
,
as only the tail of the distribution then falls in the visual regime.
![\begin{figure}
\par\includegraphics[width=16.2cm,clip]{7719f8a.ps}\par\includegraphics[width=16.2cm,clip]{7719f8b.ps}
\end{figure}](/articles/aa/full/2007/40/aa7719-07/img343.gif) |
Figure 8:
How well does a log-normal period distribution with centroid |
| Open with DEXTER | |
Figure 8 shows for the same set of models the results for the observed visual and spectroscopic binary fractions. The top panels show the goodness-of-fit of the visual binary fraction, for models with a different value of ![]() ,
,
![]() ,
and for different intrinsic binary fractions FM (indicated in the bottom-left corner of each panel). The darkest regions in each panel indicate the best-fitting combinations of
,
and for different intrinsic binary fractions FM (indicated in the bottom-left corner of each panel). The darkest regions in each panel indicate the best-fitting combinations of ![]() and
and ![]() .
The bottom panels show the observed spectroscopic binary fraction as a function of
.
The bottom panels show the observed spectroscopic binary fraction as a function of ![]() ,
,
![]() and FM, where the darkest regions correspond to the highest spectroscopic binary fraction. The lower limit (
and FM, where the darkest regions correspond to the highest spectroscopic binary fraction. The lower limit (![]() )
and "upper limit'' (
)
and "upper limit'' (![]() )
for the spectroscopic binary fraction in the LEV sample are indicated with the dotted and dashed contours, respectively. Any well-fitting model has a combination of
)
for the spectroscopic binary fraction in the LEV sample are indicated with the dotted and dashed contours, respectively. Any well-fitting model has a combination of ![]() and
and ![]() within these contours, preferably near the left-hand contour, as a significant number of the RVVs detected by LEV is likely to be a true binary. In each panel of Fig. 8 we indicate the values
within these contours, preferably near the left-hand contour, as a significant number of the RVVs detected by LEV is likely to be a true binary. In each panel of Fig. 8 we indicate the values
![]() found by Duquennoy & Mayor (1991) for solar-type stars in the solar neighbourhood.
found by Duquennoy & Mayor (1991) for solar-type stars in the solar neighbourhood.
By comparing the top and bottom panels in Fig. 8 we find that the intrinsic binary fraction is larger than ![]() 70%, whatever the values of
70%, whatever the values of ![]() and
and ![]() are. Models with
are. Models with
![]() are most consistent with the observations.
The Duquennoy & Mayor (1991) period distribution with
are most consistent with the observations.
The Duquennoy & Mayor (1991) period distribution with
![]() is consistent with the observed angular separation distribution and visual binary fraction, but underpredicts the number of spectroscopic binaries, even if the intrinsic binary fraction is 100%, and all RVVs detected by LEV are spurious. Similar models with a larger value for
is consistent with the observed angular separation distribution and visual binary fraction, but underpredicts the number of spectroscopic binaries, even if the intrinsic binary fraction is 100%, and all RVVs detected by LEV are spurious. Similar models with a larger value for ![]() are consistent with the observations. However, these period distributions are very broad, making the binary population indistinguishable from that resulting from Öpik's law.
are consistent with the observations. However, these period distributions are very broad, making the binary population indistinguishable from that resulting from Öpik's law.
![\begin{figure}
\par\includegraphics[width=5.7cm,clip]{7719f9a.ps}\hspace*{1cm}
\includegraphics[width=9cm,clip]{7719f9b.ps}
\end{figure}](/articles/aa/full/2007/40/aa7719-07/img346.gif) |
Figure 9:
How well do models with a semi-major axis distribution
|
| Open with DEXTER | |
![\begin{figure}
\par\includegraphics[width=16cm,clip]{7719f10a.ps}\par\includegraphics[width=16cm,clip]{7719f10b.ps}
\end{figure}](/articles/aa/full/2007/40/aa7719-07/img347.gif) |
Figure 10:
How well do models with a log-normal period distribution
|
| Open with DEXTER | |
In Sects. 5 and 6 we have constrained the orbital size distribution and the mass ratio distribution fq(q) independently. A risk associated with this approach is that one may find a local, rather than a global set of best-fitting solutions. In this section we demonstrate that our choice has been appropriate, and that we have indeed found the best-fitting model.
Even if the orbital size distribution and fq(q) are intrinsically independent, there could be a correlation between a (or P) and q among the detected binaries. The latter is important for the analysis of the results of a spectroscopic binary survey (e.g., Kobulnicky & Fryer 2006), but is of less importance for visual binaries. In a visual binary survey the orbital size is related to the angular separation ![]() ,
and q is related to the brightness contrast between primary and companion. As the maximum detectable magnitude difference depends on the separation between the binary components, a correlation between the orbital size and q may be introduced among the closest detected companions.
,
and q is related to the brightness contrast between primary and companion. As the maximum detectable magnitude difference depends on the separation between the binary components, a correlation between the orbital size and q may be introduced among the closest detected companions.
In order to study whether we have indeed found the global set of best-fitting solutions, we extend the parameter space, and make comparisons for models with varying orbital size distribution and varying fq(q). We limit ourselves to mass ratio distributions of the form
![]() .
We compare the two-dimensional distribution
.
We compare the two-dimensional distribution
![]() and the visual binary fraction
and the visual binary fraction
![]() of the simulated observations of the combined KO5/SHT dataset with that of the observations. We compare the observed distribution
of the simulated observations of the combined KO5/SHT dataset with that of the observations. We compare the observed distribution
![]() using the two-dimensional KS test (e.g., Press et al. 1992), and we compare the observed visual binary fraction using the Pearson
using the two-dimensional KS test (e.g., Press et al. 1992), and we compare the observed visual binary fraction using the Pearson ![]() test.
test.
Figures 9 and 10 show plots corresponding to those in Figs. 5 and 6, but now with the additional free parameter ![]() .
The results for a power-law semi-major axis distribution in Fig. 9 are similar to those derived in Sects. 5 and 6. The best-fitting values for
.
The results for a power-law semi-major axis distribution in Fig. 9 are similar to those derived in Sects. 5 and 6. The best-fitting values for ![]() and
and ![]() in these diagrams are equal (within the error bars) to those of the independent derivations of fa(a) and fq(q). Note that the adopted combination
in these diagrams are equal (within the error bars) to those of the independent derivations of fa(a) and fq(q). Note that the adopted combination
![]() does not fall in the darkest regions of Fig. 9. The comparison for
does not fall in the darkest regions of Fig. 9. The comparison for
![]() (left panel) suggests somewhat smaller values of
(left panel) suggests somewhat smaller values of ![]() and
and ![]() ,
while the comparison for the visual binary fraction suggests larger values. An inspection of both comparisons suggests that our adopted combination
,
while the comparison for the visual binary fraction suggests larger values. An inspection of both comparisons suggests that our adopted combination
![]() is among the best-fitting combinations for both
is among the best-fitting combinations for both
![]() and
and
![]() .
The figure also clearly shows again that an intrinsic binary fraction close to 100% is required. We do not attempt to further constrain the combination
.
The figure also clearly shows again that an intrinsic binary fraction close to 100% is required. We do not attempt to further constrain the combination
![]() ,
as this would involve a combination of the independent comparisons for
,
as this would involve a combination of the independent comparisons for
![]() and
and
![]() ,
as this would require accurate knowledge of the relative weights that should be assigned to each of these comparisons.
,
as this would require accurate knowledge of the relative weights that should be assigned to each of these comparisons.
The results for the log-normal period distribution
![]() shown in Fig. 10 also indicate that our independent derivation of
shown in Fig. 10 also indicate that our independent derivation of
![]() and fq(q) is justified. The top panels show that the models with a mass ratio distribution exponent
and fq(q) is justified. The top panels show that the models with a mass ratio distribution exponent
![]() ,
-0.6, -0.3 and -0.1 produce a distribution
,
-0.6, -0.3 and -0.1 produce a distribution
![]() that is less consistent than that for the models with the best-fitting solution
that is less consistent than that for the models with the best-fitting solution
![]() ,
for any combination of
,
for any combination of ![]() and
and ![]() .
The bottom panels of Fig. 10 indicate for the observed visual binary fraction the best-fitting combinations of
.
The bottom panels of Fig. 10 indicate for the observed visual binary fraction the best-fitting combinations of ![]() ,
,
![]() ,
,
![]() and FM (darkest regions). These comparisons indicate that, if the log-normal period distribution with
and FM (darkest regions). These comparisons indicate that, if the log-normal period distribution with
![]() holds, the intrinsic binary fraction should be
holds, the intrinsic binary fraction should be
![]() .
Again, we do not attempt to find the optimum combination
.
Again, we do not attempt to find the optimum combination
![]() by combining the results of all panels, as this would require a detailed prescription of the relative weights given to the comparisons of
by combining the results of all panels, as this would require a detailed prescription of the relative weights given to the comparisons of
![]() and the visual binary fraction, which is not trivial. Note that in our models we adopt a binary fraction that is independent of semi-major axis and mass ratio.
and the visual binary fraction, which is not trivial. Note that in our models we adopt a binary fraction that is independent of semi-major axis and mass ratio.
In the sections above we have constrained the properties of the orbital size distribution among intermediate-mass binaries in Sco OB2, using the visual binary surveys of KO5 and SHT and the spectroscopic binary survey of LEV. The tightest binaries have
![]() ,
corresponding to
,
corresponding to
![]() day. The widest orbits have
day. The widest orbits have
![]() ,
or
,
or
![]() .
We have compared the observations with models that have either a power-law semi-major axis distribution or a log-normal period distribution, in order to find the best-fitting orbital size distribution.
.
We have compared the observations with models that have either a power-law semi-major axis distribution or a log-normal period distribution, in order to find the best-fitting orbital size distribution.
We considered a power-law semi-major axis distribution fa(a) with varying exponent ![]() .
Models with a semi-major axis distribution exponent
.
Models with a semi-major axis distribution exponent
![]() are consistent with the observed angular separation distribution and the observed visual binary fraction, but only if the binary fraction is close to 100%. We have additionally considered models with a log-normal period distribution
are consistent with the observed angular separation distribution and the observed visual binary fraction, but only if the binary fraction is close to 100%. We have additionally considered models with a log-normal period distribution
![]() with varying centroid
with varying centroid ![]() and width
and width ![]() .
The distribution derived by Duquennoy & Mayor (1991), with
.
The distribution derived by Duquennoy & Mayor (1991), with ![]() and
and
![]() is shown to be consistent with the observed angular separation distribution and the observed visual binary fraction for models with an intrinsic binary fraction near 100%. The observed spectroscopic binary fraction, however, is rather large compared to those predicted by the above models, even if all stars are in binary systems.
is shown to be consistent with the observed angular separation distribution and the observed visual binary fraction for models with an intrinsic binary fraction near 100%. The observed spectroscopic binary fraction, however, is rather large compared to those predicted by the above models, even if all stars are in binary systems.
Öpik's law could be considered as resulting from a very broad log-normal period distribution (
![]() ). Although Öpik's law and the log-normal period distribution with
). Although Öpik's law and the log-normal period distribution with
![]() are consistent with the observations (i.e., they cannot be excluded), the observations indicate that the best description of the binary population in Sco OB2 is intermediate, with
are consistent with the observations (i.e., they cannot be excluded), the observations indicate that the best description of the binary population in Sco OB2 is intermediate, with
![]() .
.
We have constrained the mass ratio distribution and the orbital size distribution separately. Our investigation of this approach in Sect. 6.5 indicates that we have indeed found the global best-fitting model.
The eccentricity distribution for binaries in Sco OB2 is not known. The field star population, on the other hand, has been studied in detail by Duquennoy & Mayor (1991), who surveyed solar-type stars in the solar neighbourhood for binarity and find the following composite eccentricity distribution. The close binaries (P<10 days) have a negligible eccentricity, presumably due to tidal circularization, although they may have formed in nearly circular orbits. Binaries with a period 10<P<1000 days show a bell-shaped eccentricity distribution that peaks near e=0.3. Binaries with a larger orbital period tend to have a thermal eccentricity distribution fe(e)=2e, though the presence of large-eccentricity binaries are inferred by incompleteness corrections. The latter distribution is expected from energy equipartition (Heggie 1975) as a result of multiple soft encounters. A similar result was found by Mathieu (1994), who studied the properties of pre-main-sequence binaries.
Both studies indicate that the eccentricity distribution may well be a function of orbital period, which is perhaps also the case for Sco OB2. The very tight binaries tend to have more or less circular orbits.
Tidal circularization may have affected these binaries in Sco OB2. The tidal circularization period
![]() ,
defined as the orbital period at which a binary orbit with a typical initial orbital eccentricity circularizes, is
,
defined as the orbital period at which a binary orbit with a typical initial orbital eccentricity circularizes, is
![]() = 7-10 days for young stellar populations (Meibom & Mathieu 2005).
The intermediate-period binaries have a somewhat flat eccentricity distribution, possibly reflecting the formation process. The widest binaries tend to have a more thermal eccentricity distribution, which may (partially) be a result of binary-binary interactions. It must be noted, however, that the eccentricity distribution for the latter two period ranges is very difficult to measure because of the large orbital periods.
= 7-10 days for young stellar populations (Meibom & Mathieu 2005).
The intermediate-period binaries have a somewhat flat eccentricity distribution, possibly reflecting the formation process. The widest binaries tend to have a more thermal eccentricity distribution, which may (partially) be a result of binary-binary interactions. It must be noted, however, that the eccentricity distribution for the latter two period ranges is very difficult to measure because of the large orbital periods.
It is practically impossible to derive the properties of the eccentricity distribution from observations of visual binaries (e.g., Kouwenhoven 2006). On the other hand, this means that the results we derived from the observations of visual binaries (i.e. fq(q), fa(a), fP(P) and FM) are unaffected by our choice for fe(e) in the models. In principle it is possible to constrain fe(e) using observations of spectroscopic and astrometric binaries. However, only one Sco OB2 binary with an astrometrically determined orbital solution is known.
Only the measurements of the spectroscopic binaries can thus be used to constrain the eccentricity distribution for binaries in Sco OB2. The properties of the eccentricity distribution derived below are only valid for the short-period (![]() days;
days;
![]() )
and intermediate-mass binaries. Caution should be taken with generalizing the results for the full population of Sco OB2.
As we do not model the detection of SB1s, SB2s and RVVs in detail, we cannot compare the eccentricity distribution resulting from the simulated observations (SB1s, SB2s, and RVVs) with the observed eccentricity distribution (SB1s and SB2s only). However, it is possible to set several constraints on the intrinsic eccentricity distribution using the observations of LEV. Due to the limited number of eccentricity measurements, the complicated selection effects, and the possible correlation between e and P, we do not attempt to fully recover fe(e). Instead, we consider three commonly adopted eccentricity distributions, and compare the resulting predictions with the observations.
)
and intermediate-mass binaries. Caution should be taken with generalizing the results for the full population of Sco OB2.
As we do not model the detection of SB1s, SB2s and RVVs in detail, we cannot compare the eccentricity distribution resulting from the simulated observations (SB1s, SB2s, and RVVs) with the observed eccentricity distribution (SB1s and SB2s only). However, it is possible to set several constraints on the intrinsic eccentricity distribution using the observations of LEV. Due to the limited number of eccentricity measurements, the complicated selection effects, and the possible correlation between e and P, we do not attempt to fully recover fe(e). Instead, we consider three commonly adopted eccentricity distributions, and compare the resulting predictions with the observations.
In our analysis we will consider three frequently used eccentricity distributions: the flat eccentricity distribution
![]() ,
the thermal eccentricity distribution
f2e(e) = 2e, and the single-valued eccentricity distribution
,
the thermal eccentricity distribution
f2e(e) = 2e, and the single-valued eccentricity distribution
![]() with
with
![]() .
Simply by analyzing Fig. 2, we can rule out an eccentricity distribution of the form fe0, where all binaries have the same eccentricity e0. For associations with
fe(e)=fe0(e) the distribution
.
Simply by analyzing Fig. 2, we can rule out an eccentricity distribution of the form fe0, where all binaries have the same eccentricity e0. For associations with
fe(e)=fe0(e) the distribution
![]() is unbiased, as all binaries have eO. An error is associated with each eccentricity measurement, so that
is unbiased, as all binaries have eO. An error is associated with each eccentricity measurement, so that
![]() is broader than fe(e). In the spectroscopic binary sample, the error in the eccentricity is of order 0.05, ruling out the best-fitting distribution with e0=0.27 with
is broader than fe(e). In the spectroscopic binary sample, the error in the eccentricity is of order 0.05, ruling out the best-fitting distribution with e0=0.27 with
![]() confidence.
confidence.
The observed eccentricity distribution is in better agreement with the thermal distribution f2e and the flat distribution
![]() .
For these distributions the relative (intrinsic) fraction of binary systems with e<0.5 is:
.
For these distributions the relative (intrinsic) fraction of binary systems with e<0.5 is:
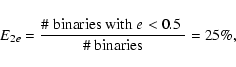 |
(23) |
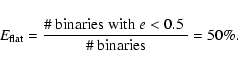 |
(24) |
Table 9:
The observed binary fraction (in %) and inferred intrinsic binary fraction (in %) for the different datasets discussed in this paper. Columns 1 and 2 list the dataset and the observed binary fraction. The predicted observed binary fraction resulting from Öpik's law for each dataset (adopting
![]() )
is listed in Col. 3, followed by the inferred
)
is listed in Col. 3, followed by the inferred ![]() ,
,
![]() and
and ![]() confidence ranges of the inferred binary fraction. The predicted observed binary fraction for the log-normal period distribution with
confidence ranges of the inferred binary fraction. The predicted observed binary fraction for the log-normal period distribution with ![]() and
and
![]() (adopting
(adopting
![]() )
and corresponding confidence ranges for the intrinsic binary fraction are listed in Cols. 7-10. The adopted association parameters are listed in Table 1. For models in Cols. 3-6 the semi-major axis range is
)
and corresponding confidence ranges for the intrinsic binary fraction are listed in Cols. 7-10. The adopted association parameters are listed in Table 1. For models in Cols. 3-6 the semi-major axis range is
![]() .
For models in Cols. 7-10 the period range is
.
For models in Cols. 7-10 the period range is
![]() .
For each model we assume a mass ratio distribution of the form
.
For each model we assume a mass ratio distribution of the form
![]() with
with
![]() and a thermal eccentricity distribution. The comparison between observations and simulated observations indicates that the binary fraction among intermediate-mass binaries in Sco OB2 is close to 100% (
and a thermal eccentricity distribution. The comparison between observations and simulated observations indicates that the binary fraction among intermediate-mass binaries in Sco OB2 is close to 100% (
![]() 70% with
70% with ![]() confidence).
confidence).
In Sect. 6 we have shown that the observed distribution
![]() and binary fraction
and binary fraction
![]() of visual binaries are consistent with both Öpik's law and a log-normal period distribution with
of visual binaries are consistent with both Öpik's law and a log-normal period distribution with
![]() .
For each of these distributions we predict the number of spectroscopic binaries (SB1s, SB2s and RVVs) in the LEV dataset. For models with Öpik's law, our simulations indicate that LEV would be able to detect
.
For each of these distributions we predict the number of spectroscopic binaries (SB1s, SB2s and RVVs) in the LEV dataset. For models with Öpik's law, our simulations indicate that LEV would be able to detect
![]() of the binary systems spectroscopically (i.e., as SB1, SB2 or RVV) for a flat eccentricity distribution, and
of the binary systems spectroscopically (i.e., as SB1, SB2 or RVV) for a flat eccentricity distribution, and
![]() for a thermal eccentricity distribution. If the log-normal period distribution of Duquennoy & Mayor (1991) holds, we find
for a thermal eccentricity distribution. If the log-normal period distribution of Duquennoy & Mayor (1991) holds, we find
![]() for a flat eccentricity distribution, and
for a flat eccentricity distribution, and
![]() for a thermal eccentricity distribution, respectively. The observed spectroscopic binary fraction is thus only mildly dependent on fe(e), and decreases with an increasing average orbital eccentricity.
The spectroscopic binary fraction is also proportional to FM.
The expected fraction of spectroscopic binary systems with e < 0.5 among the observed targets is thus given by:
for a thermal eccentricity distribution, respectively. The observed spectroscopic binary fraction is thus only mildly dependent on fe(e), and decreases with an increasing average orbital eccentricity.
The spectroscopic binary fraction is also proportional to FM.
The expected fraction of spectroscopic binary systems with e < 0.5 among the observed targets is thus given by:
For each of the 23 RVVs in the LEV sample we do not know whether it is truly a binary, and if so, we do not know its eccentricity. We therefore constrain fe(e) by considering two extreme cases for
![]() :
(1) none of the RVVs have e<0.5 (i.e., they are either spectroscopically single, or they are binaries with e>0.5), and (2) all RVVs are binary systems with e<0.5. In these extreme cases,
:
(1) none of the RVVs have e<0.5 (i.e., they are either spectroscopically single, or they are binaries with e>0.5), and (2) all RVVs are binary systems with e<0.5. In these extreme cases,
![]() is constrained by
is constrained by
 |
(29) |
The analysis above indicates that the short-period, intermediate-mass binaries do not follow the thermal eccentricity distribution, but have lower eccentricities on average (see, however, Sect. 10.1). Note that the discussion on the eccentricity distribution is constrained only by a small number of short-period binaries with a massive primary. In the LEV sample, 12 out of the 16 systems with a measured eccentricity have a period
![]() ,
suggesting that the derived properties of the eccentricity distribution may not be representative for the binary population of Sco OB2. Accurate radial velocity and astrometric surveys among intermediate- and low-mass members of Sco OB2 are necessary to further characterize the eccentricity distribution.
,
suggesting that the derived properties of the eccentricity distribution may not be representative for the binary population of Sco OB2. Accurate radial velocity and astrometric surveys among intermediate- and low-mass members of Sco OB2 are necessary to further characterize the eccentricity distribution.
In the previous sections we have constrained the pairing function, the mass ratio distribution, the orbital size distribution and the eccentricity distribution. The analysis of each of these properties indicates that the binary fraction among intermediate mass stars in Sco OB2 has to be close to 100%.
Table 9 lists the fraction of detected binaries among the targeted sample, for the different surveys. Results are listed for the observations and for the simulated observations of models with Öpik's law and for those with the Duquennoy & Mayor (1991) period distribution. For each of these models we have adopted an intrinsic binary fraction
![]() .
The values listed in Table 9 are upper limits, and are proportional to FM.
.
The values listed in Table 9 are upper limits, and are proportional to FM.
The observed visual binary fraction is consistent with Öpik's law, but also with the log-normal period distribution (![]() ,
,
![]() ). A binary population with intermediate properties (
). A binary population with intermediate properties (
![]() ), however, is most consistent with the observations.
The observed spectroscopic binary fraction cannot be compared directly with the simulated observations, as the true nature of the detected radial velocity variables is unknown. The observed spectroscopic binary fraction can be limited by
), however, is most consistent with the observations.
The observed spectroscopic binary fraction cannot be compared directly with the simulated observations, as the true nature of the detected radial velocity variables is unknown. The observed spectroscopic binary fraction can be limited by ![]() (in the unlikely case that all RVVs are spurious) and
(in the unlikely case that all RVVs are spurious) and ![]() (if all RVVs are indeed binaries). Even if the intrinsic binary fraction is 100%, models with Öpik's law only marginally reproduce the observed spectroscopic binary fraction, while those with the Duquennoy & Mayor (1991) period distribution underpredict the observed value. In the case that 50% or 100% of the RVVs are indeed binaries, the log-normal period distribution can be excluded with
(if all RVVs are indeed binaries). Even if the intrinsic binary fraction is 100%, models with Öpik's law only marginally reproduce the observed spectroscopic binary fraction, while those with the Duquennoy & Mayor (1991) period distribution underpredict the observed value. In the case that 50% or 100% of the RVVs are indeed binaries, the log-normal period distribution can be excluded with ![]() and
and ![]() confidence, respectively, if our other assumptions hold (see Sect. 10.1).
confidence, respectively, if our other assumptions hold (see Sect. 10.1).
Our model for the Hipparcos selection effects for the (X), (O), and (G) binaries is not strict enough. This is because in our models we consider all binaries with the properties listed in Table 6 as astrometric binaries. In reality, however, only a subset of these would have been marked as an astrometric binary by Hipparcos (see Sect. 4.6.2). The predicted astrometric binary fraction can therefore only be used as an upper limit when a comparison with the observations is made. The predicted fraction of visual binaries in category (C) on the other hand, is well-modeled. Models with a binary fraction
![]() correctly predict the number of (C) binaries.
correctly predict the number of (C) binaries.
An inspection of the observed binary fractions for the different datasets (Table 9) and their associated statistical errors above indicates that the binary fraction among intermediate mass stars in Sco OB2 must be larger than ![]() 85% at the
85% at the ![]() confidence level, and larger than
confidence level, and larger than ![]() 70% at the
70% at the ![]() confidence level. We find that models with a binary fraction of 100% are most consistent with the observations; models with a significantly smaller binary fraction are inconsistent with the observed binary fraction. Mason et al. (1998) found that almost all high-mass stars are multiple. Our complementary results indicate that also practically all intermediate mass stars form in a binary or multiple system.
confidence level. We find that models with a binary fraction of 100% are most consistent with the observations; models with a significantly smaller binary fraction are inconsistent with the observed binary fraction. Mason et al. (1998) found that almost all high-mass stars are multiple. Our complementary results indicate that also practically all intermediate mass stars form in a binary or multiple system.
For the models with a power-law semi-major axis distribution fa(a) we have adopted a semi-major axis distribution
![]() ,
and for models with a log-normal period distribution
,
and for models with a log-normal period distribution
![]() we have adopted the period range
we have adopted the period range
![]() .
These lower and upper limits are derived from the observational data and have their associated uncertainties (see Sects. 6.1 and 6.2). In this section we briefly study the effect of these uncertainties on our results.
.
These lower and upper limits are derived from the observational data and have their associated uncertainties (see Sects. 6.1 and 6.2). In this section we briefly study the effect of these uncertainties on our results.
The binary population properties derived from the angular separation distribution of visual binaries are not affected by our choice of the lower and upper limits. The results in the left-hand panels in Figs. 5, 6, 8, 9, the top panels in Fig. 10, and the derived distributions fa(a), fP(P) and fq(q) are insensitive to our choice for the tightest or widest orbits.
The inferred binary fraction, however, does depend on these limits. Table 10 shows the expected visual and spectroscopic binary fractions, for models with different
![]() and
and
![]() (adopting Öpik's law), and different
(adopting Öpik's law), and different
![]() and
and
![]() (adopting the period distribution of Duquennoy & Mayor 1991). If, for a given model, we increase the value of
(adopting the period distribution of Duquennoy & Mayor 1991). If, for a given model, we increase the value of
![]() or
or
![]() ,
this leads to smaller values for the simulated visual and spectroscopic binary fractions. If we increase
,
this leads to smaller values for the simulated visual and spectroscopic binary fractions. If we increase
![]() or
or
![]() ,
this leads to smaller spectroscopic binary and a larger visual binary fraction. In other words, an overestimation of
,
this leads to smaller spectroscopic binary and a larger visual binary fraction. In other words, an overestimation of
![]() or
or
![]() leads to an overestimation of the inferred intrinsic binary fraction FM. An overestimation of
leads to an overestimation of the inferred intrinsic binary fraction FM. An overestimation of
![]() or
or
![]() leads to an overestimation of FM as derived from the observed spectroscopic binary fraction, but to an underestimation of FM as derived from the observed visual binary fraction.
leads to an overestimation of FM as derived from the observed spectroscopic binary fraction, but to an underestimation of FM as derived from the observed visual binary fraction.
Fortunately, the properties of the tightest and widest binaries are reasonably well constrained by observations. Table 10 shows that the uncertainty in the observed visual binary fraction is approximately 2%, as a result of the errors in
![]() and
and
![]() .
The corresponding error in the spectroscopic binary fraction ranges from about 2% for the log-normal period distribution to approximately 5% for Öpik's law. The uncertainty in the inferred intrinsic binary fraction is slightly smaller as we combine the visual and spectroscopic results. An overestimation of
.
The corresponding error in the spectroscopic binary fraction ranges from about 2% for the log-normal period distribution to approximately 5% for Öpik's law. The uncertainty in the inferred intrinsic binary fraction is slightly smaller as we combine the visual and spectroscopic results. An overestimation of
![]() ,
for example, leads to a larger visual binary fraction but a smaller spectroscopic binary fraction, so that the systematic uncertainty on FM partially cancels out.
The effects of the uncertainty in the lower and upper limits of fa(a) and fP(P) are therefore limited. We estimate that this uncertainty results in a systematic error of
,
for example, leads to a larger visual binary fraction but a smaller spectroscopic binary fraction, so that the systematic uncertainty on FM partially cancels out.
The effects of the uncertainty in the lower and upper limits of fa(a) and fP(P) are therefore limited. We estimate that this uncertainty results in a systematic error of ![]() -
-![]() in the inferred intrinsic binary fraction FM.
in the inferred intrinsic binary fraction FM.
Table 10:
The simulated observed binary fraction for models with a different assumption for the tightest and widest binaries. The first and second column list the properties of the tightest and widest orbits, respectively. The third and fourth column list the visual binary fraction for the simulated combined KO5/SHT observations and the spectroscopic binary fraction for the simulated LEV observations, respectively. For each model we adopt an intrinsic binary fraction
![]() and a thermal eccentricity distribution. The values listed in Cols. 3 and 4 are proportional to FM. The statistical errors on the listed binary fraction are 0.5-
and a thermal eccentricity distribution. The values listed in Cols. 3 and 4 are proportional to FM. The statistical errors on the listed binary fraction are 0.5-![]() .
The values listed in this table provide error estimates for our results in Table 9. The uncertainties in the limits of fa(a) and fP(P) result in a systematic error of <2-
.
The values listed in this table provide error estimates for our results in Table 9. The uncertainties in the limits of fa(a) and fP(P) result in a systematic error of <2-![]() in the inferred intrinsic binary of the binary population.
in the inferred intrinsic binary of the binary population.
Sco OB2 is a young OB association (5-20 Myr) with a low stellar density (
![]() ), comparable to the stellar density in the solar neighbourhood. One therefore expects that stellar and dynamical evolution have only mildly altered the properties of the binary population. In this section we study which binary systems in Sco OB2 may have changed one or more of their parameters since the time of formation. We first consider whether stellar (and binary) evolution has affected the binary population, and subsequently investigate the importance of dynamical evolution.
), comparable to the stellar density in the solar neighbourhood. One therefore expects that stellar and dynamical evolution have only mildly altered the properties of the binary population. In this section we study which binary systems in Sco OB2 may have changed one or more of their parameters since the time of formation. We first consider whether stellar (and binary) evolution has affected the binary population, and subsequently investigate the importance of dynamical evolution.
For stellar populations with an age less than about 20 Myr the fraction of binaries of which the properties have changed due to stellar evolution is small. The hydrogen-burning time as a function of initial mass and initial rotational velocity was studied by Meynet & Maeder (2000). According to their model, stars more massive than 32-
![]() (O6 V) in US, and stars more massive than 10-
(O6 V) in US, and stars more massive than 10-
![]() (B2 V) in UCL and LCC have evolved away from the main sequence. The lower and upper limits for each subgroup correspond to stars with an initial rotational velocity of 0 km s-1 and 300 km s-1, respectively.
The most massive star in the US subgroup is Antares, an M1 Ib supergiant with an initial mass of
(B2 V) in UCL and LCC have evolved away from the main sequence. The lower and upper limits for each subgroup correspond to stars with an initial rotational velocity of 0 km s-1 and 300 km s-1, respectively.
The most massive star in the US subgroup is Antares, an M1 Ib supergiant with an initial mass of
![]() (Preibisch et al. 2002), indicating that we may have mildly overestimated the upper mass limit for the US subgroup. The derived mass limit for the UCL and LCC subgroups corresponds roughly to the observed range of spectral types. An extrapolation of the mass distribution (Eq. (2)) to infinity suggests that only 3-8 stars of spectral type O (
(Preibisch et al. 2002), indicating that we may have mildly overestimated the upper mass limit for the US subgroup. The derived mass limit for the UCL and LCC subgroups corresponds roughly to the observed range of spectral types. An extrapolation of the mass distribution (Eq. (2)) to infinity suggests that only 3-8 stars of spectral type O (
![]() )
have formed in Sco OB2.
)
have formed in Sco OB2.
Several of the binary systems with a primary initially more massive than the turn-off mass will have produced a compact component. These compact objects and their previous companion stars may have obtained a significant kick during the supernova event, resulting in a space velocity significantly different from that of their parent association (runaway stars). The properties of compact binary systems including at least one star with a higher initial mass may have changed due to binary evolution. For ![]() 99.9% of the binaries in Sco OB2, however, both components have an initial mass (much) less than those mentioned above; stellar evolution will not have affected these binaries.
99.9% of the binaries in Sco OB2, however, both components have an initial mass (much) less than those mentioned above; stellar evolution will not have affected these binaries.
Changes of the binary population due to stellar evolution can therefore be neglected. The change due to dynamical evolution is more complicated to quantify. Below we calculate which binary systems are affected by dynamical evolution, at the current stellar density of the association. After that we briefly discuss the consequences of the fact that the subgroups of Sco OB2 may have been denser in the past.
The subgroups of Sco OB2 can be approximated as roughly spherical, with radii of order R = 20-30 pc (see Table 1). The structure and kinematics of Sco OB2 have been studied by de Bruijne (1999), who finds that the one-dimensional internal velocity dispersion for each of the subgroups is
![]() km s-1, corresponding to a three-dimensional velocity dispersion
km s-1, corresponding to a three-dimensional velocity dispersion
![]() -2.6 km s-1. The crossing time of each subgroup is thus
-2.6 km s-1. The crossing time of each subgroup is thus
![]() Myr.
Preibisch et al. (2002) find that the US subgroup contains approximately 2525 members more massive than
Myr.
Preibisch et al. (2002) find that the US subgroup contains approximately 2525 members more massive than
![]() .
The total number of members N in the substellar regime depends on the unknown values of
.
The total number of members N in the substellar regime depends on the unknown values of
![]() and
and ![]() in Eq. (2). For reasonable value of
in Eq. (2). For reasonable value of
![]() and
and ![]() ,
about 44% of the members have a mass smaller than
,
about 44% of the members have a mass smaller than
![]() ,
so that the total number of systems equals
,
so that the total number of systems equals
![]() .
Adopting a mass ratio distribution of the form
.
Adopting a mass ratio distribution of the form
![]() and a binary fraction of 100%, the total mass of US is of order
and a binary fraction of 100%, the total mass of US is of order
![]() .
We assume that the UCL and LCC subgroups contain a similar number of members. The mass density of each subgroup is therefore of order
.
We assume that the UCL and LCC subgroups contain a similar number of members. The mass density of each subgroup is therefore of order
![]() ,
corresponding to
,
corresponding to
![]() systems (or
systems (or
![]() individual stars) per cubic parsec.
individual stars) per cubic parsec.
An estimate for the relaxation time
![]() ,
i.e., the typical timescale at which a system of N single stars has "forgotten'' the initial conditions, is
,
i.e., the typical timescale at which a system of N single stars has "forgotten'' the initial conditions, is
 |
(31) |
 |
(32) |
| |
= | ||
 |
(33) |
The density of Sco OB2 may have been (much) higher during the star formation process. Simulations of van den Berk et al. (2007), however, suggest that even at higher stellar densities, the binarity population is only mildly affected by dynamical interactions. In the latter paper, simulations of small (N =100) and initially dense (
![]() systems per cubic parsec) expanding star clusters are presented. Their simulations include triple systems for which the period of the outer orbit reaches up to 1000 years. Although these simulated clusters are more than a million times denser than the current density of Sco OB2, the properties of the binary population do not change significantly within 20 Myr. As about 60% of the binary systems in Sco OB2 has an orbital period smaller than 1000 years, these binaries are expected not to have changed significantly since the birth of the association, even if the density of Sco OB2 was orders of magnitude larger at the time of formation.
systems per cubic parsec) expanding star clusters are presented. Their simulations include triple systems for which the period of the outer orbit reaches up to 1000 years. Although these simulated clusters are more than a million times denser than the current density of Sco OB2, the properties of the binary population do not change significantly within 20 Myr. As about 60% of the binary systems in Sco OB2 has an orbital period smaller than 1000 years, these binaries are expected not to have changed significantly since the birth of the association, even if the density of Sco OB2 was orders of magnitude larger at the time of formation.
The discussion above indicates that the current binary population is likely very similar to the current binary population, suggesting that all intermediate mass stars have formed in a binary or multiple system. However, due to the as yet unknown initial conditions of Sco OB2 (such as the initial stellar density), N-body simulations of expanding OB associations are necessary to further constrain the primordial binary population of Sco OB2. By varying the initial conditions, evolving each simulated association for 5-20 Myr, and comparing the outcome with the observations, the primordial binary population can be recovered. The latter technique is referred to as inverse dynamical population synthesis (see Kroupa 1995a,b).
Table 11:
The number of background stars expected per field of view for each of the three imaging surveys discussed in this paper, according to our model. The field of view size is 361.2 arcsec2 for KO5, 196.0 arcsec2 for KO6, and 280.1 arcsec2 for SHT. We list the results for three different pointings: to the centers of the three subgroups US, UCL, and LCC, and for the intersection of LCC with the Galactic plane. Columns 4, 6, and 8 list the number of background stars brighter than
![]() mag per field of view. Columns 5, 7, and 9 list the number of background stars brighter than
mag per field of view. Columns 5, 7, and 9 list the number of background stars brighter than
![]() mag per field of view. The last column lists for each group the value of the normalization constant C in Eq. (34).
mag per field of view. The last column lists for each group the value of the normalization constant C in Eq. (34).
In our analysis we have constrained the properties of the binary population primarily using observations of visual binaries. Our simulations have indicated that even models with an intrinsic binary fraction of ![]() produce a rather low spectroscopic binary fraction as compared to the observations of LEV. Throughout this paper, however, we have ignored the presence of triple and higher-order systems. These systems are known to be present in Sco OB2: the observed higher-order multiplicity fraction among Hipparcos members of Sco OB2 is
produce a rather low spectroscopic binary fraction as compared to the observations of LEV. Throughout this paper, however, we have ignored the presence of triple and higher-order systems. These systems are known to be present in Sco OB2: the observed higher-order multiplicity fraction among Hipparcos members of Sco OB2 is
![]() (see Table 1). This value is a lower limit due to the presence of undetected companions. The studies of Tokovinin & Smekhov (2002) and Correia et al. (2006) have indicated that 20-
(see Table 1). This value is a lower limit due to the presence of undetected companions. The studies of Tokovinin & Smekhov (2002) and Correia et al. (2006) have indicated that 20-![]() of the wide visual binaries have a spectroscopic subsystem.
of the wide visual binaries have a spectroscopic subsystem.
The presence of these triple and higher-order systems among the Hipparcos members of Sco OB2 could explain the apparent underabundance of spectroscopic binaries in our models at least partially, if one would only include the outer components of a multiple system in the statistics. We do not attempt to calculate the contribution of spectroscopic subsystems in this paper, as this would require detailed a priori knowledge about the triple population. Further detailed observational studies are necessary to characterize the properties of these systems, and to derive the primordial binary-and-multiple-systems population of Sco OB2.
Heacox (1995) derived the mass ratio distribution for Sco OB2 binaries with an intermediate-mass primary from the LEV dataset. He derived the mass ratio distribution using the observations of all 22 binaries with spectroscopic elements, resulting in a mean mass ratio
![]() with a standard derivation
with a standard derivation
![]() .
In our analysis we adopt a mass ratio distribution of the form
.
In our analysis we adopt a mass ratio distribution of the form
![]() .
If this distribution is adopted, the mean mass ratio is
.
If this distribution is adopted, the mean mass ratio is
![]() ,
and the standard deviation is
,
and the standard deviation is
![]() .
Our best-fitting solution has
.
Our best-fitting solution has
![]() ,
so that
,
so that
![]() and
and
![]() (formal errors). These quantities, based on our analysis of visual binaries, are mildly larger than the values derived by Heacox (1995). In the latter paper the mass ratio distribution is derived from a much smaller, but independent sample. Heacox (1995) derives the mass ratio distribution for spectroscopic binaries with early B-type primaries, while in our analysis we derive the distribution from observations of visual binaries with B and A-type primaries.
(formal errors). These quantities, based on our analysis of visual binaries, are mildly larger than the values derived by Heacox (1995). In the latter paper the mass ratio distribution is derived from a much smaller, but independent sample. Heacox (1995) derives the mass ratio distribution for spectroscopic binaries with early B-type primaries, while in our analysis we derive the distribution from observations of visual binaries with B and A-type primaries.
In imaging surveys it is not always clear whether a secondary is a physical companion or a background star. In our models for the association this is obviously not a problem (as we know the true nature of each star in our model), but in practice it is. In this section we discuss briefly how background stars can affect the interpretation of the results of a visual binary survey.
We use the prescription derived in Kouwenhoven et al. (2007) for the number of background stars brighter than ![]() and with an angular separation smaller than
and with an angular separation smaller than ![]() ,
as a function of
,
as a function of ![]() and
and ![]() :
:
For the N targets in our model, we assume that N/3 targets are in each of the regions US and UCL, and that N/6 targets are in each of the regions LCC and the Galactic plane (GP). After the number of background stars
![]() is determined, each background star is assigned a
is determined, each background star is assigned a ![]() magnitude randomly drawn from the generating distribution corresponding to Eq. (34). Each of the
magnitude randomly drawn from the generating distribution corresponding to Eq. (34). Each of the
![]() background stars is assigned a random position in the field of one of the N target stars. Finally, the angular separation and magnitude difference are calculated. For each background star we then decide whether it would be detected in the simulated observations, i.e., whether it satisfies the contrast constraint. Figure 11 shows the results for one of our models. Note how well the results in this figure resemble those of the KO5 observations in Kouwenhoven et al. (2007) in their Fig. 8.
background stars is assigned a random position in the field of one of the N target stars. Finally, the angular separation and magnitude difference are calculated. For each background star we then decide whether it would be detected in the simulated observations, i.e., whether it satisfies the contrast constraint. Figure 11 shows the results for one of our models. Note how well the results in this figure resemble those of the KO5 observations in Kouwenhoven et al. (2007) in their Fig. 8.
![\begin{figure}
\par\includegraphics[width=5.5cm,clip]{7719f11.ps}
\end{figure}](/articles/aa/full/2007/40/aa7719-07/img474.gif) |
Figure 11:
The simulated KO5 data for a realization of the best-fitting model of Sco OB2 (cf. Kouwenhoven et al. 2007, their Fig. 3.8). The plots show the distribution of physical companions (plusses) and background stars (triangles). The horizontal dashed line indicates the criterion used by KO5 (based on the analysis of SHT) to statistically separate companion stars and background stars. The simulated sample consists of 199 targets, next to which we detect 64 companion stars and 28 background stars. Although three companions have
|
| Open with DEXTER | |
As the properties of the background star population are well described, and the parallax and age of each Sco OB2 member star is known, the colour and magnitude of each secondary can be used to determine whether it is a companion star or a background star. This method has been used in the analysis of the surveys of SHT, KO5, and KO6.
SHT consider all new companions with
![]() mag, J > 13 mag, or
mag, J > 13 mag, or
![]() mag as background stars. KO5 consider all new companions with
mag as background stars. KO5 consider all new companions with
![]() mag as background stars. The expected number of background stars with
mag as background stars. The expected number of background stars with
![]() mag in the KO5 and SHT datasets can now be calculated. Among the 199 targets in the KO5 dataset, we expect 1-4 background stars with
mag in the KO5 and SHT datasets can now be calculated. Among the 199 targets in the KO5 dataset, we expect 1-4 background stars with
![]() mag. In their follow-up study KO6 show that the
mag. In their follow-up study KO6 show that the
![]() criterion correctly classifies the companions and background stars in about 85% of the cases.
They performed multi-colour observations of several doubtful candidate companions, and identified six of these as possible background stars. Among the 87 confirmed Sco OB2 members in the SHT dataset we expect
criterion correctly classifies the companions and background stars in about 85% of the cases.
They performed multi-colour observations of several doubtful candidate companions, and identified six of these as possible background stars. Among the 87 confirmed Sco OB2 members in the SHT dataset we expect ![]() background star with
background star with
![]() mag.
The expected number of bright background stars is small, and many background stars have been removed by magnitude criteria and the follow-up study of KO6. The possible presence of background stars among the candidate binaries thus has a negligible effect on the conclusions of our analysis.
mag.
The expected number of bright background stars is small, and many background stars have been removed by magnitude criteria and the follow-up study of KO6. The possible presence of background stars among the candidate binaries thus has a negligible effect on the conclusions of our analysis.
Throughout this paper we have assumed that most binary parameters are mutually independent, and independent of the binary fraction as well. We have ignored the possible dependence of binary fraction, semi-major axis, eccentricity, and mass ratio on primary mass. However, due to the relatively small range of primary masses studied, these dependencies do not affect our results significantly.
Several recent studies have focused on the very low-mass (VLM) and brown dwarf (BD) binaries in Sco OB2, such as the survey for spectroscopic binaries in US and ![]() Oph by Kurosawa et al. (2006), and the near-infrared visual imaging survey among 12 VLM and BD members of Sco OB2 by Kraus et al. (2005). Surveys for binarity among the lowest mass stars and brown dwarfs find an observed binary fraction
Oph by Kurosawa et al. (2006), and the near-infrared visual imaging survey among 12 VLM and BD members of Sco OB2 by Kraus et al. (2005). Surveys for binarity among the lowest mass stars and brown dwarfs find an observed binary fraction
![]() (Basri & Reiners 2006; Burgasser et al. 2007). This value is a lower limit to the intrinsic binary fraction among these targets due to the presence of undetected companions.
As the details of the binary formation mechanism are not known, we limit ourselves to a discussion of two possible relations between the binary fraction
FM(M1) and the primary mass M1: a linear and a logarithmic dependence.
(Basri & Reiners 2006; Burgasser et al. 2007). This value is a lower limit to the intrinsic binary fraction among these targets due to the presence of undetected companions.
As the details of the binary formation mechanism are not known, we limit ourselves to a discussion of two possible relations between the binary fraction
FM(M1) and the primary mass M1: a linear and a logarithmic dependence.
For simplicity, we adopt a binary fraction of 100% for the most massive stars in Sco OB2:
![]() and the observational constraint for the binary fraction in the low-mass regime:
and the observational constraint for the binary fraction in the low-mass regime:
![]() .
Adopting a linear relation between
.
Adopting a linear relation between
![]() and M1, we find that
and M1, we find that
![]() .
This prescription results in a strong dependence for high-mass stars: the binary fraction drops from
.
This prescription results in a strong dependence for high-mass stars: the binary fraction drops from
![]() for the earliest B stars to
for the earliest B stars to
![]() for the latest B stars. If we assume, for example, that the intrinsic binary fraction for brown dwarfs is
for the latest B stars. If we assume, for example, that the intrinsic binary fraction for brown dwarfs is ![]() ,
the binary fraction for the latest B stars is
,
the binary fraction for the latest B stars is ![]() ,
and even lower for the A stars. As our observations are dominated by targets of spectral type A (
,
and even lower for the A stars. As our observations are dominated by targets of spectral type A (
![]() ), the linear prescription for
FM(M1) can be excluded (unless the dependence is very weak).
), the linear prescription for
FM(M1) can be excluded (unless the dependence is very weak).
A logarithmic form for
FM(M1) results in
![]() .
Then stars of spectral type B have a binary fraction of 80-
.
Then stars of spectral type B have a binary fraction of 80-![]() ,
and those of spectral type A have a binary fraction of 70-
,
and those of spectral type A have a binary fraction of 70-![]() .
Again, if we assume an intrinsic binary fraction for brown dwarfs of 50%, the values are 85-
.
Again, if we assume an intrinsic binary fraction for brown dwarfs of 50%, the values are 85-![]() and 80-
and 80-![]() ,
respectively. The latter values are in better agreement with our observations, although they are rather low.
,
respectively. The latter values are in better agreement with our observations, although they are rather low.
A correlation between binary fraction and spectral type may be present for Sco OB2, although the functional relation is presently unknown. Our derived value for FM, however, is unlikely to be strongly affected by our choice of a binary fraction that is independent of spectral type, due to the relatively small range in mass of the binaries in our analysis. Finally, we wish to note that the derivation of the distributions fa(a), fP(P) and fq(q) are practically independent of our choice of FM(M1).
We have recovered the properties of the intermediate-mass binary population in the nearby OB association Sco OB2, with the aim of finding the primordial binary population (which is present just after star formation). We have performed Monte Carlo simulations, and compared for each association model the simulated observations with the results of surveys for visual, spectroscopic, and astrometric binary systems in Sco OB2. The main results of our study are the following:
In this paper we have included the results of six major binarity surveys among Sco OB2 members. We have not included the smaller surveys and individual discoveries, as each of these has its specific, often poorly documented selection effects. Inclusion of these will provide a better description of the binary population in Sco OB2. However, the results are likely to be similar to those described in this paper, as the six major binary surveys used contain the large majority of the known binaries in Sco OB2. Although previous observations (e.g. Kouwenhoven et al. 2007,2005) have shown that triple and higher-order systems are present in Sco OB2, we have neglected these systems here, because of the non-trivial comparison with the observations, the more complicated selection effects, and the very small number of known higher-order multiples.
In our recovery of the current and primordial binary population in Sco OB2 we have made several assumptions and simplifications. Our main results are obtained using the visual binaries, and are shown to be consistent with the available spectroscopic and astrometric binaries. The modeling of the selection effects of the spectroscopic and astrometric binaries needs to be improved, so that the simulated observations can be directly compared to the observed binary parameter distributions, in order to accurately derive the eccentricity distribution and the possible correlation between the different binary parameters.
The assumed independence of the binary parameters, as well as the properties of the low-mass binary population need to be addressed observationally. Due to selection effects a relatively small number of binaries is known among the low-mass members of Sco OB2, making it difficult to derive the properties of these. Several studies for binarity among low-mass (candidate) members of Sco OB2 have been performed recently (e.g. Bouy et al. 2006; Kraus & Hillenbrand 2007; Kurosawa et al. 2006). In the near future, after a further extension of the dataset, and a thorough membership study, it may be possible to characterize the binary population of Sco OB2 over the full range of spectral types. This issue can be further and more accurately addressed using the results of the Gaia space mission (Turon et al. 2005; Perryman et al. 2001), which is a project of the European Space Agency, expected to be launched in 2011. Gaia will survey over a billion stars in our Galaxy and the Local Group, and will provide an enormous dataset of visual, eclipsing, spectroscopic, and astrometric binaries (Söderhjelm 2005). The membership and stellar content of nearby OB associations can be accurately determined using the results of Gaia, down into the brown dwarf regime. The Gaia dataset will be homogeneous, and its selection effects can therefore be modeled in detail. The available dataset of binaries will be larger and more complete than any other binarity survey in Galactic star clusters and OB associations thus far.
The current binary population in Sco OB2 is a fossil record of the primordial binary population, as the young age and low stellar density of Sco OB2 guarantees that stellar evolution has affected only a handful of the most massive binaries, and suggests that dynamical evolution of the binary population has been modest. The latter statement needs to be verified using numerical simulations of evolving OB associations. Whether the effect of dynamical evolution has been negligible over the lifetime of Sco OB2 depends on its initial conditions. If Sco OB2 was born as a low-density association, similar to its present state, the binary population is expected to have changed only modestly due to dynamical evolution. On the other hand, if the association has expanded significantly over the last 5-20 Myr, dynamical evolution may have been more prominent.
Acknowledgements
We wish to thank Hans Zinnecker, Ed van den Heuvel, Andrei Tokovinin and the referee (Anthony Moffat) for their supportive criticism, which helped to improve this paper. T.K. was supported by NWO under project number 614.041.006 and by PPARC/STFC under grant number PP/D002036/1. This research was supported by the Royal Netherlands Academy of Sciences (KNAW) and the Netherlands Research School for Astronomy (NOVA).
Table A.1: Properties of the KO5 dataset that we use in our analysis. Note that not all candidate companions are listed here, as in our analysis we only consider single stars and binary systems. The members HIP 68532 and HIP 69113 (marked with a star) both have two companions with a similar separation, position angle, and brightness. In our analysis we consider these "double companions'' as a single companion.
Table A.2: Properties of the KO6 dataset that we use in our analysis. Note that not all candidate companions are listed here, as in our analysis we only consider single stars and binary systems. The members HIP 68532 and HIP 69113 (marked with a star) both have two companions with a similar separation, position angle, and brightness. In our analysis we consider these "double companions'' as a single companion.
Table A.3: Properties of the SHT dataset that we use in our analysis. Note that not all candidate companions are listed here, as in our analysis we only consider single stars and binary systems. The six members at the bottom of the list were not explicitly observed by SHT. Due to the presence of (known) close companions these were not suitable for wavefront sensing. We have included these targets for our analysis to avoid a bias towards low binarity.
Table A.4: The LEV dataset used in this sample, consisting of 16 binaries with orbital elements (SB1 or SB2), and 23 radial velocity variables (RVV), for which no orbital elements are available. Left: the 16 spectroscopic binaries with orbital elements among the confirmed members of Sco OB2, in the LEV dataset. LEV observed 53 confirmed members of Sco OB2, of which 8 SB1s, 8 SB2s, 23 RVVs, and 14 targets with a constant radial velocity. Right: the 23 RVVs. Note that several of the RVVs may not be spectroscopic binaries, as radial velocity variation may also be caused by line profile variability.
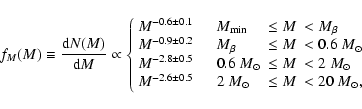
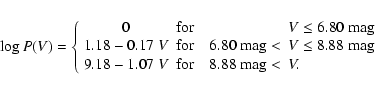
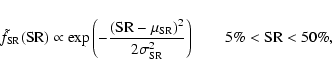
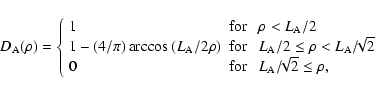
![\begin{displaymath}
\begin{array}{l}
\Delta K_{\rm S,~det}(\rho) = \\ [0.5mm]
...
...R}) & \quad \rho \geq 2'',\\
\end{array} \right.
\end{array}\end{displaymath}](/articles/aa/full/2007/40/aa7719-07/img169.gif)