A&A 473, 791-803 (2007)
DOI: 10.1051/0004-6361:20077640
C IV absorption in damped and sub-damped Lyman- systems
Correlations with metallicity and implications for galactic winds at
z  2-3
2-3![[*]](/icons/foot_motif.gif) ,,
,,
A. J. Fox1 - C. Ledoux2 - P.
Petitjean1, 3 - R. Srianand4
1 - Institut d'Astrophysique de Paris, UMR7095 CNRS,
Université Pierre et Marie Curie, 98bis Bd. Arago, 75014
Paris, France
2 -
European Southern Observatory, Alonso de Córdova 3107, Casilla
19001, Vitacura, Santiago 19, Chile
3 -
LERMA, Observatoire de Paris,
61 avenue de l'Observatoire, 75014 Paris, France
4 -
IUCAA, Post Bag 4, Ganesh Khind, Pune 411 007, India
Received 13 April 2007 / Accepted 27 July 2007
Abstract
We present a study of C IV absorption in a sample of 63 damped
Lyman-
(DLA) systems and 11 sub-DLAs in the redshift range
 ,
using a dataset of high-resolution
(6.6 km s-1 FWHM), high signal-to-noise VLT/UVES spectra.
The complex absorption line profiles show both narrow and broad C IV components, indicating the presence
of both warm, photoionized and hot, collisionally ionized gas.
We report new correlations between the metallicity (measured in the
neutral-phase) and each of the C IV column density, the
C IV total line width, and the maximum C IV velocity.
We explore the effect on these correlations of the sub-DLAs,
the proximate DLAs (defined as those within 5000 km s-1 of the quasar),
the saturated absorbers, and
the metal line used to measure the metallicity,
and we find the correlations to be robust.
There is no evidence for any difference between the measured properties of DLA
C IV and sub-DLA C IV.
In 25 DLAs and 4 sub-DLAs, covering 2.5 dex in [Z/H],
we directly observe C IV moving above the escape speed,
where
,
using a dataset of high-resolution
(6.6 km s-1 FWHM), high signal-to-noise VLT/UVES spectra.
The complex absorption line profiles show both narrow and broad C IV components, indicating the presence
of both warm, photoionized and hot, collisionally ionized gas.
We report new correlations between the metallicity (measured in the
neutral-phase) and each of the C IV column density, the
C IV total line width, and the maximum C IV velocity.
We explore the effect on these correlations of the sub-DLAs,
the proximate DLAs (defined as those within 5000 km s-1 of the quasar),
the saturated absorbers, and
the metal line used to measure the metallicity,
and we find the correlations to be robust.
There is no evidence for any difference between the measured properties of DLA
C IV and sub-DLA C IV.
In 25 DLAs and 4 sub-DLAs, covering 2.5 dex in [Z/H],
we directly observe C IV moving above the escape speed,
where
 is derived from the total line width of the
neutral gas profiles. These high-velocity C IV clouds, unbound from the central
potential well, can be interpreted
as highly ionized outflowing winds, which are
predicted by numerical simulations of galaxy feedback.
The distribution of C IV column density in DLAs and sub-DLAs is similar to
the distribution in Lyman Break galaxies, where winds are
directly observed, supporting the idea that supernova feedback
creates the ionized gas in DLAs.
The unbound C IV absorbers show a median mass flow rate of
is derived from the total line width of the
neutral gas profiles. These high-velocity C IV clouds, unbound from the central
potential well, can be interpreted
as highly ionized outflowing winds, which are
predicted by numerical simulations of galaxy feedback.
The distribution of C IV column density in DLAs and sub-DLAs is similar to
the distribution in Lyman Break galaxies, where winds are
directly observed, supporting the idea that supernova feedback
creates the ionized gas in DLAs.
The unbound C IV absorbers show a median mass flow rate of
 22 (r/40 kpc)
  yr-1, where r is the characteristic C IV radius.
Their kinetic energy fluxes are large
enough that a star formation rate (SFR) of 2 yr-1 is required to power them.
yr-1, where r is the characteristic C IV radius.
Their kinetic energy fluxes are large
enough that a star formation rate (SFR) of 2 yr-1 is required to power them.
Key words: galaxies: quasars: absorption lines -
galaxies: high-redshift - galaxies: halos - galaxies: ISM - galaxies: kinematics and dynamics
To study the properties of high-redshift galaxies in a
luminosity-independent manner, one can
analyze the absorption lines imprinted by their gaseous halos on the
spectra of background quasars.
Such halos are thought to give rise to QSO
absorption line system of various H I column densities:
the damped Lyman-
systems (DLAs), with
log
 ,
the sub-DLAs with
,
the sub-DLAs with
 ,
and
the Lyman limit systems (LLSs) with
,
and
the Lyman limit systems (LLSs) with
 .
Observations have shown that highly ionized gas, as detected in
O VI and C IV absorption, is present in each of these categories of absorber
at
.
Observations have shown that highly ionized gas, as detected in
O VI and C IV absorption, is present in each of these categories of absorber
at  :
in DLAs (Wolfe & Prochaska 2000a; Fox et al. 2007; Ledoux et al. 1998; Lu et al. 1996), in sub-DLAs,
(Richter et al. 2005; Dessauges-Zavadsky et al. 2003; Péroux et al. 2003), and in LLSs (Kirkman & Tytler 1999,1997; Bergeron et al. 1994).
As one progresses down in H I column density
from DLAs to LLSs, one may be
sampling progressively more remote (and more highly ionized)
regions of Galactic halos, with most gas in LLSs lying outside the
halo virial radius (Davé et al. 1999; Maller et al. 2003).
Even some O VI absorbers associated with Lyman-
forest clouds, which
are thought to represent the low-density intergalactic medium (IGM), may
arise in extended galaxy halos or feedback zones from galactic
outflows (Simcoe et al. 2006; Bergeron & Herbert-Fort 2005).
:
in DLAs (Wolfe & Prochaska 2000a; Fox et al. 2007; Ledoux et al. 1998; Lu et al. 1996), in sub-DLAs,
(Richter et al. 2005; Dessauges-Zavadsky et al. 2003; Péroux et al. 2003), and in LLSs (Kirkman & Tytler 1999,1997; Bergeron et al. 1994).
As one progresses down in H I column density
from DLAs to LLSs, one may be
sampling progressively more remote (and more highly ionized)
regions of Galactic halos, with most gas in LLSs lying outside the
halo virial radius (Davé et al. 1999; Maller et al. 2003).
Even some O VI absorbers associated with Lyman-
forest clouds, which
are thought to represent the low-density intergalactic medium (IGM), may
arise in extended galaxy halos or feedback zones from galactic
outflows (Simcoe et al. 2006; Bergeron & Herbert-Fort 2005).
Studying this protogalactic plasma
allows one to address two key themes of extragalactic astronomy:
galactic winds and the metal budget.
Galactic winds are common at high redshift (Veilleux et al. 2005), and must be
present in order to enrich the IGM up to its
observed metallicity (Aracil et al. 2004; Aguirre et al. 2005,2001).
Simulations predict that the level of ionization in winds is high
(Kawata & Rauch 2007; Fangano et al. 2007; Oppenheimer & Davé 2006), and direct observations of absorption in
high-ionization lines have been made in and around Lyman Break
galaxies (LBGs; Adelberger et al. 2005; Shapley et al. 2003; Pettini et al. 2002,2000).
Low-redshift studies of galactic outflows have also found a
high-ionization component (Strickland et al. 2004; Heckman et al. 2001).
Since DLAs represent the largest reservoirs of neutral gas for
high-redshift star formation (Wolfe et al. 2005), they are natural
sites to look for supernova-driven winds and plasma halos in general.
On the second front, ionized halos are
important because of their potential ability to close the metal budget
at  :
there is currently a discrepancy
between the global density of metals predicted by integrating the star
formation history, and the density of metals actually observed
(Pettini 1999; Bouché et al. 2006; Ferrara et al. 2005; Bouché et al. 2007,2005; Sommer-Larsen & Fynbo 2007).
The contribution of plasma halos to the metal budget will be
particularly significant if the plasma is hot and
collisionally ionized, because the cooling times in low-metallicity,
low-density, hot halos are extremely long, and so gas injected into
these environments can become locked up until the current epoch.
For 106 K gas at 10-3 cm-3 and solar metallicity,
:
there is currently a discrepancy
between the global density of metals predicted by integrating the star
formation history, and the density of metals actually observed
(Pettini 1999; Bouché et al. 2006; Ferrara et al. 2005; Bouché et al. 2007,2005; Sommer-Larsen & Fynbo 2007).
The contribution of plasma halos to the metal budget will be
particularly significant if the plasma is hot and
collisionally ionized, because the cooling times in low-metallicity,
low-density, hot halos are extremely long, and so gas injected into
these environments can become locked up until the current epoch.
For 106 K gas at 10-3 cm-3 and solar metallicity,
 is
is
 yr (Houck & Bregman 1990),
so assuming that to first order
yr (Houck & Bregman 1990),
so assuming that to first order
 ,
we find that
the cooling time in gas at one-hundredth solar metallicity (as seen in
DLAs) would be approximately equal to the Hubble time. Finding the gas
in hot halos is therefore important for tracing the history of the
cosmic metals.
,
we find that
the cooling time in gas at one-hundredth solar metallicity (as seen in
DLAs) would be approximately equal to the Hubble time. Finding the gas
in hot halos is therefore important for tracing the history of the
cosmic metals.
In a recent paper (Fox et al. 2007, hereafter Paper I), we discussed the
first observations of O VI absorption in DLAs, finding evidence for a
hot ionized medium that, modulo certain assumptions on metallicity and
ionization, typically contains  40% as many baryons
and metals as there are in the neutral phase. Though 12 DLAs with O VI detections were found, detailed kinematic measurements of the O VI absorption are difficult due to the high density of blends with the
Lyman-
forest. However, if one instead traces the ionized gas with C IV, whose
lines lie redward of the Lyman-
forest, the
blending problems are avoided. Thus, although C IV may trace a lower
temperature phase of plasma than O VI, it is a better ion to study for
building a sample of statistical size. Partly for this reason, the
properties of C IV absorption in the IGM at z>2 have been studied at
length (Ellison et al. 2000; Songaila 2006,2005; Aguirre et al. 2005; Schaye et al. 2003; Aracil et al. 2004; Boksenberg et al. 2003; Schaye et al. 2007; Cowie & Songaila 1998; Scannapieco et al. 2006a).
40% as many baryons
and metals as there are in the neutral phase. Though 12 DLAs with O VI detections were found, detailed kinematic measurements of the O VI absorption are difficult due to the high density of blends with the
Lyman-
forest. However, if one instead traces the ionized gas with C IV, whose
lines lie redward of the Lyman-
forest, the
blending problems are avoided. Thus, although C IV may trace a lower
temperature phase of plasma than O VI, it is a better ion to study for
building a sample of statistical size. Partly for this reason, the
properties of C IV absorption in the IGM at z>2 have been studied at
length (Ellison et al. 2000; Songaila 2006,2005; Aguirre et al. 2005; Schaye et al. 2003; Aracil et al. 2004; Boksenberg et al. 2003; Schaye et al. 2007; Cowie & Songaila 1998; Scannapieco et al. 2006a).
Previous observations of C IV absorption in DLAs (Wolfe & Prochaska 2000a; Lu et al. 1996; Ledoux et al. 1998)
and sub-DLAs (Péroux et al. 2007; Dessauges-Zavadsky et al. 2003; Richter et al. 2005; Péroux et al. 2003)
have found the C IV profiles generally occupy a more extended (though
overlapping) velocity range than the neutral gas profiles.
In an attempt to explain these observations, Wolfe & Prochaska (2000b) tested a
model of gas falling radially onto centrifugally-supported exponential
disks, and found it was unable to reproduce the observed C IV kinematics.
On the other hand, Maller et al. (2003) found that a model in which hot gas in
halos and sub-halos gives rise to the C IV absorption in DLAs was generally
successful in explaining the kinematics.
We continue the study of C IV in DLAs in this paper.
We are partly motivated by the recent work of Ledoux et al. (2006), who
reported a correlation between low-ion line width
 and
metallicity [Z/H] in a sample of 70 DLAs and sub-DLAs, covering
over two orders of magnitude in metallicity
(see also Wolfe & Prochaska 1998; Prochaska et al. 2007a; Murphy et al. 2007).
Since the line widths of the neutral species are thought to be
gravitationally-dominated, the broader lines may be tracing the more
massive halos, and so the
-[Z/H] correlation has
been interpreted as evidence for an underlying mass-metallicity relation.
A natural follow-on question is whether a similar correlation
exists between the high-ion line width and DLA metallicity.
In this paper we investigate whether such a correlation exists, as
well as exploring other relations between the properties
of C IV and those of the neutral gas.
To maximize our sample size, we include observations of C IV absorption in both DLAs and sub-DLAs (and we compare the properties of
the C IV absorption in the two samples).
There is some evidence that sub-DLAs display larger metallicities than
DLAs (Dessauges-Zavadsky et al. 2003; Kulkarni et al. 2007; Péroux et al. 2005), and they have been suggested to be more
massive (Khare et al. 2007).
and
metallicity [Z/H] in a sample of 70 DLAs and sub-DLAs, covering
over two orders of magnitude in metallicity
(see also Wolfe & Prochaska 1998; Prochaska et al. 2007a; Murphy et al. 2007).
Since the line widths of the neutral species are thought to be
gravitationally-dominated, the broader lines may be tracing the more
massive halos, and so the
-[Z/H] correlation has
been interpreted as evidence for an underlying mass-metallicity relation.
A natural follow-on question is whether a similar correlation
exists between the high-ion line width and DLA metallicity.
In this paper we investigate whether such a correlation exists, as
well as exploring other relations between the properties
of C IV and those of the neutral gas.
To maximize our sample size, we include observations of C IV absorption in both DLAs and sub-DLAs (and we compare the properties of
the C IV absorption in the two samples).
There is some evidence that sub-DLAs display larger metallicities than
DLAs (Dessauges-Zavadsky et al. 2003; Kulkarni et al. 2007; Péroux et al. 2005), and they have been suggested to be more
massive (Khare et al. 2007).
The structure of this paper is as follows. Section 2 covers the
observations, sample selection, and measurements. In Sect. 3
we present observed correlations in the data set. In Sect. 4 we
discuss the interpretation of these correlations, and we identify a
population of absorbers that may trace galactic winds. A summary is
presented in Sect. 5.
Our dataset was formed by combining the DLA/sub-DLA sample of
Ledoux et al. (2006) with the
Hamburg-ESO DLA survey of Smette et al. (2005, 2007, in preparation).
All the data were taken in the years 2000 to 2006 with the Very Large
Telescope/Ultraviolet-Visual Echelle Spectrograph (VLT/UVES), located
on the 8.2 m VLT Unit 2 telescope (Kueyen) at Cerro Paranal, Chile.
UVES is described in Dekker et al. (2000).
The data reduction was performed as described in Ledoux et al. (2003),
using the interactive pipeline written by Ballester et al. (2000), running on the
ESO data reduction system MIDAS. The rebinned pixel size is
2 km s-1 and the data have a spectral resolution (FWHM) of
6.6 km s-1 (R=45 000).
We took the 81 DLAs and sub-DLAs in the raw sample with data
covering C IV, and looked for C IV components in a range of
 1000 km s-1 around the system redshift.
Absorption line components were identified
as C IV if they were present in both
1000 km s-1 around the system redshift.
Absorption line components were identified
as C IV if they were present in both  1548 and 1550 in
the correct (2:1) doublet ratio.
In four cases the C IV lines were so contaminated by blends that
we rejected them from the sample.
In three other cases, the H I lines or neutral-phase metal lines were too
blended for a metallicity to be derived; these were also excluded.
No DLAs or sub-DLAs were found where C IV absorption is not present.
The final sample contains 63 DLAs
and 11 sub-DLAs, which are listed in Table 1.
Five of the DLAs and two sub-DLA are at less than 5000 km s-1 from the
QSO redshift, and so may be affected by radiation from the QSO
(e.g. Ellison et al. 2002).
For completeness we retain these
1548 and 1550 in
the correct (2:1) doublet ratio.
In four cases the C IV lines were so contaminated by blends that
we rejected them from the sample.
In three other cases, the H I lines or neutral-phase metal lines were too
blended for a metallicity to be derived; these were also excluded.
No DLAs or sub-DLAs were found where C IV absorption is not present.
The final sample contains 63 DLAs
and 11 sub-DLAs, which are listed in Table 1.
Five of the DLAs and two sub-DLA are at less than 5000 km s-1 from the
QSO redshift, and so may be affected by radiation from the QSO
(e.g. Ellison et al. 2002).
For completeness we retain these
 systems (also known as proximate systems) in the sample, but
the corresponding data points are highlighted in all figures, and we
take note of any differences from the intervening population.
systems (also known as proximate systems) in the sample, but
the corresponding data points are highlighted in all figures, and we
take note of any differences from the intervening population.
For each DLA and sub-DLA,
we fit a continuum to a region several thousand km s-1 in width
centered on C IV 1548, using a polynomial fit (often linear)
to regions of the spectrum judged to be free from absorption.
We defined the zero-point of the velocity scale using the
redshift of the strongest component of neutral gas absorption.
We then determined v- and v+, the velocities
where the C IV absorption recovers to the continuum on the blueward
and redward side of the line.
For each pixel between v- and v+, the apparent
optical depth is defined as
![$\tau_{\rm a}(v)={\rm ln}~[F_{\rm c}(v)/F(v)]$](/articles/aa/full/2007/39/aa7640-07/img36.gif) ,
where F(v) and
,
where F(v) and
 are the actual flux and the estimated continuum
flux as a function of velocity, respectively. The total apparent
optical depth is then found by integrating over the line,
i.e.
are the actual flux and the estimated continuum
flux as a function of velocity, respectively. The total apparent
optical depth is then found by integrating over the line,
i.e.
 .
The apparent column density in each absorber then follows by
.
The apparent column density in each absorber then follows by
![$N_{\rm a}=[3.768\times10^{14}/(\lambda_0 f)]\tau_{\rm a} $](/articles/aa/full/2007/39/aa7640-07/img39.gif) (Savage & Sembach 1991),
where
(Savage & Sembach 1991),
where  is in Angstroms, and f is the oscillator strength
of the line. For the two C IV lines, we take
is in Angstroms, and f is the oscillator strength
of the line. For the two C IV lines, we take
 Å and
f=0.1899, 0.09475 from Morton (2003); see also
Petitjean & Aracil (2004).
The apparent column density will equal the true column density
so long as the lines are not heavily saturated, and that there is no
unresolved saturation in the line profiles.
Å and
f=0.1899, 0.09475 from Morton (2003); see also
Petitjean & Aracil (2004).
The apparent column density will equal the true column density
so long as the lines are not heavily saturated, and that there is no
unresolved saturation in the line profiles.
We require a precise measurement of the total C IV line width in each
system. Following Prochaska & Wolfe (1997),
we define
 as the velocity width that
contains the central 90% of the integrated optical depth in the
line. By finding the two pixels where the cumulative integrated
optical depth is 5% and 95% of the total, and determining the
velocity difference between them, one obtains
.
This can be done for each of the two lines in the C IV doublet, with
the same result expected in each case if the lines are unsaturated and
unblended. Note that
is integrated over all
components, and should not be
confused with the line widths of each individual component.
as the velocity width that
contains the central 90% of the integrated optical depth in the
line. By finding the two pixels where the cumulative integrated
optical depth is 5% and 95% of the total, and determining the
velocity difference between them, one obtains
.
This can be done for each of the two lines in the C IV doublet, with
the same result expected in each case if the lines are unsaturated and
unblended. Note that
is integrated over all
components, and should not be
confused with the line widths of each individual component.
We also define an alternative measure of total line width as v+-v-, the
total velocity range over which C IV absorption is present, regardless
of saturation.
v+-v- is sensitive to weak but nonetheless interesting
satellite components that are not contained within
.
These weak components are particularly relevant in the search for winds.
The drawback of using v+-v- is that it has a larger error than
,
since v- and v+ are
selected by eye (we estimate
 km s-1), and also that it is
sensitive to the signal-to-noise ratio (low optical depth absorption is
harder to detect in low S/N data).
Our data is of high enough quality to ensure that the second effect should
not be a major concern: the noisiest spectrum in our sample has S/N = 25,
and the mean S/N is 51 (where the S/N is measured per
resolution element at the observed wavelength of C IV).
km s-1), and also that it is
sensitive to the signal-to-noise ratio (low optical depth absorption is
harder to detect in low S/N data).
Our data is of high enough quality to ensure that the second effect should
not be a major concern: the noisiest spectrum in our sample has S/N = 25,
and the mean S/N is 51 (where the S/N is measured per
resolution element at the observed wavelength of C IV).
For each profile, we measure the average optical depth-weighted
velocity, denoted by
 ,
and calculated by
,
and calculated by
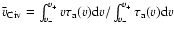 .
Since the velocity zero-point is defined by the
strongest absorption component in the neutral gas,
is equivalent to the mean velocity offset
between the neutral and ionized gas. In the analysis we are only
concerned with the magnitude of the velocity offset,
.
Since the velocity zero-point is defined by the
strongest absorption component in the neutral gas,
is equivalent to the mean velocity offset
between the neutral and ionized gas. In the analysis we are only
concerned with the magnitude of the velocity offset,  ,
and not whether the gas is blueshifted or redshifted relative to the
neutral gas. We also make use of
,
and not whether the gas is blueshifted or redshifted relative to the
neutral gas. We also make use of
 ,
the
maximum absolute velocity at which C IV absorption is observed (i.e.,
the terminal velocity), given by
,
the
maximum absolute velocity at which C IV absorption is observed (i.e.,
the terminal velocity), given by
 .
.
The measurements of column density, total line width, and mean velocity were
conducted independently on 1548 and 1550.
To select which of the two C IV transitions to use for our final
measurement, we followed the following rules that assess the influence
of saturation.
If the condition
 (corresponding to
 )
is true for 1548, where v0 denotes the
velocity where the absorption in strongest, we use 1548 to
measure the C IV, otherwise we use 1550.
If both lines are saturated (defined here as when
)
is true for 1548, where v0 denotes the
velocity where the absorption in strongest, we use 1548 to
measure the C IV, otherwise we use 1550.
If both lines are saturated (defined here as when
 or
or
 at any point
within the line profile), we proceed with a lower limit to the
column density and an upper limit to the line width
using the results from 1550.
However, if one of the two C IV lines is blended, we use the other
line for measurement, regardless of the level of saturation.
There are four cases
where both C IV lines are partly blended, but we
still have useful information at other velocities within the line profiles.
This can occur when the two C IV lines, separated by
500 km s-1, blend with each other.
In these cases, which are flagged in Table 1, we derived our best
estimate of log
at any point
within the line profile), we proceed with a lower limit to the
column density and an upper limit to the line width
using the results from 1550.
However, if one of the two C IV lines is blended, we use the other
line for measurement, regardless of the level of saturation.
There are four cases
where both C IV lines are partly blended, but we
still have useful information at other velocities within the line profiles.
This can occur when the two C IV lines, separated by
500 km s-1, blend with each other.
In these cases, which are flagged in Table 1, we derived our best
estimate of log
 using the sum of the column densities
measured over two separate unblended velocity ranges, and assuming
using the sum of the column densities
measured over two separate unblended velocity ranges, and assuming
 and
and
 ,
where for these cases v- refers to the lower bound of absorption
of the lower velocity range, and v+ refers to the upper bound of
absorption of the higher velocity range.
,
where for these cases v- refers to the lower bound of absorption
of the lower velocity range, and v+ refers to the upper bound of
absorption of the higher velocity range.
In most of the systems in our sample,
the metallicity of the neutral gas, the H I column density, and the low-ion line width have
already been published in Ledoux et al. (2006), so we take these measurements
directly from that paper.
We also include measurements of [Zn/H] in two DLAs
(at
 toward Q0438-0436
and 2.18210 toward Q2311-373) from Akerman et al. (2005),
one DLA and one sub-DLA (at
toward Q0438-0436
and 2.18210 toward Q2311-373) from Akerman et al. (2005),
one DLA and one sub-DLA (at
 and 1.87519,
respectively, toward Q2314-409) from Ellison & Lopez (2001),
and two DLAs (at
and 1.87519,
respectively, toward Q2314-409) from Ellison & Lopez (2001),
and two DLAs (at
 toward Q0027-186
and 1.98888 toward Q2318-111) from Noterdaeme et al. (2007).
For the remaining cases where no neutral-phase measurements have been
published, we executed the measurements using exactly the same techniques
as in Ledoux et al. (2006).
The metal line used to measure [Z/H] is Zn II if detected, otherwise
Si II or S II, and
toward Q0027-186
and 1.98888 toward Q2318-111) from Noterdaeme et al. (2007).
For the remaining cases where no neutral-phase measurements have been
published, we executed the measurements using exactly the same techniques
as in Ledoux et al. (2006).
The metal line used to measure [Z/H] is Zn II if detected, otherwise
Si II or S II, and
 is
derived from a fit to the damping wings of the Lyman-
line.
Both zinc and silicon are found to be undepleted in DLAs (Prochaska & Wolfe 2002),
so these metallicities should not be significantly affected by dust.
We follow the standard practise of quoting metallicities on a
logarithmic scale relative to solar.
All measurements were adjusted to the solar reference levels
adopted by Morton (2003).
is
derived from a fit to the damping wings of the Lyman-
line.
Both zinc and silicon are found to be undepleted in DLAs (Prochaska & Wolfe 2002),
so these metallicities should not be significantly affected by dust.
We follow the standard practise of quoting metallicities on a
logarithmic scale relative to solar.
All measurements were adjusted to the solar reference levels
adopted by Morton (2003).
The measurements of C IV absorption in each of the 74 systems are given
in Table 1, and the C IV profiles for each system (together with an
optically thin line showing the component structure in the neutral
phase) are shown in Fig. 1.
Our sample spans a redshift range from 1.75 to 3.61 with a median of 2.34.
The values of log
range from 19.70 to 21.80 with a median of 20.65, and the metallicity [Z/H] lies between -2.59 and -0.31 with
a median of -1.36 (i.e., approximately one twentieth of the solar value).
The values of log
range from 13.02 to >15.41 (median value 14.15), with total line widths
between 35 and 1110 km s-1 (median value 187 km s-1), and velocity offsets between 0 and 425 km s-1 (median value 46 km s-1).
Histograms of the total C IV line width (using both  and
v+-v-) and C IV velocity offset are given in Fig. 2.
A significant difference between the distributions of
and
v+-v- can be seen, with the peak in the distribution at 80 km s-1, and the peak in the v+-v-distribution occurring at 200 km s-1. This difference is due
to the presence of weak, outlying components which contribute to
v+-v- but not to .
Both distributions show an extended tail
reaching over 1000 km s-1. Figure 2 also shows the distribution of mean
C IV velocities.
and
v+-v-) and C IV velocity offset are given in Fig. 2.
A significant difference between the distributions of
and
v+-v- can be seen, with the peak in the distribution at 80 km s-1, and the peak in the v+-v-distribution occurring at 200 km s-1. This difference is due
to the presence of weak, outlying components which contribute to
v+-v- but not to .
Both distributions show an extended tail
reaching over 1000 km s-1. Figure 2 also shows the distribution of mean
C IV velocities.
 |
Figure 2:
Normalized histograms of total C IV line width and absolute velocity
offset among our DLA/sub-DLA sample.
The distribution of both
(dotted) and v+-v- (solid) is shown in the top panel.
The peak of the v+-v- distribution is 100 km s-1 broader than the peak of the
distribution, reflecting the
presence of low optical depth satellite components.
There is an extended tail of line widths reaching >1000 km s-1.
We have treated the upper limits to
as data
points when forming the distribution.
The distribution of the absolute C IV velocity offset (i.e., the
mean C IV velocity relative to the neutral gas) is shown in the
lower panel. |
| Open with DEXTER |
C IV absorbers in the IGM falling at velocities within 1000 km s-1 of the DLA/sub-DLA would not necessarily be physically connected to the
system. Such IGM C IV would contaminate our sample, in particular by
contributing to the high
tail shown in the top
panel of Fig. 2. IGM contamination could be occurring in systems
where outlying, discrete components are seen at velocities
separated from the bulk of the absorption by hundreds of km s-1 (e.g.,
 toward Q0216+080,
 toward Q0438-436,
 toward Q1242+001, and
 toward Q2359-022).
However, we do not wish to exclude these absorbers from our sample,
since then we would be biased against finding high-velocity features,
such as winds. Our approach is thus to systematically include all C IV absorption in a fixed velocity interval around the system.
toward Q2359-022).
However, we do not wish to exclude these absorbers from our sample,
since then we would be biased against finding high-velocity features,
such as winds. Our approach is thus to systematically include all C IV absorption in a fixed velocity interval around the system.
We can assess the level of IGM
contamination statistically by comparing the properties of the C IV in
our sample with those of C IV in the IGM. This is shown in Fig. 3,
where we compare our DLA/sub-DLA C IV column density distribution with
the IGM distribution at -3 measured by
Boksenberg et al. (2003, data taken from their Fig. 10).
A similar IGM C IV distribution is presented by Songaila (2005).
We also include in Fig. 3 the distribution of C IV near LBGs, taken from
Table 3 in Adelberger et al. (2005); these measurements were
made by finding LBGs lying at impact parameters of <1
h70-1co-moving Mpc from QSO sight lines, and then measuring the C IV column
densities in the QSO spectra at velocities within 200 km s-1 of the
LBG redshift. Strong C IV absorption is also directly observed in LBG
spectra by Shapley et al. (2003).
The DLA/sub-DLA C IV absorbers are clearly a different
population from the IGM C IV absorbers: the DLA/sub-DLA population shows a
mean column density that is higher by almost 1 dex. The distribution of
C IV in DLAs and sub-DLAs resembles the distribution of galactic C IV as seen in LBGs, both with mean column densities near 1014 cm-2.
In consequence, the highest
systems in our sample are
least likely to be of IGM origin. Since we report below that the
highest
systems tend to show the broadest C IV,
we come to the conclusion that even the broadest C IV absorbers (that
were potentially the most suspect in terms of an association with
an individual galaxy), are likely to be galactic.
 |
Figure 3:
Comparison of the normalized C IV column density distributions:
(i) in DLAs and sub-DLAs (solid line, this work);
(ii) in the IGM at
 (dashed line; Boksenberg et al. 2003);
(iii) around LBGs at
(dotted line; Adelberger et al. 2005).
In each case,
is integrated over all components.
Note how a typical DLA/sub-DLA shows (a) considerably stronger C IV than a typical IGM C IV absorber, but (b) a C IV column similar
to the mean seen in the LBG distribution. These two findings support
our interpretation that the C IV in DLAs and sub-DLAs is galactic
rather than intergalactic.
We have included the saturated C IV absorbers as data points in the
DLA/sub-DLA distribution, using the measured lower limits; this has
the effect of artificially truncating the high
tail of
the solid line.
(dashed line; Boksenberg et al. 2003);
(iii) around LBGs at
(dotted line; Adelberger et al. 2005).
In each case,
is integrated over all components.
Note how a typical DLA/sub-DLA shows (a) considerably stronger C IV than a typical IGM C IV absorber, but (b) a C IV column similar
to the mean seen in the LBG distribution. These two findings support
our interpretation that the C IV in DLAs and sub-DLAs is galactic
rather than intergalactic.
We have included the saturated C IV absorbers as data points in the
DLA/sub-DLA distribution, using the measured lower limits; this has
the effect of artificially truncating the high
tail of
the solid line. |
| Open with DEXTER |
Table 2:
Statistical significance of correlations: Kendall  Analysis.
We now discuss correlations (or lack thereof) between the various
measured quantities in our dataset. For reference, a summary of all
correlations found and their statistical significance is given in Table 2.
In Fig. 4 we directly compare the high-ion total line width with the
low-ion total line width for each DLA and sub-DLA in the sample.
In almost all cases (69 of 74)
the C IV lines cover a wider region of velocity space than the neutral
lines; this finding has been reported by Ledoux et al. (1998) and Wolfe & Prochaska (2000a).
We also find a considerable scatter (1 dex)
in
at low
,
but the scatter
decreases with increasing
.
 |
Figure 4:
Comparison of high-ion and low-ion total line width for DLAs
(filled circles) and sub-DLAs (open circles). Absorbers at
<5000 km s-1 from the QSO redshift are highlighted in square symbols.
The dashed line shows where
 .
In 69 of 74 cases the C IV absorption is broader than the neutral
absorption.
There is a large scatter in
at low
,
but
the scatter decreases with increasing
.
Saturated C IV absorbers are shown with upper limits to
. .
In 69 of 74 cases the C IV absorption is broader than the neutral
absorption.
There is a large scatter in
at low
,
but
the scatter decreases with increasing
.
Saturated C IV absorbers are shown with upper limits to
. |
| Open with DEXTER |
We find that the C IV column density, total line width, and
velocity offset are all correlated with one another.
This is shown in Fig. 5, which
illustrates a >6.0 correlation between
and
correlation between
and
 ,
and a 4.3
correlation between
and
.
We investigated whether these two correlations were still found when
removing the proximate absorbers and the sub-DLAs from the sample,
and found that they were, at >
,
and a 4.3
correlation between
and
.
We investigated whether these two correlations were still found when
removing the proximate absorbers and the sub-DLAs from the sample,
and found that they were, at > and 3.8significance, respectively (see Table 2).
Finally, we considered the effect of the lower limits
on the
vs.
correlation, by redoing
the analysis with the saturated points excluded. We still found a
correlation, but the slope (in log-log space)
is lower by 0.6 dex in this case (see Fig. 5).
In summary, the DLAs and sub-DLAs with strong C IV absorption tend to show
broader and more offset C IV profiles.
and 3.8significance, respectively (see Table 2).
Finally, we considered the effect of the lower limits
on the
vs.
correlation, by redoing
the analysis with the saturated points excluded. We still found a
correlation, but the slope (in log-log space)
is lower by 0.6 dex in this case (see Fig. 5).
In summary, the DLAs and sub-DLAs with strong C IV absorption tend to show
broader and more offset C IV profiles.
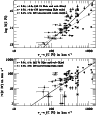 |
Figure 5:
Correlations between the measured C IV properties
for both DLAs (filled circles) and sub-DLAs (open circles).
Proximate absorbers are highlighted in square symbols.
We use v+-v- rather than
to measure the line width,
since it is defined even in the saturated cases.
We annotate the Kendall rank correlation coefficient
and its significance on the panel, for various sub-samples.
Solid lines show linear least-square bisector fits for the case
where all data points are treated equally (including limits).
Top panel: C IV column density vs. C IV line width.
A correlation is found even when excluding the saturated C IV absorbers (the lower limits on
), although in this case
the slope of the fit (shown as a dashed line) is shallower.
Bottom panel: comparison between total C IV line width and C IV absolute velocity offset, also showing a significant correlation.
These trends show that the stronger C IV absorbers tend to be broader
and more offset from the neutral gas than the weaker absorbers. |
| Open with DEXTER |
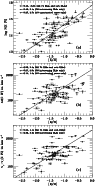 |
Figure 6:
Dependence of C IV properties in DLAs (filled circles) and sub-DLAs
(open circles) with neutral-phase metallicity. Proximate absorbers
are highlighted in square symbols.
In each panel, we annotate the Kendall rank correlation coefficient
and its significance, and we show a linear least-square
bisector fit (solid line), for the case where all data points are
treated equally (including the limits).
In panel a), we find a significant correlation between
and [Z/H]. This remains true (at 2.5)
even in
the case where the saturated points are excluded, though in this
case the slope is slightly shallower (dashed line).
In panel b), we show a 3.4
correlation between
and [Z/H], but this
correlation is not found when the saturated points are excluded
(hence there is no dashed line in this panel).
However, if we instead use
to measure the line width ( bottom panel),
since this statistic is not affected by saturation,
a significant (4.1)
metallicity-line width correlation does exist.
The detected correlations show that high-metallicity systems tend to
exhibit strong and broad C IV absorption. |
| Open with DEXTER |
We plot
vs. [Z/H] in Fig. 6 panel (a).
We emphasize that the metallicity is not derived from the C IV lines,
but is measured independently in the neutral phase of absorption,
using either the Zn II/H I, Si II/H I, or S II/H I ratio.
A Kendall rank correlation test shows that the two
quantities are correlated at >6.0
significance (where the
limits were included in the analysis).
Almost all the high-metallicity DLAs show saturated C IV lines, which
are shown with arrows to represent lower limits to
.
The correlation is still found (at 5.1)
when only using the
intervening DLAs,
and is also detected (at 3.5)
when only using the cases with
[Z/H] derived from Zn II (since these metallicities are more
robust against dust depletion effects).
Finally the correlation is still found (but only at 2.5)
when only
considering the unsaturated C IV data points (i.e., when ignoring the
lower limits).
The detection of this correlation confirms the tentative result found
in Paper I based on a much smaller sample of twelve DLAs.
A linear least-squares bisector fit to the data gives the result:
where
is expressed in cm-2, the errors
in the slope and y-intercept represent the 1
uncertainties,
and the first and second equations describe the cases where the limits
are included and excluded in the fit, respectively.
In Fig. 6 panel (b) we find evidence for a loose
correlation between metallicity and
.
A Kendall
test shows a 3.4
correlation when using
all 74 DLAs and sub-DLAs.
If we restrict the sample to the
58 DLAs at >5000 km s-1 from the QSO, to remove the effects
of sub-DLAs and proximity to the quasar, the significance of the
correlation decreases to 2.9.
Working just with the DLAs and sub-DLAs with metallicities derived
from Zn II, the significance is 2.6.
If we remove the upper limits on
(i.e., the saturated absorbers) from the sample, and redo the
correlation analysis, we find no significant detection of a
correlation between [Z/H] and
remains.
However, in a sense this is not surprising, since the saturated
absorbers tend to show broad C IV lines (Sect. 3.4),
so by removing them, we are biased against finding a trend with line
width. To further investigate whether saturation was
playing a role in setting up this metallicity-line width relation,
we looked for a correlation between [Z/H] and
As discussed in Sect. 2.3.2,
is defined even in the
saturated cases. The result was that we detected a positive
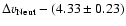
correlation at the 4.1 level.
Since we believe this metallicity-C IV line width correlation to be
one of the most important results of this paper, we investigated
whether it was seen independently in the lower- and higher-redshift
halves of the sample, and found that it was
at  significance (Fig. 7), even though the mean
metallicity of the low-redshift sample is higher than the mean
metallicity of the high-redshift sample.
Together, these results imply that the C IV line width and metallicity are correlated in DLAs and sub-DLAs.
significance (Fig. 7), even though the mean
metallicity of the low-redshift sample is higher than the mean
metallicity of the high-redshift sample.
Together, these results imply that the C IV line width and metallicity are correlated in DLAs and sub-DLAs.
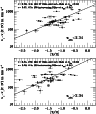 |
Figure 7:
Illustration that the correlation between C IV total line width and
metallicity exists independently in the lower and
upper redshift halves of the sample, even though
there is a difference between the mean metallicity of the two
sub-samples (the lower-z sample shows systematically higher [Z/H]).
The symbols have their same meanings as in Fig. 6.
All DLAs and sub-DLAs in each redshift range were included in the
correlation analysis and in the linear bisector fits, shown with
solid lines. |
| Open with DEXTER |
Using the sample of 74 DLAs and sub-DLAs,
the best-fit linear least-squares bisector model is:
![\begin{displaymath}{\rm [Z/H]}=(1.4\pm0.1){\rm log}~\Delta v_{C {\sc iv}}-(4.6\pm0.5),
\end{displaymath}](/articles/aa/full/2007/39/aa7640-07/img77.gif) |
(2) |
where again the errors are the 1
uncertainties, and where
 is in km s-1. The slope of this relation is similar to
that found for the low-ion total line width/metallicity correlation by
Ledoux et al. (2006), who report
[Z/H] = (1.55 0.12)log
is in km s-1. The slope of this relation is similar to
that found for the low-ion total line width/metallicity correlation by
Ledoux et al. (2006), who report
[Z/H] = (1.55 0.12)log
 .
However, we observe a large dispersion in total C IV line width at a given
metallicity, far larger than the measurement errors,
and also larger than the dispersion seen in the low-ion line
width/metallicity correlation.
.
However, we observe a large dispersion in total C IV line width at a given
metallicity, far larger than the measurement errors,
and also larger than the dispersion seen in the low-ion line
width/metallicity correlation.
There are four DLAs
(at
 toward Q0112+306,
 toward Q2206-199,
 toward Q2222-396, and
 toward Q2344+125),
and one sub-DLA (at
toward Q2344+125),
and one sub-DLA (at
 toward Q1451+123)
that stand out in Figs. 6b and c
due to their unusual properties. These absorbers show
narrow C IV lines (
toward Q1451+123)
that stand out in Figs. 6b and c
due to their unusual properties. These absorbers show
narrow C IV lines (
 km s-1 in all cases),
low velocity offsets (
km s-1 in all cases),
low velocity offsets (
 km s-1 in four of five
cases), and low metallicities ([Z/H] between -2.42 and -1.81).
These cases play a significant
role in generating the correlations discussed here.
km s-1 in four of five
cases), and low metallicities ([Z/H] between -2.42 and -1.81).
These cases play a significant
role in generating the correlations discussed here.
Over our sample of 74 DLAs and sub-DLAs, the mean value of
 is 69 km s-1.
is not correlated with the metallicity.
However, the absolute maximum C IV velocity
is correlated with the metallicity at the 2.9level (not shown in figures, but see Table 2).
The significance of this correlation decreases to 2.6
when
just using the intervening DLA sample.
Saturation has no effect on the maximum C IV velocity, so we included
the saturated C IV absorbers in this correlation analysis.
We note that
reaches over 200 km s-1 in 42 cases, and
>500 km s-1 in 8 cases.
is 69 km s-1.
is not correlated with the metallicity.
However, the absolute maximum C IV velocity
is correlated with the metallicity at the 2.9level (not shown in figures, but see Table 2).
The significance of this correlation decreases to 2.6
when
just using the intervening DLA sample.
Saturation has no effect on the maximum C IV velocity, so we included
the saturated C IV absorbers in this correlation analysis.
We note that
reaches over 200 km s-1 in 42 cases, and
>500 km s-1 in 8 cases.
We find that none of the C IV properties (column density, total line
width, and mean velocity) correlate with
,
even though our sample covers two
orders of magnitude in
.
In Table 3 we compare the observed properties of C IV absorption in
DLAs (log
)
with
those in sub-DLAs (log
 ).
There is no significant
difference between the two populations in mean column density,
mean total line width, or mean velocity offset from the neutral gas.
However, if we assume that the ionization fraction C IV/C is the same
in all systems, then the DLAs tend to show larger H II column
densities than the sub-DLAs (see Sect. 3.9).
).
There is no significant
difference between the two populations in mean column density,
mean total line width, or mean velocity offset from the neutral gas.
However, if we assume that the ionization fraction C IV/C is the same
in all systems, then the DLAs tend to show larger H II column
densities than the sub-DLAs (see Sect. 3.9).
The differences between proximate DLAs and intervening DLAs have
been studied in recent years (Prochaska et al. 2007b; Russell et al. 2006; Ellison et al. 2002; Hennawi & Prochaska 2007).
Here we compare the properties of the C IV absorption in proximate
and intervening DLAs and sub-DLAs. These results are relevant to claims
that photoevaporation by the quasar reduces the H I cross-section in
proximate DLAs (Prochaska et al. 2007b; Hennawi & Prochaska 2007).
We find no evidence for a higher degree of ionization in the proximate
systems. Indeed, the mean C IV column densities and total line
widths in the proximate systems are slightly lower than the
corresponding values in the intervening systems. However, our current
proximate sample with C IV only contains seven systems, so further
data are needed before strong conclusions can be drawn.
Table 3:
DLAs vs. sub-DLAs, and intervening vs. proximate systems.
One of the key conclusions of Paper I was that,
if the ionized and neutral phases of DLA have the same metallicity, then
the H II column density in the O VI phase typically amounts to
>40% of the H I column density in the neutral phase, and
that
 in the C IV phase amounts to a further >20% of
.
These percentages are important since they determine the
total quantity of baryons and metals hidden in the ionized gas. With
the much larger sample in this paper, we are able to improve upon the
second of these estimates.
in the C IV phase is calculated by:
in the C IV phase amounts to a further >20% of
.
These percentages are important since they determine the
total quantity of baryons and metals hidden in the ionized gas. With
the much larger sample in this paper, we are able to improve upon the
second of these estimates.
in the C IV phase is calculated by:
![\begin{displaymath}N_{\rm H {\sc ii}}=\frac{N_{\rm C {\sc iv}}}{f_{\rm C {\sc iv...
...}}({\rm C/H})_\odot10^{\rm [Z/H]}}
\frac{Z_{\rm N}}{Z_{\rm I}}
\end{displaymath}](/articles/aa/full/2007/39/aa7640-07/img93.gif) |
(3) |
where
 is the C IV ionization
fraction, and
is the C IV ionization
fraction, and  and
and  are shorthands for the
absolute metallicities in the neutral and ionized gas.
We have assumed a solar elemental abundance pattern, so that
[C/H] = [Z/H], and we take the solar carbon abundance C/H =
10-3.61from Allende Prieto et al. (2002).
We assume that
are shorthands for the
absolute metallicities in the neutral and ionized gas.
We have assumed a solar elemental abundance pattern, so that
[C/H] = [Z/H], and we take the solar carbon abundance C/H =
10-3.61from Allende Prieto et al. (2002).
We assume that
 ,
though values <1 are possible
in a scenario where metal-rich, ionized supernova ejecta has yet to
mix with the general interstellar medium (ISM), and values >1 are
possible in an accretion scenario.
Finally, we assume that
,
though values <1 are possible
in a scenario where metal-rich, ionized supernova ejecta has yet to
mix with the general interstellar medium (ISM), and values >1 are
possible in an accretion scenario.
Finally, we assume that
 ,
since in Paper I we found this is
the maximum amount allowed in either photoionization
(Ferland et al. 1998) or collisional ionization (Gnat & Sternberg 2007) models, and so it
gives the most conservative (lowest) value of
.
Lower values of
,
since in Paper I we found this is
the maximum amount allowed in either photoionization
(Ferland et al. 1998) or collisional ionization (Gnat & Sternberg 2007) models, and so it
gives the most conservative (lowest) value of
.
Lower values of
 would increase the
estimates.
would increase the
estimates.
The resulting values of
are shown in Fig. 8.
Based on the 74 systems in this sample, we find
that the mean and standard deviation of the warm ionized-to-neutral
ratio is
 ,
i.e. the C IV phase contains >10% of the baryons of the neutral phase.
The sub-DLAs show a mean log
of 19.33, whereas the
DLAs show a mean log
of 19.77, a factor of 2.2
higher.
This is because sub-DLAs show (on average) similar C IV columns as
DLAs, but higher metallicities.
We note in the lower panel of Fig. 8 that there is no trend
for
,
which is
,
i.e. the C IV phase contains >10% of the baryons of the neutral phase.
The sub-DLAs show a mean log
of 19.33, whereas the
DLAs show a mean log
of 19.77, a factor of 2.2
higher.
This is because sub-DLAs show (on average) similar C IV columns as
DLAs, but higher metallicities.
We note in the lower panel of Fig. 8 that there is no trend
for
,
which is  /(Z/H),
to depend on metallicity (although such a trend could be partly hidden by the
saturation of C IV in high metallicity systems).
Thus, the correlation reported in Sect. 3.4
between
and
[Z/H] appears to be a simple consequence of the metallicity alone, but
does not imply that there is more ionized gas (i.e. more H II) in the
high-metallicity systems.
We also note that the scatter in
is substantial, of order
2 dex in
at values of [Z/H] between -2.0 and -1.0.
/(Z/H),
to depend on metallicity (although such a trend could be partly hidden by the
saturation of C IV in high metallicity systems).
Thus, the correlation reported in Sect. 3.4
between
and
[Z/H] appears to be a simple consequence of the metallicity alone, but
does not imply that there is more ionized gas (i.e. more H II) in the
high-metallicity systems.
We also note that the scatter in
is substantial, of order
2 dex in
at values of [Z/H] between -2.0 and -1.0.
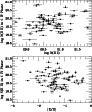 |
Figure 8:
Comparison of H II column density in the C IV-bearing
gas integrated over all velocities
with ( top)
and ( bottom) [Z/H]
for each system in our sample, assuming an ionization fraction
 .
The average value of the ratio N(H II)/N(H I) over all 74 systems is
0.1, implying that the C IV phase of DLAs and sub-DLAs typically contains
>10% of the baryons and metals in the neutral phase.
The mean value of
is 2.5 times lower in
sub-DLAs than in DLAs. .
The average value of the ratio N(H II)/N(H I) over all 74 systems is
0.1, implying that the C IV phase of DLAs and sub-DLAs typically contains
>10% of the baryons and metals in the neutral phase.
The mean value of
is 2.5 times lower in
sub-DLAs than in DLAs. |
| Open with DEXTER |
The cooling rate  in diffuse interstellar gas is directly
proportional to the
in diffuse interstellar gas is directly
proportional to the
 ratio,
according to
ratio,
according to
 erg s-1 per H atom, where
 is the Einstein
A coefficient and
is the Einstein
A coefficient and
 the energy of the 158
  m line
(Pottasch 1979).
The cooling rate is of interest since it is equivalent to the
heating rate, because the cooling time is shorter than the dynamical time (Wolfe et al. 2003a,b). In turn, the heating rate
will be related to the intensity of UV radiation and the dust-to-gas
ratio, and ultimately to the star formation rate per unit area.
m line
(Pottasch 1979).
The cooling rate is of interest since it is equivalent to the
heating rate, because the cooling time is shorter than the dynamical time (Wolfe et al. 2003a,b). In turn, the heating rate
will be related to the intensity of UV radiation and the dust-to-gas
ratio, and ultimately to the star formation rate per unit area.
We searched the literature for C II* measurements in our sample of
DLAs/sub-DLAs with C IV. We took 20 data points (11 measurements and 9 upper
limits) from Srianand et al. (2005), 9 measurements from Wolfe et al. (2003a), and one
from Heinmüller et al. (2006). In Fig. 9, we directly compare the cooling rate
with the C IV column density.
Below log
 ,
there is no trend evident in the data.
However, we find that the seven points with the highest
are among the systems with the highest cooling rate.
Even though a formal correlation between the cooling rate and
is detected only at the 1.8
level (the C II* upper limits were excluded in this analysis), we note that the
the median logarithmic C IV column density among the systems with
log
,
there is no trend evident in the data.
However, we find that the seven points with the highest
are among the systems with the highest cooling rate.
Even though a formal correlation between the cooling rate and
is detected only at the 1.8
level (the C II* upper limits were excluded in this analysis), we note that the
the median logarithmic C IV column density among the systems with
log
 is 13.86, whereas
the median among the systems with
log
is 13.86, whereas
the median among the systems with
log
 is 14.83.
This finding is consistent with the results of
Wolfe (2007, in preparation), who finds
evidence for bimodality in DLAs based on the cooling rate,
in the form of significant differences between the metallicities
and velocity widths of those DLAs with cooling rates below and above a
critical value
is 14.83.
This finding is consistent with the results of
Wolfe (2007, in preparation), who finds
evidence for bimodality in DLAs based on the cooling rate,
in the form of significant differences between the metallicities
and velocity widths of those DLAs with cooling rates below and above a
critical value
 erg s-1 H-1.
 |
Figure 9:
Dependence of the C IV column density on the cooling rate derived from the
ratio, for each DLA (filled circles) and
sub-DLA (open circles) where data on C IV and C II* exist.
Color-coding is used to denote the metallicity of the gas, as
indicated in the legend.
The seven data points with the highest
all show
above-average cooling rates. Among these seven,
six show high metallicities. |
| Open with DEXTER |
There are two physical processes that can provide the 47.9 eV
required to ionize C+2 to C+3, and so create the gas seen in
C IV: photoionization and collisional ionization.
In Paper I it was shown (see Fig. 3b in that paper)
that the line widths of at least one
fifth of the C IV components observed
in DLAs are narrow ( km s-1), implying that in these
components, the gas is cool (
km s-1), implying that in these
components, the gas is cool (
 K), which likely implies
collisional ionization is unimportant, and that photoionization is
the ionization mechanism.
These narrow components are not seen in O VI.
The detection of cool C IV components rules out the idea
that all the C IV in DLAs arises in a hot halo
(see Mo & Miralda-Escudé 1996; Maller et al. 2003).
The source of the extreme-ultraviolet (EUV) radiation at 259 Å that photoionizes C+2 to C+3 and gives rise to the narrow
C IV components could be external (the extragalactic background)
or internal (O- and B-type stars in the DLA host galaxies).
Discussions of the relative importance of internal and external
radiation in DLAs are given by Howk & Sembach (1999), Miralda-Escudé (2005), and Schaye (2006).
Note that in the Milky Way, Bregman & Harrington (1986) found that planetary
nebulae are the dominant source of photons in the range 45-54 eV,
but DLA galaxies at z>2 are likely too young for planetary nebulae to
have formed.
K), which likely implies
collisional ionization is unimportant, and that photoionization is
the ionization mechanism.
These narrow components are not seen in O VI.
The detection of cool C IV components rules out the idea
that all the C IV in DLAs arises in a hot halo
(see Mo & Miralda-Escudé 1996; Maller et al. 2003).
The source of the extreme-ultraviolet (EUV) radiation at 259 Å that photoionizes C+2 to C+3 and gives rise to the narrow
C IV components could be external (the extragalactic background)
or internal (O- and B-type stars in the DLA host galaxies).
Discussions of the relative importance of internal and external
radiation in DLAs are given by Howk & Sembach (1999), Miralda-Escudé (2005), and Schaye (2006).
Note that in the Milky Way, Bregman & Harrington (1986) found that planetary
nebulae are the dominant source of photons in the range 45-54 eV,
but DLA galaxies at z>2 are likely too young for planetary nebulae to
have formed.
We propose that the broad C IV components arise in the hotter phase of DLA
plasma that is detected in O VI absorption (Paper I), i.e. the hot
ionized medium. This phase will arise following either heat input from
supernova in the DLA host galaxy, or by the shock-heating of
infalling gas at the virial radius. In the first case, the hot ionized
medium may exist in the form of a wind (Kawata & Rauch 2007; Fangano et al. 2007; Oppenheimer & Davé 2006),
though Galactic fountain scenarios are also possible (Bregman 1980; Houck & Bregman 1990; Shapiro & Field 1976).
The observation that up to 80% of the C IV components are
broad is consistent with the origin of the C IV in a wind,
since in the models of Oppenheimer & Davé (2006), much of the
C IV in galactic winds is collisionally ionized.
We note that type II supernovae will heat interstellar gas to temperatures
>106 K, too high for the formation of O VI and C IV lines, and
left to itself, gas at a density of 10-3 cm-3 and
one-hundredth of the solar metallicity will not cool in a Hubble time.
However, if the hot plasma interacts with cool or warm entrained clouds,
conductive interfaces (Borkowski et al. 1990), turbulent mixing layers
(Esquivel et al. 2006; Slavin et al. 1993), or shock fronts (Dopita & Sutherland 1996)
can form between the hot and cool phases, in which
the temperatures are favorable for the formation of O VI and C IV lines. These mechanisms, which have been invoked to explain high-ion
observations
in the extended halo of the Milky Way (Savage et al. 2003; Zsargó et al. 2003; Indebetouw & Shull 2004),
in high-velocity clouds (Fox et al. 2004; Collins et al. 2005; Fox et al. 2005; Sembach et al. 2003), and in the Large
Magellanic Cloud (Lehner & Howk 2007), can explain the broader C IV and O VI components seen in the DLAs and sub-DLAs.
Note that the interpretation of broad high-ion components in
DLAs and sub-DLAs as hot and collisionally ionized is different from the
interpretation of the O VI components in the IGM at ,
which (generally) appear to be photoionized (Lopez et al. 2007; Carswell et al. 2002; Bergeron & Herbert-Fort 2005; Bergeron et al. 2002; Levshakov et al. 2003; Reimers et al. 2006), though see Reimers et al. (2001) and Simcoe et al. (2006,2002).
Ledoux et al. (2006) have presented a [Z/H]-
correlation in DLAs and sub-DLAs, and have interpreted it as implying
an underlying mass-metallicity relation (see also Wolfe & Prochaska 1998; Ledoux et al. 1998; Prochaska et al. 2007a; Murphy et al. 2007).
In this interpretation,
traces motions due to gravity.
Since we find that
is larger than
in almost all cases, an additional energy source
is required to heat and accelerate the C IV clouds.
We suggest that star formation and subsequent supernovae could provide
this source. Star formation in DLA and sub-DLA galaxies will lead to:
- (i)
- metals generated by stellar nucleosynthesis;
- (ii)
- EUV flux from OB stars that can photoionize C+2 to C+3 in
interstellar gas, giving rise to the narrow C IV components;
- (iii)
- supernovae-heated million-degree plasma, which can interact with
entrained clouds of cooler gas to produce gas at
 K, where
O VI and C IV components are formed through electron collisions;
K, where
O VI and C IV components are formed through electron collisions;
- (iv)
- mechanical energy injection from supernovae and stellar winds
imparting large total velocity widths to the high ions.
Because star formation leads to metals and to feedback
(i.e. mechanical energy injection into the ISM), this scenario would
naturally explain the correlation between [Z/H] and
.
However, we cannot rule out an alternative scenario in which the
plasma phases in DLAs and sub-DLAs are formed following the accretion
of infalling, intergalactic gas, rather than by star formation
(e.g. Wolfe & Prochaska 2000b). The inflow model can also qualitatively explain the
metallicity-C IV line width correlation: the more massive halos
(which through the mass-metallicity relationship tend to show higher
metallicities) would induce higher accretion rates because of their
deeper potential wells, and so could create and disperse the C IV over
large velocity ranges.
Our dataset shows that C IV components in DLAs and sub-DLAs exist over
a broad velocity range, with a median
of
187 km s-1, which is approximately twice as broad as the typical
velocity spread seen in the neutral gas.
The terminal C IV velocities reach >200 km s-1 in 42/74 systems,
and >500 km s-1 in 8/74 systems, and are correlated with the
metallicity. Together, this evidence implies that the high ions in
DLAs and sub-DLAs trace highly disturbed kinematic environments.
In this section we identify a population of high-velocity C IV components with intriguing ionization properties, and
we address whether these components could be created by galactic outflows.
In order to evaluate whether any of the observed C IV components
represent winds, we need to determine the escape velocity in each
system. We calculate this using
 ,
an empirical relation found from
analysis of artificial spectra in the simulations of Haehnelt et al. (1998) and
Maller et al. (2001). There is a factor of two dispersion around this
relation, due to variations in the viewing angle.
We then take
,
an empirical relation found from
analysis of artificial spectra in the simulations of Haehnelt et al. (1998) and
Maller et al. (2001). There is a factor of two dispersion around this
relation, due to variations in the viewing angle.
We then take
 (appropriate for a
spherical halo), so that
(appropriate for a
spherical halo), so that
 .
The escape speed we have assumed can be taken as an upper limit,
because
is calculated in the disk and will decrease with
radius, and we may be observing C IV at high radii.
We have not accounted for drag forces arising due to entrainment
between the winds and the galaxy's ISM (Finlator & Davé 2007).
.
The escape speed we have assumed can be taken as an upper limit,
because
is calculated in the disk and will decrease with
radius, and we may be observing C IV at high radii.
We have not accounted for drag forces arising due to entrainment
between the winds and the galaxy's ISM (Finlator & Davé 2007).
When we search for C IV absorption at
 and
and
 ,
we find it in 25 of 63 DLAs and 4 of 11 sub-DLAs, i.e.
C IV absorption unbound from the central potential well
exists in 40% of cases.
These absorbers, which we refer to as wind candidates, are colored with dark
shading in Fig. 1, for easy identification.
A key property of the wind candidate absorbers is the low column
density of the accompanying neutral gas absorption.
In this respect, the wind candidates are analogous to the highly
ionized high-velocity clouds seen in the vicinity of the Milky Way
(Sembach et al. 1999; Fox et al. 2006; Collins et al. 2004; Ganguly et al. 2005; Fox et al. 2005; Collins et al. 2005; Sembach et al. 1995,2003).
They also resemble the
,
we find it in 25 of 63 DLAs and 4 of 11 sub-DLAs, i.e.
C IV absorption unbound from the central potential well
exists in 40% of cases.
These absorbers, which we refer to as wind candidates, are colored with dark
shading in Fig. 1, for easy identification.
A key property of the wind candidate absorbers is the low column
density of the accompanying neutral gas absorption.
In this respect, the wind candidates are analogous to the highly
ionized high-velocity clouds seen in the vicinity of the Milky Way
(Sembach et al. 1999; Fox et al. 2006; Collins et al. 2004; Ganguly et al. 2005; Fox et al. 2005; Collins et al. 2005; Sembach et al. 1995,2003).
They also resemble the  C IV absorbers reported by
Ryan-Weber et al. (2006).
In a handful of cases, wind candidates are seen at both redshifted and
blueshifted velocities in the same system.
In Fig. 10 (top panel) we
plot the absolute wind C IV columns as a function of metallicity.
We find similar C IV wind column densities in systems that span the
2.5 dex range of metallicity in our sample, even in the
highest metallicity systems.
C IV absorbers reported by
Ryan-Weber et al. (2006).
In a handful of cases, wind candidates are seen at both redshifted and
blueshifted velocities in the same system.
In Fig. 10 (top panel) we
plot the absolute wind C IV columns as a function of metallicity.
We find similar C IV wind column densities in systems that span the
2.5 dex range of metallicity in our sample, even in the
highest metallicity systems.
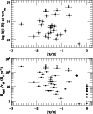 |
Figure 10:
Top panel: C IV column density moving above the escape speed
(i.e. wind candidate
)
as a function of metallicity,
for the 25 DLAs and 4 sub-DLAs with C IV absorption at
 ,
where ,
where
 .
Bottom panel: wind mass outflow rate .
Bottom panel: wind mass outflow rate
 divided by characteristic C IV radius r40 (in units of 40 kpc)
vs metallicity.
The median mass outflow rate among these cases is 22r40 yr-1.
The large diamond shows the mass outflow rate determined in the
z=2.7 Lyman Break Galaxy cB58 by Pettini et al. (2000), assuming r=1 kpc.
The filled triangles are the mass flow rates determined for the
cool winds in the Martin (2006) sample of low-redshift ultraluminous
starburst galaxies and plotted at zero metallicity for convenience. Only the DLA and sub-DLA points have been divided by r40.
divided by characteristic C IV radius r40 (in units of 40 kpc)
vs metallicity.
The median mass outflow rate among these cases is 22r40 yr-1.
The large diamond shows the mass outflow rate determined in the
z=2.7 Lyman Break Galaxy cB58 by Pettini et al. (2000), assuming r=1 kpc.
The filled triangles are the mass flow rates determined for the
cool winds in the Martin (2006) sample of low-redshift ultraluminous
starburst galaxies and plotted at zero metallicity for convenience. Only the DLA and sub-DLA points have been divided by r40. |
| Open with DEXTER |
Our results are surprising when viewed in the light of simulations of
galactic outflows, which show that dwarf galaxies are more
important than massive galaxies for the metal pollution of the
intergalactic medium
(Nagamine et al. 2004b; Scannapieco et al. 2006b; Ferrara et al. 2000; Tissera et al. 2006; Mac-Low & Ferrara 1999; Kobayashi et al. 2007),
since they are incapable of gravitationally confining the
metals released by supernovae. The increase in wind escape fraction
with decreasing galactic mass may contribute to the
origin of the mass-metallicity relationship observed in DLAs and other
high-redshift galaxies (Tremonti et al. 2004; Erb et al. 2006; Møller et al. 2004; Nagamine et al. 2004a; Savaglio et al. 2005).
The surprising result here is that, given the mass-metallicity
relation, the higher metallicity (higher mass) galaxies should
decelerate their supernova-driven outflows, so that C IV outflows should
not be seen in the high-metallicity systems, but yet we observe the
high-velocity components even in systems with
![$\rm [Z/H]>-1.0$](/articles/aa/full/2007/39/aa7640-07/img125.gif) .
Furthermore, we find that the maximum outflow
velocity
is correlated to the metallicity.
.
Furthermore, we find that the maximum outflow
velocity
is correlated to the metallicity.
For any individual C IV component, it is difficult
to determine conclusively whether one is seeing a galactic outflow
from the DLA galaxy (see Fangano et al. 2007).
Two other plausible origins are inflow toward the DLA galaxy
(Wolfe & Prochaska 2000b), and the ISM of a separate nearby galaxy.
A contribution of C IV from these processes
could help to explain both the scatter seen in each
panel in Fig. 6, and the cases with large values for
.
One weakness of the inflow model is that accretion would accelerate
the gas up to but not beyond the escape velocity,
but yet we see gas moving above the escape velocity.
Thus inflow cannot explain the highest-velocity C IV components.
The nearby galaxy model has the problem of not readily explaining why the
ionized-to-neutral gas ratio is so high in the high-velocity
C IV components. In other words, if nearby galaxies are
responsible for the high-velocity C IV components, where is their
neutral ISM?
The outflow explanation, on the other hand, naturally explains the
velocities and the ionization properties of the high-velocity C IV absorbers.
The outflow model also explains the presence of
metals in the ionized gas (they came from the DLA host galaxy), so it
does not need to resort to pre-enrichment.
A more serious problem is whether we can associate a single DLA with a
single galaxy. This assumption may be false since the clustering
of galaxies near DLAs has been observed both at low (Chen & Lanzetta 2003) and
high (Cooke et al. 2006a; Ellison et al. 2007; Bouché & Lowenthal 2004,2003; Cooke et al. 2006b) redshift.
Our wind interpretation implicitly assumes that each high-velocity C IV component arose from a galaxy located in velocity at the point where
the neutral line absorption is strongest.
We present in this section a calculation of
order-of-magnitude estimates for the mass M, kinetic energy  ,
mass flow rate
,
mass flow rate  ,
and flux of kinetic energy
,
and flux of kinetic energy
 in the C IV wind candidate absorbers.
These calculations are analogous to those used to measure the
energetics of winds in starburst galaxies (Heckman et al. 2000; Martin 2005,2006) and
LBGs (Pettini et al. 2000).
in the C IV wind candidate absorbers.
These calculations are analogous to those used to measure the
energetics of winds in starburst galaxies (Heckman et al. 2000; Martin 2005,2006) and
LBGs (Pettini et al. 2000).
We assume that the outflow exists in an expanding hemispherical shell
moving at velocity v relative to the neutral gas in the DLA galaxy
(we do not assume a full spherical outflow, since we do not generally
see two components corresponding to the near and far side of the galaxy).
We then calculate M, ,
,
and
using the following equations:
| M |
= |
 |
(4) |
 |
= |
 |
(5) |
 |
= |
 |
(6) |
 |
= |
 |
(7) |
Here  is the mean molecular weight,
  is the mass of
a hydrogen atom, and
is calculated using Eq. (3).
It can be seen that these four quantities are proportional to the zeroth,
first, second, and third moments of the C IV optical depth profile.
The wind mass flow rates are shown in the lower panel of Fig. 10.
They were calculated by taking the average
of the escape velocity and the terminal velocity for
is the mass of
a hydrogen atom, and
is calculated using Eq. (3).
It can be seen that these four quantities are proportional to the zeroth,
first, second, and third moments of the C IV optical depth profile.
The wind mass flow rates are shown in the lower panel of Fig. 10.
They were calculated by taking the average
of the escape velocity and the terminal velocity for  ,
and
deriving
with Eq. (3) only for that portion of the C IV absorption at
,
and
deriving
with Eq. (3) only for that portion of the C IV absorption at
 .
We only have information on the line-of-sight
velocity (not the full 3D velocity), but since the
line-of-sight passes through a DLA or sub-DLA, we assume we are looking
through the full depth of the galactic halo, so that the line-of-sight
velocity we measure approximates the radial velocity of the outflowing gas.
.
We only have information on the line-of-sight
velocity (not the full 3D velocity), but since the
line-of-sight passes through a DLA or sub-DLA, we assume we are looking
through the full depth of the galactic halo, so that the line-of-sight
velocity we measure approximates the radial velocity of the outflowing gas.
The only quantity which is not directly measured is the characteristic
radius r. If we take a reference value of
r=40 kpc, as determined for C IV around LBGs by Adelberger et al. (2005), we find that
the 29 C IV wind candidates typically contain (median values)
a total mass of
 ,
a kinetic energy of
,
a kinetic energy of
 erg,
a mass flow rate of 22 yr-1,
and a kinetic energy injection rate of
erg,
a mass flow rate of 22 yr-1,
and a kinetic energy injection rate of
 erg s-1.
To put these wind mass flow rates in perspective,
Pettini et al. (2002,2000) report a mass flow rate of 60 yr-1 for the
outflow from the z=2.7 LBG MS 1512-cB58, and
Martin (2006) calculate the mass loss rates in the cool
winds of a sample of low-redshift ultraluminous starburst galaxies as
between 1 and >14 yr-1.
erg s-1.
To put these wind mass flow rates in perspective,
Pettini et al. (2002,2000) report a mass flow rate of 60 yr-1 for the
outflow from the z=2.7 LBG MS 1512-cB58, and
Martin (2006) calculate the mass loss rates in the cool
winds of a sample of low-redshift ultraluminous starburst galaxies as
between 1 and >14 yr-1.
We calculate that the thermal energy in the C IV wind absorbers is
only a few percent of their kinetic energy (assuming a temperature of
105 K).
Assuming the clouds fill a region whose depth is similar to its width,
a 40 kpc depth and
 cm-2 correspond to a density of
 cm-3, assuming a filling factor of
unity. In turn, such a medium would exhibit a thermal pressure
cm-3, assuming a filling factor of
unity. In turn, such a medium would exhibit a thermal pressure
 cm-3 K. If the C IV arose in interface layers between entrained cool/warm clouds and a
surrounding hot gas, then the line-of-sight filling factor would be
much lower and the C IV could exist in higher-density,
higher-pressure, localized regions.
cm-3 K. If the C IV arose in interface layers between entrained cool/warm clouds and a
surrounding hot gas, then the line-of-sight filling factor would be
much lower and the C IV could exist in higher-density,
higher-pressure, localized regions.
Among the 25 DLAs and 4 sub-DLAs showing wind candidate components,
the median rate at which each galaxy delivers metals to the IGM is
 yr-1.
This estimate is robust to changes in the metallicity of the ionized
gas with respect to the neutral gas.
Assuming that the outflows are driven by the supernovae that follow
star formation, we can calculate the star formation rate
necessary to power the observed C IV outflows.
We use the relation from Efstathiou (2000) between kinetic energy injection
rate and star formation rate,
yr-1.
This estimate is robust to changes in the metallicity of the ionized
gas with respect to the neutral gas.
Assuming that the outflows are driven by the supernovae that follow
star formation, we can calculate the star formation rate
necessary to power the observed C IV outflows.
We use the relation from Efstathiou (2000) between kinetic energy injection
rate and star formation rate,
 erg s-1,
with
erg s-1,
with
 in yr-1.
Equating
in yr-1.
Equating
 to the observed mean flux of kinetic energy, we
find a median required SFR per DLA of 2 yr-1,
corresponding (with our assumed r=40 kpc)
to a required SFR per unit area (
to the observed mean flux of kinetic energy, we
find a median required SFR per DLA of 2 yr-1,
corresponding (with our assumed r=40 kpc)
to a required SFR per unit area (
 )
of
)
of
 yr-1 kpc-2.
This is consistent with (though close to) the limit on the SFR per
unit area derived from low surface brightness features (i.e. DLA
analogs) in the Hubble Ultra-Deep Field by
Wolfe & Chen (2006), who report
yr-1 kpc-2.
This is consistent with (though close to) the limit on the SFR per
unit area derived from low surface brightness features (i.e. DLA
analogs) in the Hubble Ultra-Deep Field by
Wolfe & Chen (2006), who report
 yr-1 kpc-2.
We thus conclude that, at least to an order-of-magnitude, there is
sufficient energy released following star formation to drive the
observed high-velocity C IV components in DLAs, supporting the notion
that they trace galactic winds.
yr-1 kpc-2.
We thus conclude that, at least to an order-of-magnitude, there is
sufficient energy released following star formation to drive the
observed high-velocity C IV components in DLAs, supporting the notion
that they trace galactic winds.
We analyzed the C IV absorption in 63 DLAs and 11 sub-DLAs
in the range
observed with VLT/UVES.
We measured the properties of the C IV absorption in each system and
investigated how they depend on the properties of the neutral gas.
In most systems the metallicity, H I column density, and line width
in the neutral gas had already been measured.
We executed the neutral gas measurements for the remaining cases.
This study has led us to find that:
- 1.
- The C IV absorption line profiles are complex, showing
both narrow (
 km s-1) and broad (
 km s-1)
components, which trace cool, photoionized and
hot, collisionally ionized gas, respectively (we used O VI to study
the hot gas in Paper I).
km s-1)
components, which trace cool, photoionized and
hot, collisionally ionized gas, respectively (we used O VI to study
the hot gas in Paper I).
- 2.
- The median C IV column densities in DLAs and sub-DLAs
[
 log
log
 (DLA)
(DLA)
 ]
are substantially higher than typical IGM values
[log
(IGM)
]
are substantially higher than typical IGM values
[log
(IGM)
 ],
but similar to those seen in LBGs
[log
(LBG)
],
but similar to those seen in LBGs
[log
(LBG)
 ].
].
- 3.
- The total C IV line width is broader than the total neutral line width
in 69 of 74 cases.
- 4.
- The total C IV column density, line width, and velocity offset
in the DLAs and sub-DLAs are all correlated, so the strongest C IV absorbers also tend to be the broadest and most offset relative to
the neutral gas.
- 5.
- The total C IV column density is correlated with the
neutral-phase metallicity. The significance of this correlation is
>6.0,
and it is found even when the saturated cases, the proximate DLAs,
and the sub-DLAs are excluded.
- 6.
- The total C IV line width is weakly correlated with the
neutral-phase metallicity. This correlation is detected at
 significance (using
to measure the total line width),
and is found independently in the lower-
and upper- redshift halves of the sample. The slope of the
metallicity/high-ion line width relation is similar to the slope of the
metallicity/low-ion line width relation reported by Ledoux et al. (2006).
significance (using
to measure the total line width),
and is found independently in the lower-
and upper- redshift halves of the sample. The slope of the
metallicity/high-ion line width relation is similar to the slope of the
metallicity/low-ion line width relation reported by Ledoux et al. (2006).
- 7.
- None of the C IV properties (column density, line width, central
velocity) correlate with the H I column density, even though our
sample spans a factor of 100 in
.
Indeed, though we only have 11 sub-DLAs against 63 DLAs, the
mean values of log N, ,
and
are the same in DLAs
as in sub-DLAs.
However, assuming a constant ionization correction
,
then the sub-DLAs show a mean
of 19.36, whereas the
DLAs show a mean
of 19.77, a factor of 2.5 higher.
This is because sub-DLAs show (on average) similar C IV columns but
higher metallicities.
- 8.
- We find slightly lower mean C IV column densities and total line
widths among the seven proximate DLAs/sub-DLAs than among the 67
intervening systems. This trend is worth investigating using a
larger proximate sample.
- 9.
- The mean velocity offset between the C IV and the neutral gas
has a mean value of 69 km s-1 over our 74 DLAs and
sub-DLAs, implying a net amount of outflow or inflow is present.
The maximum observed C IV velocity
reaches
>200 km s-1 in 42/74 cases, and >500 km s-1 in eight cases.
is correlated with
the metallicity at the 2.9 level.
- 10.
- We calculate the escape velocity from the width of the neutral
line absorption. We observe C IV moving above the escape velocity in
25 DLAs and 4 sub-DLAs, covering 2.5 orders of magnitude of
[Z/H]. In other words, C IV clouds that are unbound from the central
potential well are seen in 40% of DLAs and sub-DLAs.
Assuming a characteristic C IV radius of 40 kpc,
these wind candidate absorbers show typical (median) masses of
,
kinetic energies of
erg, mass flow rates of
22 yr-1, and kinetic energy injection rates
 erg s-1.
The typical value for
requires a
SFR per DLA of 2 yr-1, or a SFR per unit area of
yr-1 kpc-2, to power the winds.
erg s-1.
The typical value for
requires a
SFR per DLA of 2 yr-1, or a SFR per unit area of
yr-1 kpc-2, to power the winds.
We conclude with several remarks concerning the origin of ionized gas in DLAs
and sub-DLAs. Since
is almost always broader than
the gravitationally broadened
,
an additional
energy source is required to heat and accelerate the C IV-bearing
clouds, in 40% of cases to above to escape speed.
We propose that star formation and supernovae can provide this source.
DLA/sub-DLA galaxies with higher rates of star formation will
produce higher EUV fluxes from massive stars, photoionizing the gas
that is seen in the narrow C IV components, and will also undergo higher rates
of type II supernovae and stellar winds. The supernovae lead to
(i) metal enrichment through nucleosynthesis,
(ii) the generation of million-degree interstellar plasma, which can
interact with embedded clouds to form gas containing C IV and O VI, and
(iii) the injection of mechanical energy to the surrounding
ISM, explaining the extended velocity fields for the ionized gas.
Such a scenario would explain (at least qualitatively) the
metallicity-C IV line width correlation, and the velocity and
ionization level of the wind candidates.
Infalling clouds can also contribute to the C IV seen in DLAs
(e.g. Wolfe & Prochaska 2000b). However, as we have pointed out, infall cannot
explain the highest velocity C IV components, which are detected at
well over the escape speed. Although metallicity measurements could in theory
discriminate between the infall and outflow hypotheses, it is very
difficult to directly measure the metallicity of the ionized gas in DLAs.
One practical test of the idea that star formation leads to the
production of ionized gas in DLAs (and the associated idea that the
high-velocity C IV components in DLAs trace winds) would be a detailed
comparison between the properties of C IV absorption in DLAs and in
LBGs, where outflows are directly observed (Shapley et al. 2003; Pettini et al. 2000,2002). Though we have not yet conducted a full comparison, we do
note that the similar C IV column density distributions observed in
DLAs and LBGs suggest that the ionized gas in these two classes of
object shares a common origin in supernova-driven outflows.
Acknowledgements
A.J.F. gratefully acknowledges the support of a Marie Curie
Intra-European Fellowship awarded by the European Union Sixth
Framework Programme.
P.P. and R.S. gratefully acknowledge support from the Indo-French Centre
for the Promotion of Advanced Research (Centre Franco-Indien pour la
Promotion de la Recherche Avancée) under contract No. 3004-3.
We thank Alain Smette for kindly providing the spectra of many quasars
in the Hamburg-ESO survey prior to publication. We acknowledge
valuable discussions with Blair Savage, Jason Prochaska, and Art
Wolfe. Finally, we thank the referee for perceptive comments that
improved the paper.
- Adelberger, K. L., Shapley,
A. E., Steidel, C. C., et al. 2005, ApJ, 629, 636 [NASA ADS] [CrossRef]
- Aguirre, A., Hernquist, L.,
Schaye, J., et al. 2001, ApJ, 560, 599 [NASA ADS] [CrossRef]
- Aguirre, A., Schaye, J.,
Hernquist, L., et al. 2005, ApJ, 620, L13 [NASA ADS] [CrossRef]
- Akerman, C. J., Ellison, S.
L., Pettini, M., & Steidel, C. C. 2005, A&A, 440, 499 [NASA ADS] [CrossRef] [EDP Sciences] (In the text)
- Allende Prieto, C.,
Lambert, D. L., & Asplund, A. 2002, ApJ, 573, L137 [NASA ADS] [CrossRef] (In the text)
- Aracil, B., Petitjean, P.,
Pichon, C., & Bergeron, J. 2004, A&A, 419, 811 [NASA ADS] [CrossRef] [EDP Sciences]
- Ballester, P., Modigliani,
A., Boitquin, O., et al. 2000, The Messenger, 101, 31 (In the text)
- Bergeron, J., &
Herbert-Fort, S. 2005, Probing Galaxies through Quasar Absorption
Lines, ed. W. Shu, & Ménard, Proc. IAU, 199, 265
- Bergeron, J., Petitjean,
P., Sargent, W. L. W., et al. 1994, ApJ, 436, 33 [NASA ADS] [CrossRef]
- Bergeron, J., Aracil, B.,
Petitjean, P., & Pichon, C. 2002, A&A, 396, L11 [NASA ADS] [CrossRef] [EDP Sciences]
- Boksenberg, A., Sargent, W.
L. W., & Rauch, M. 2003, preprint
[arXiv:astro-ph/0307557]
- Borkowski, K. J., Balbus,
S. A., & Fristrom, C. C. 1990, ApJ, 355, 501 [NASA ADS] [CrossRef] (In the text)
- Bouché, N., &
Lowenthal, J. D. 2003, ApJ, 596, 810 [NASA ADS] [CrossRef]
- Bouché, N., &
Lowenthal, J. D. 2004, ApJ, 609, 513 [NASA ADS] [CrossRef]
- Bouché, N., Lehnert,
M. D., & Péroux, C. 2005, MNRAS, 364, 319 [NASA ADS]
- Bouché, N., Lehnert,
M. D., & Péroux, C. 2006, MNRAS, 367, L16 [NASA ADS]
- Bouché, N., Lehnert,
M. D., Aguirre, A., Péroux, C., & Bergeron, J. 2007,
MNRAS, 378, 525 [NASA ADS]
- Bregman, J. N. 1980, ApJ,
236, 577 [NASA ADS] [CrossRef]
- Bregman, J. N., &
Harrington, J. P. 1986, ApJ, 309, 833 [NASA ADS] [CrossRef] (In the text)
- Brooks, A. M., Governato,
F., Booth, C. M., et al. 2007, ApJ, 655, L17 [NASA ADS] [CrossRef]
- Carswell, B., Schaye, J.,
& Kim, T.-S. 2002, ApJ, 578, 43 [NASA ADS] [CrossRef]
- Chen, H.-W., &
Lanzetta, K. 2003, ApJ, 597, 706 [NASA ADS] [CrossRef] (In the text)
- Collins, J. A., Shull, J.
M., & Giroux, M. L. 2004, ApJ, 605, 216 [NASA ADS] [CrossRef]
- Collins, J. A., Shull, J.
M., & Giroux, M. L. 2005, ApJ, 623, 196 [NASA ADS] [CrossRef]
- Cooke, J., Wolfe, A. M.,
Gawiser, E., & Prochaska, J. X. 2006a, ApJ, 636, L9 [NASA ADS] [CrossRef]
- Cooke, J., Wolfe, A. M.,
Gawiser, E., & Prochaska, J. X. 2006b, ApJ, 652, 992 [NASA ADS] [CrossRef]
- Cowie, L. L., &
Songaila, A. 1998, Nature, 394, 44 [NASA ADS] [CrossRef]
- Davé, R., Hernquist,
L., Katz, N., & Weinberg, D. H. 2000, ApJ, 539, 517 [CrossRef]
- Dekker, H., D'Odorico, S.,
Kaufer, A., Delabre, B., & Kotzlowski, H. 2000, SPIE, 4008,
534 [NASA ADS] (In the text)
- Dessauges-Zavadsky, M.,
Péroux, C., Kim, T.-S., D'Odorico, S., & McMahon, R. G.
2003, MNRAS, 345, 447 [NASA ADS]
- Dopita, M. A., &
Sutherland, R. S. 1996, ApJS, 102, 161 [NASA ADS] [CrossRef] (In the text)
- Efstathiou, G. 2000, MNRAS,
317, 697 [NASA ADS] (In the text)
- Ellison, S. L., &
Lopez, S. 2001, A&A, 380, 117 [NASA ADS] [CrossRef] [EDP Sciences] (In the text)
- Ellison, S. L., Songaila,
A., Schaye, J., & Pettini, M. 2000, AJ, 120, 1175 [NASA ADS] [CrossRef]
- Ellison, S. L., Yan, L.,
Hook, I. M., et al. 2002, A&A, 383, 91 [NASA ADS] [CrossRef] [EDP Sciences] (In the text)
- Ellison, S. L., Hennawi, J.
F., Martin, C. L., & Sommer-Larsen, J. 2007, MNRAS, submitted
[arXiv:0704.1816]
- Erb, D. K., Shapley, A. E.,
Pettini, M., et al. 2006, ApJ, 644, 813 [NASA ADS] [CrossRef]
- Esquivel, A., Benjamin, R.
A., Lazarian, A., Cho, J., & Leitner, S. N. 2006, ApJ, 648,
1043 [NASA ADS] [CrossRef]
- Fangano, A. P. M., Ferrara,
A., & Richter, P. 2007, MNRAS, submitted
[arXiv:astro-ph/0704.2143]
- Ferland, G. J., Korista, K.
T., Verner, D. A., et al. 1998, PASP, 110, 761 [NASA ADS] [CrossRef] (In the text)
- Ferrara, A., Pettini, M.,
& Shchekinov, Y. 2000, MNRAS, 319, 539 [NASA ADS]
- Ferrara, A., Scannapieco,
E., & Bergeron, J. 2005, ApJ, 634, L37 [NASA ADS] [CrossRef]
- Finlator, K., &
Davé, R. 2007, MNRAS, submitted
[arXiv:0704.3100]
(In the text)
- Fox, A. J., Savage, B. D.,
Wakker, B. P., et al. 2004, ApJ, 602, 738 [NASA ADS] [CrossRef]
- Fox, A. J., Wakker, B. P.,
Savage, B. D., et al. 2005, ApJ, 630, 332 [NASA ADS] [CrossRef]
- Fox, A. J., Savage, B. D.,
& Wakker, B. P. 2006, ApJS, 165, 229 [NASA ADS] [CrossRef]
- Fox, A. J., Petitjean, P.,
Ledoux, C., & Srianand, R. 2007, A&A, 465, 171 [NASA ADS] [CrossRef] [EDP Sciences]
(Paper I)
- Ganguly, R., Sembach, K.
R., Tripp, T. M., & Savage, B. D. 2005, ApJS, 157, 251 [NASA ADS] [CrossRef]
- Gnat, O., & Sternberg,
A. 2007, ApJS, 168, 213 [NASA ADS] [CrossRef] (In the text)
- Haehnelt, M. G., Steinmetz,
M., & Rauch, M. 1998, ApJ, 495, 647 [NASA ADS] [CrossRef] (In the text)
- Heckman, T. M., Lehnert, M.
D., Strickland, D. K., & Armus, L. 2000, ApJS, 129, 493 [NASA ADS] [CrossRef]
- Heckman, T. M., Sembach, K.
R., Meurer, G. R., et al. 2001, ApJ, 554, 1021 [NASA ADS] [CrossRef]
- Heinmüller, J.,
Petitjean, P., Ledoux, C., Caucci, S., & Srianand, R. 2006,
A&A, 449, 33 [NASA ADS] [CrossRef] [EDP Sciences] (In the text)
- Hennawi, J. F., &
Prochaska, J. X. 2007, ApJ, 655, 735 [NASA ADS] [CrossRef]
- Houck, J. C., &
Bregman, J. N. 1990, ApJ, 352, 506 [NASA ADS] [CrossRef] (In the text)
- Howk, J. C., & Sembach,
K. R. 1999, ApJ, 523, L141 [NASA ADS] [CrossRef] (In the text)
- Indebetouw, R., &
Shull, J. M. 2004, ApJ, 607, 309 [NASA ADS] [CrossRef]
- Kafatos, M. 1973, ApJ, 182,
433 [NASA ADS] [CrossRef]
- Kawata, D., & Rauch, M.
2007, ApJ, submitted [arXiv:0704.0652]
- Khare, P., Kulkarni, V. P.,
Péroux, C., et al. 2007, A&A, 464, 487 [NASA ADS] [CrossRef] [EDP Sciences] (In the text)
- Kirkman, D., & Tytler,
D. 1997, ApJ, 489, L123 [NASA ADS] [CrossRef]
- Kirkman, D., & Tytler,
D. 1999, ApJ, 512, L5 [NASA ADS] [CrossRef]
- Kobayashi, C., Springel,
V., & White, S. D. M. 2007, MNRAS, 376, 1465 [NASA ADS]
- Kulkarni, V. P., Khare, P.,
Péroux, C., et al. 2007, ApJ, 661, L88 [NASA ADS] [CrossRef]
- Ledoux, C., Petitjean, P.,
Bergeron, J., Wampler, E. J., & Srianand, R. 1998, A&A,
337, 51 [NASA ADS]
- Ledoux, C., Petitjean, P.,
& Srianand, R. 2003, MNRAS, 346, 209 [NASA ADS] (In the text)
- Ledoux, C., Petitjean, P.,
Fynbo, J. P. U., Møller, P., & Srianand, R. 2006, A&A,
457, 71 [NASA ADS] [CrossRef] [EDP Sciences] (In the text)
- Lehner, N., & Howk, J.
C. 2007, MNRAS, 377, 687 [NASA ADS] (In the text)
- Levshakov, S. A.,
Agafonova, I. I., Reimers, D., & Baade, R. 2003, A&A, 404,
449 [NASA ADS] [CrossRef] [EDP Sciences]
- Lopez, S., Ellison, S.,
D'Odorico, S., & Kim, T.-S. 2007, A&A, 469, 61 [NASA ADS] [CrossRef] [EDP Sciences]
- Lu, L., Sargent, W. L. W.,
Barlow, T. A., Churchill, C. W., & Vogt, S. S. 1996, ApJS, 107,
475 [NASA ADS] [CrossRef]
- Mac Low, M., & Ferrara,
A. 1999, ApJ, 513, 142 [NASA ADS] [CrossRef]
- Maller, A. H., Prochaska,
J. X., Somerville, R. S., & Primack, J. R. 2001, MNRAS, 326,
1475 [NASA ADS] (In the text)
- Maller, A. H., Prochaska,
J. X., Somerville, R. S., & Primack, J. R. 2003, MNRAS, 343,
268 [NASA ADS]
- Martin, C. L. 2005, ApJ,
621, 227 [NASA ADS] [CrossRef]
- Martin, C. L. 2006, ApJ,
647, 222 [NASA ADS] [CrossRef] (In the text)
- Miralda-Escudé, J.
2005, ApJ, 620, L91 [NASA ADS] [CrossRef] (In the text)
- Mo, H. J., &
Miralda-Escudé, J. 1996, ApJ, 469, 589 [NASA ADS] [CrossRef]
- Møller, P., Fynbo, J.
P. U., & Fall, S. M. 2004, A&A, 422, L33 [NASA ADS] [CrossRef] [EDP Sciences]
- Morton, D. C. 2003, ApJS,
149, 205 [NASA ADS] [CrossRef] (In the text)
- Murphy, M. T., Curran, S.
J., Webb, J. K., Ménager, H., & Zych, B. J. 2007, MNRAS,
376, 673 [NASA ADS]
- Nagamine, K., Springel,
V., & Hernquist, L. 2004a, MNRAS, 348, 421 [NASA ADS]
- Nagamine, K., Springel,
V., & Hernquist, L. 2004b, MNRAS, 348, 435 [NASA ADS]
- Noterdaeme, P., Ledoux, C.,
Petitjean, P., Le Petit, F., Srianand, R., & Smette, A. 2007,
A&A, in press [arXiv:0707.4479]
(In the text)
- Oppenheimer, B., &
Davé, R. 2006, MNRAS, 373, 1265 [NASA ADS]
- Péroux, C.,
Dessauges-Zavadsky, M., D'Odorico, S., Kim, T.-S., & McMahon,
R. G. 2003, MNRAS, 345, 480 [NASA ADS]
- Péroux, C.,
Dessauges-Zavadsky, M., D'Odorico, S., Kim, T.-S., & McMahon,
R. G. 2005, MNRAS, 363, 479 [NASA ADS]
- Péroux, C.,
Dessauges-Zavadsky, M., D'Odorico, S., Kim, T.-S., & McMahon,
R. G. 2007, MNRAS, in press [arXiv:0707.2697]
- Petitjean, P., &
Aracil, B. 2004, A&A, 422, 523 [NASA ADS] [CrossRef] [EDP Sciences] (In the text)
- Pettini, M. 1999, in Proc.
ESO Workshop, Chemical Evolution from Zero to High Redshift, ed. J.
R. Walsh, & M. R. Rosa (Berlin: Springer), 233
[arXiv:astro-ph/9902173]
- Pettini, M., Steidel, C.
C., Adelberger, K. L., Dickinson, M., & Giavalisco, M. 2000,
ApJ, 528, 96 [NASA ADS] [CrossRef]
- Pettini, M., Rix, S. A.,
Steidel, C. C., et al. 2002, ApJ, 569, 742 [NASA ADS] [CrossRef]
- Pottasch, S. R., Wesselius,
P. R., & van Duinen, R. J. 1979, A&A, 74, L15 [NASA ADS] (In the text)
- Prochaska, J. X., &
Wolfe, A. M. 1997, ApJ, 487, 73 [NASA ADS] [CrossRef] (In the text)
- Prochaska, J. X., &
Wolfe, A. M. 2002, ApJ, 566, 68 [NASA ADS] [CrossRef] (In the text)
- Prochaska, J. X., Chen,
H.-W., Wolfe, A. M., Dessauges-Zavadsky, M., & Bloom, J. S.
2007a, ApJ, submitted [arXiv:astro-ph/0703701]
- Prochaska, J. X.,
Hennawi, J. F., & Herbert-Fort, S. 2007b, ApJ, submitted
[arXiv:astro-ph/0703594]
- Reimers, D., Baade, R.,
Hagen, H.-J., & Lopez, S. 2001, A&A, 374, 871 [NASA ADS] [CrossRef] [EDP Sciences] (In the text)
- Reimers, D., Agafonova, I.
I., Levshakov, S. A., et al. 2006, A&A, 449, 9 [NASA ADS] [CrossRef] [EDP Sciences]
- Richter, P., Ledoux, C.,
Petitjean, P., & Bergeron, J. 2005, A&A, 440, 819 [NASA ADS] [CrossRef] [EDP Sciences]
- Russell, D. M., Ellison, S.
L., & Benn, C. R. 2006, MNRAS, 367, 412 [NASA ADS]
- Ryan-Weber, E. V., Pettini,
M., & Madau, P. 2006, MNRAS, 371, L78 [NASA ADS] (In the text)
- Savage, B. D., &
Sembach, K. R. 1991, ApJ, 379, 245 [NASA ADS] [CrossRef] (In the text)
- Savage, B. D., Sembach, K.
R., Wakker, B. P., et al. 2003, ApJS, 146, 125 [NASA ADS] [CrossRef]
- Savaglio, S., Glazebrook,
K., Le Borgne, D., et al. 2005, ApJ, 635, 260 [NASA ADS] [CrossRef]
- Scannapieco, E., Pichon,
C., Aracil, B., et al. 2006a, MNRAS, 365, 615 [NASA ADS]
- Scannapieco, C., Tissera,
P. B., White, S. D. M., & Springel, V. 2006b, MNRAS, 371,
1125 [NASA ADS]
- Schaye, J. 2006, ApJ, 643,
59 [NASA ADS] [CrossRef] (In the text)
- Schaye, J., Aguirre, A.,
Kim, T.-S., et al. 2003, ApJ, 593, 768 [NASA ADS] [CrossRef]
- Schaye, J., Carswell, R.
F., & Kim, T.-S. 2007, MNRAS, 379, 1169 [NASA ADS]
- Sembach, K. R., Savage, B.
D., Lu, L., & Murphy, E. M. 1995, ApJ, 451, 616 [NASA ADS] [CrossRef]
- Sembach, K. R., &
Savage, B. D., Lu., L., & Murphy, E. M. 1999, ApJ, 515,
108 [NASA ADS] [CrossRef]
- Sembach, K. R., Wakker, B.
P., Savage, B. D., et al. 2003, ApJS, 146, 165 [NASA ADS] [CrossRef]
- Shapiro, P. R., &
Field, G. B. 1976, ApJ, 205, 762 [NASA ADS] [CrossRef]
- Shapley, A. E., Steidel, C.
C., Pettini, M., & Adelberger, K. L. 2003, ApJ, 588, 65 [NASA ADS] [CrossRef]
- Simcoe, R. A., Sargent, W.
L. W., & Rauch, M. 2002, ApJ, 578 , 737
- Simcoe, R. A., Sargent, W.
L. W., Rauch, M., & Becker, G. 2006, ApJ, 637, 648 [NASA ADS] [CrossRef]
- Slavin, J. D., Shull, J.
M., & Begelman, M. C. 1993, ApJ, 407, 83 [NASA ADS] [CrossRef]
- Smette, A., Wisotzki, L.,
Ledoux, C., et al. 2005, Probing Galaxies through Quasar
Absorption Lines, ed. W. Shu, & Ménard, Proc. IAU, 199,
475
(In the text)
- Sommer-Larsen, J., &
Fynbo, J. P. U. 2007, MNRAS, submitted
[arXiv:astro-ph/0703698]
- Songaila, A. 2005, AJ, 130,
1996 [NASA ADS] [CrossRef]
- Songaila, A. 2006, AJ, 131,
24 [NASA ADS] [CrossRef]
- Srianand, R., Petitjean,
P., Ledoux, C., Ferland, G., & Shaw, G. 2005, MNRAS, 362,
549 [NASA ADS] (In the text)
- Strickland, D. K., Heckman,
T. M., Colbert, E. J. M., Hoopes, C. G., & Weaver, K. A. 2004,
ApJ, 606, 829 [NASA ADS] [CrossRef]
- Tissera, P. B.,
Scannapieco, C., White, S. D. M., & Springel, V. 2006, Rev.
Mex. Astron. Astrofís., 26, 125
- Tremonti, C. A., Heckman,
T. M., Kauffmann, G., et al. 2004, ApJ, 613, 898 [NASA ADS] [CrossRef]
- Veilleux, S., Cecil, G.,
& Bland-Hawthorn, J. 2005, ARA&A, 43, 769 [NASA ADS] (In the text)
- Wolfe, A. M., & Chen,
H.-W. 2006, ApJ, 652, 981 [NASA ADS] [CrossRef] (In the text)
- Wolfe. A. M., &
Prochaska, J. X. 1998, ApJ, 494, L15 [NASA ADS] [CrossRef]
- Wolfe, A. M., &
Prochaska, J. X. 2000a, ApJ, 545, 591 [NASA ADS] [CrossRef]
- Wolfe, A. M., &
Prochaska, J. X. 2000b, ApJ, 545, 603 [NASA ADS] [CrossRef] (In the text)
- Wolfe, A. M., Prochaska,
J. X., & Gawiser, E. 2003a, ApJ, 593, 215 [NASA ADS] [CrossRef]
- Wolfe, A. M., Gawiser,
E., & Prochaska, J. X. 2003b, ApJ, 593, 235 [NASA ADS] [CrossRef]
- Wolfe, A. M., Gawiser, E.,
& Prochaska, J. X. 2005, ARA&A, 43, 861 [NASA ADS] (In the text)
- Zsargó, J., Sembach,
K. R., Howk, J. C., & Savage, B. D. 2003, ApJ, 586, 1019 [NASA ADS] [CrossRef]
Online Material
![\begin{figure}
\par\includegraphics[width=15cm,clip]{7640f1a.eps}
\end{figure}](/articles/aa/full/2007/39/aa7640-07/Timg161.gif) |
Figure 1:
VLT/UVES absorption line spectra of C IV
 and an optically thin line (typically Si II or Fe II)
chosen to trace the neutral phase component structure, for all DLAs and
sub-DLAs in our sample.
The flux is in arbitrary units, with the bottom of each panel at zero.
The light (dark) shaded regions show C IV absorption
below (above)
,
where
(see text).
The thick vertical line in each C IV panel denotes the optical-depth
weighted mean velocity of the profile.
The two narrow vertical lines show the velocities corresponding to 5% and 95% of the integrated optical depth; the interval between
these velocities defines the total line width .
A small letter "B'' within the shaded area indicates a
blend; in these cases the other C IV line was used for measurement.
The label "Proximate'' implies the absorber is at <5000 km s-1 from the QSO. Note how the wind candidate absorbers (the dark
regions) show no absorption in the weak neutral line shown here,
implying these absorbers have low column densities of neutral gas
and are highly ionized.
and an optically thin line (typically Si II or Fe II)
chosen to trace the neutral phase component structure, for all DLAs and
sub-DLAs in our sample.
The flux is in arbitrary units, with the bottom of each panel at zero.
The light (dark) shaded regions show C IV absorption
below (above)
,
where
(see text).
The thick vertical line in each C IV panel denotes the optical-depth
weighted mean velocity of the profile.
The two narrow vertical lines show the velocities corresponding to 5% and 95% of the integrated optical depth; the interval between
these velocities defines the total line width .
A small letter "B'' within the shaded area indicates a
blend; in these cases the other C IV line was used for measurement.
The label "Proximate'' implies the absorber is at <5000 km s-1 from the QSO. Note how the wind candidate absorbers (the dark
regions) show no absorption in the weak neutral line shown here,
implying these absorbers have low column densities of neutral gas
and are highly ionized.
|
| Open with DEXTER |
Copyright ESO 2007
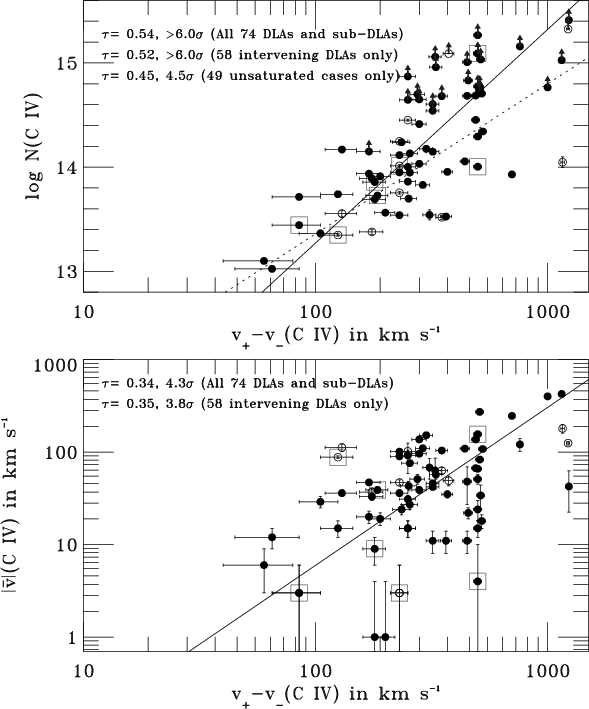
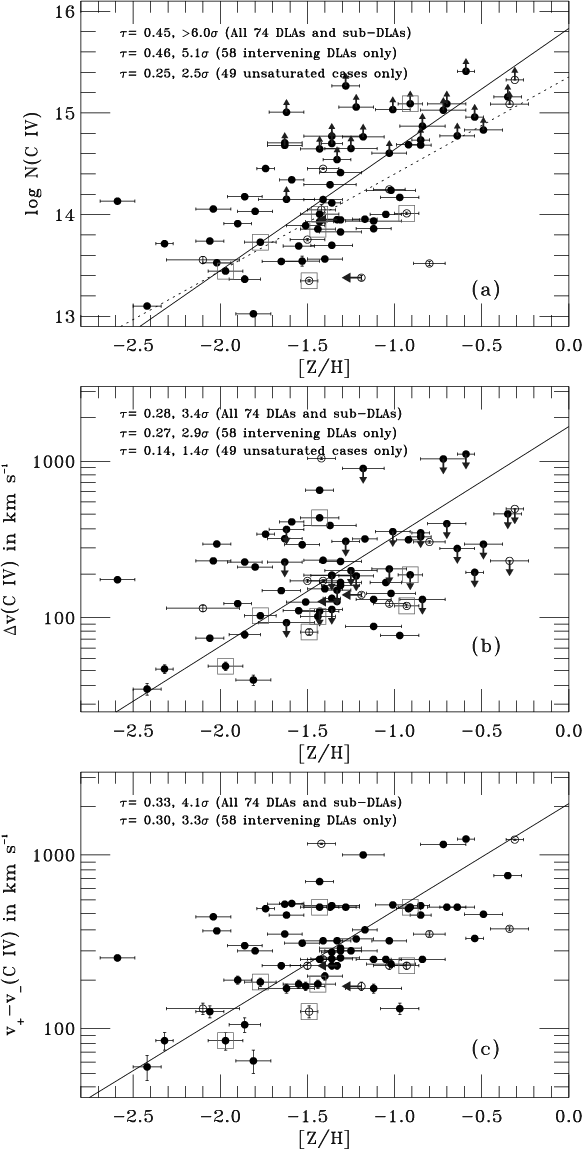
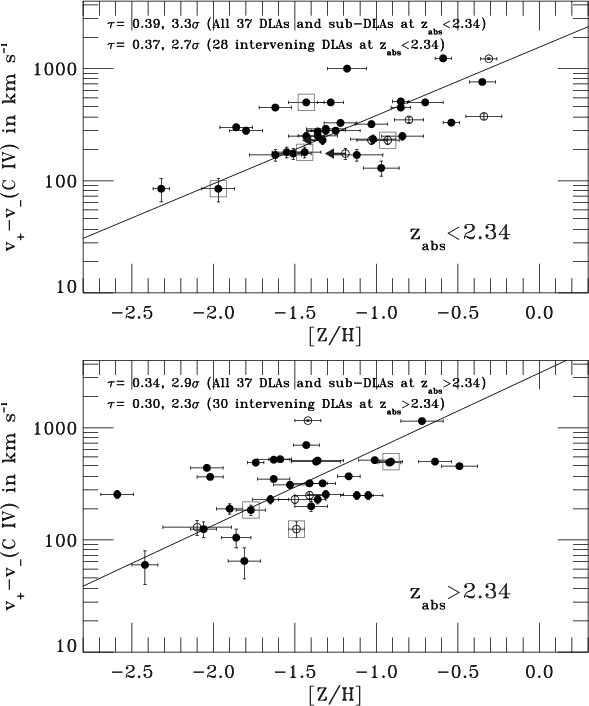
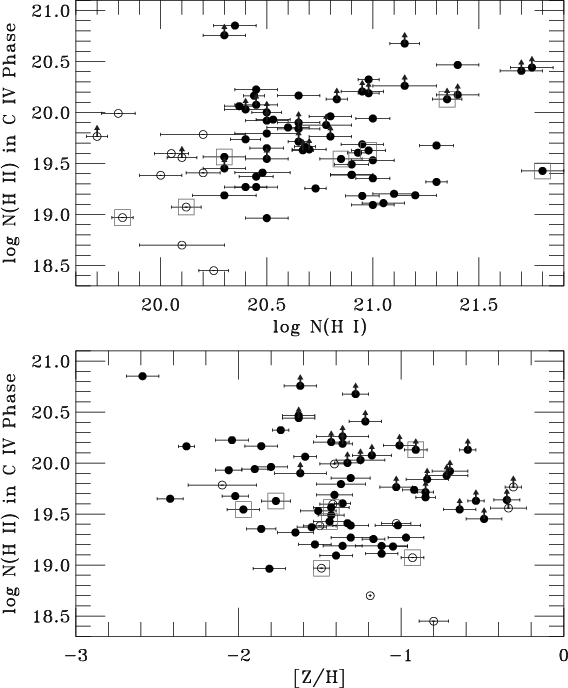
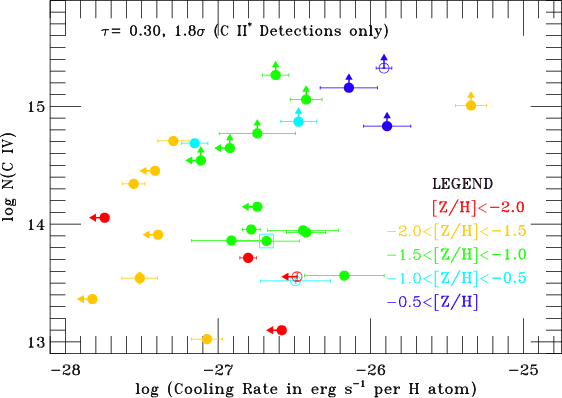
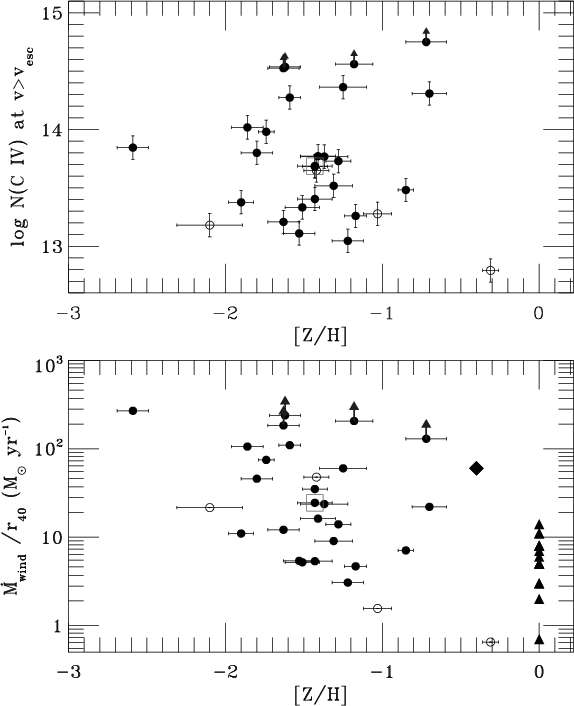
![\begin{figure}
\par\includegraphics[width=15cm,clip]{7640f1a.eps}
\end{figure}](/articles/aa/full/2007/39/aa7640-07/img161.gif)
![\begin{figure}\par\includegraphics[width=15cm,clip]{7640f1b.eps}
\end{figure}](/articles/aa/full/2007/39/aa7640-07/img162.gif)
![\begin{figure}\par\includegraphics[width=15cm,clip]{7640f1c.eps}
\end{figure}](/articles/aa/full/2007/39/aa7640-07/img163.gif)
![\begin{figure}\par\includegraphics[width=15cm,clip]{7640f1d.eps}
\end{figure}](/articles/aa/full/2007/39/aa7640-07/img164.gif)