 |
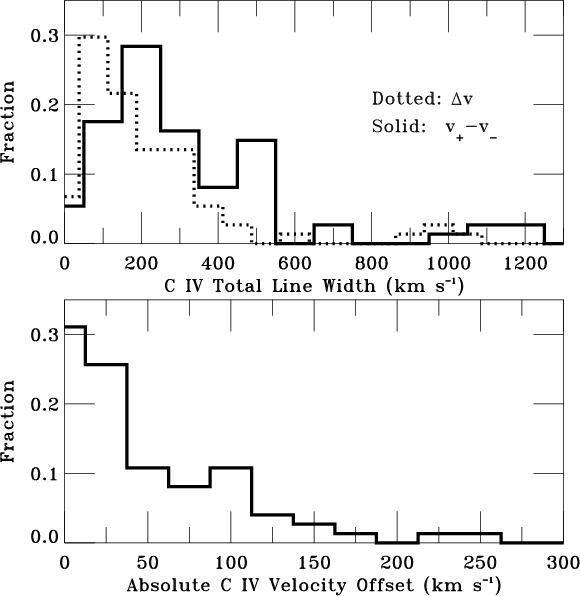
Figure 2:
Normalized histograms of total C IV line width and absolute velocity
offset among our DLA/sub-DLA sample.
The distribution of both |
| Open with DEXTER | |
In the text
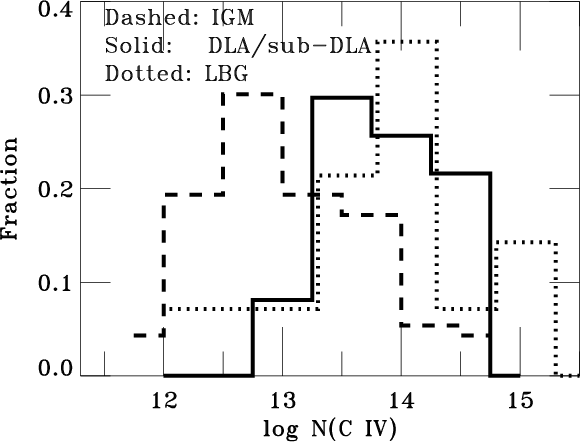 |
Figure 3:
Comparison of the normalized C IV column density distributions:
(i) in DLAs and sub-DLAs (solid line, this work);
(ii) in the IGM at
|
| Open with DEXTER | |
In the text
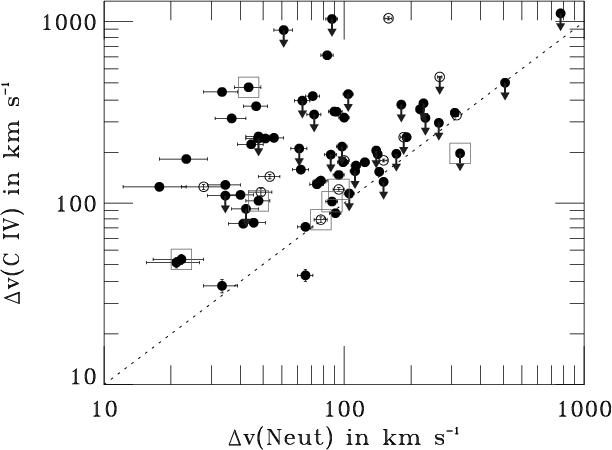 |
Figure 4:
Comparison of high-ion and low-ion total line width for DLAs
(filled circles) and sub-DLAs (open circles). Absorbers at
<5000 km s-1 from the QSO redshift are highlighted in square symbols.
The dashed line shows where
|
| Open with DEXTER | |
In the text
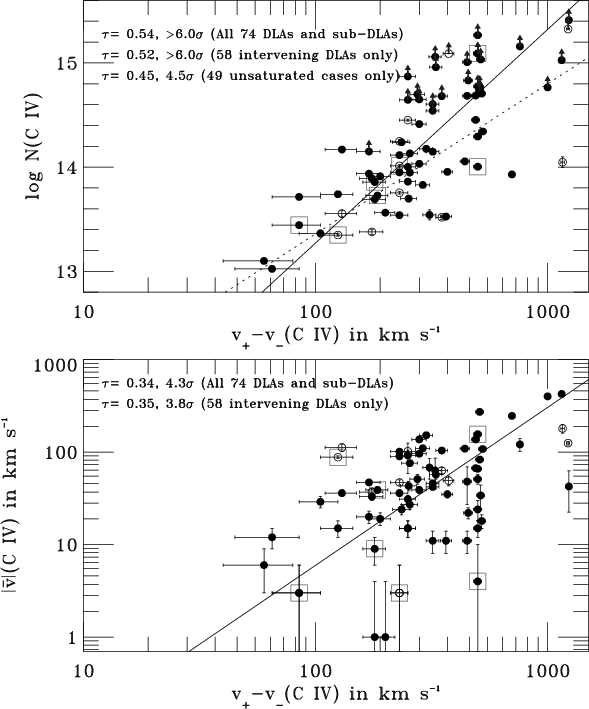 |
Figure 5:
Correlations between the measured C IV properties
for both DLAs (filled circles) and sub-DLAs (open circles).
Proximate absorbers are highlighted in square symbols.
We use v+-v- rather than |
| Open with DEXTER | |
In the text
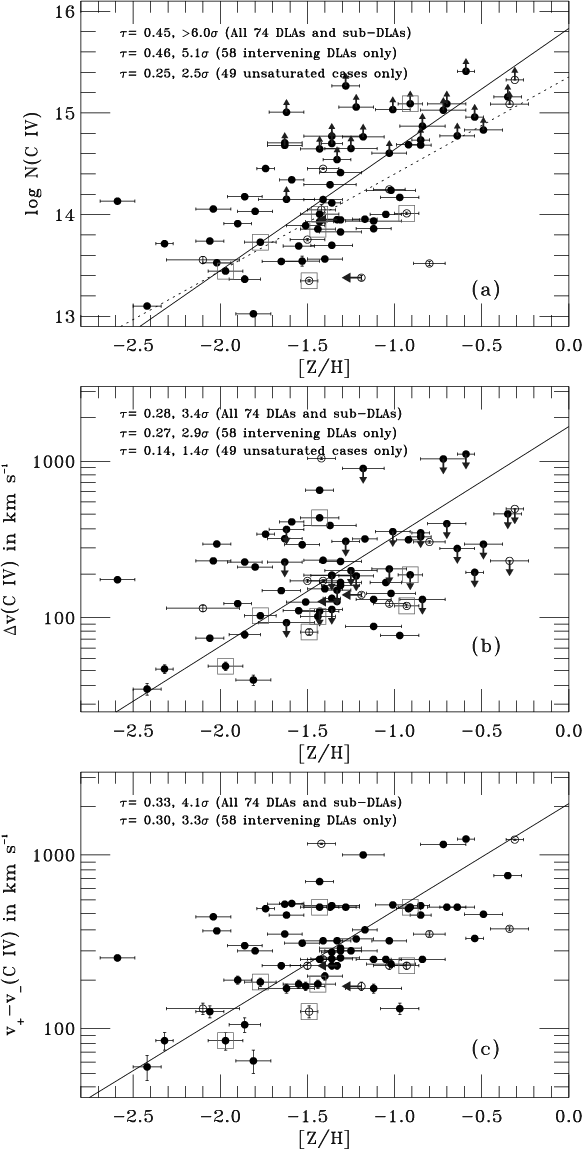 |
Figure 6:
Dependence of C IV properties in DLAs (filled circles) and sub-DLAs
(open circles) with neutral-phase metallicity. Proximate absorbers
are highlighted in square symbols.
In each panel, we annotate the Kendall rank correlation coefficient |
| Open with DEXTER | |
In the text
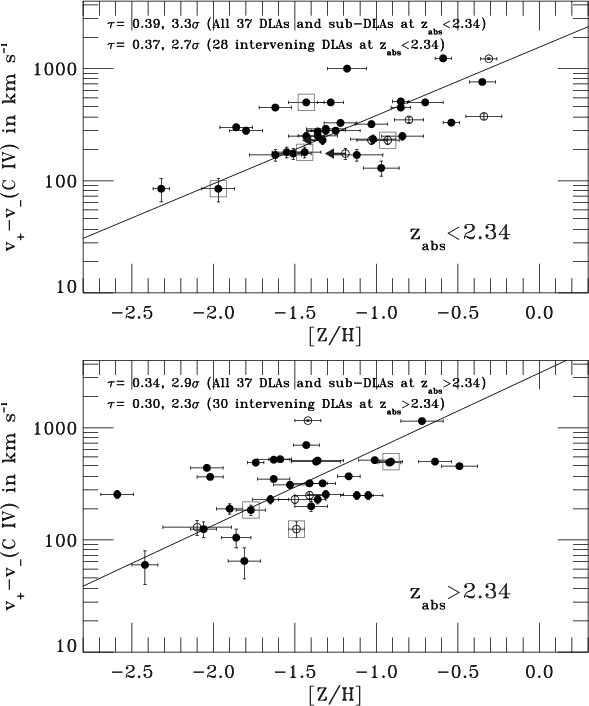 |
Figure 7: Illustration that the correlation between C IV total line width and metallicity exists independently in the lower and upper redshift halves of the sample, even though there is a difference between the mean metallicity of the two sub-samples (the lower-z sample shows systematically higher [Z/H]). The symbols have their same meanings as in Fig. 6. All DLAs and sub-DLAs in each redshift range were included in the correlation analysis and in the linear bisector fits, shown with solid lines. |
| Open with DEXTER | |
In the text
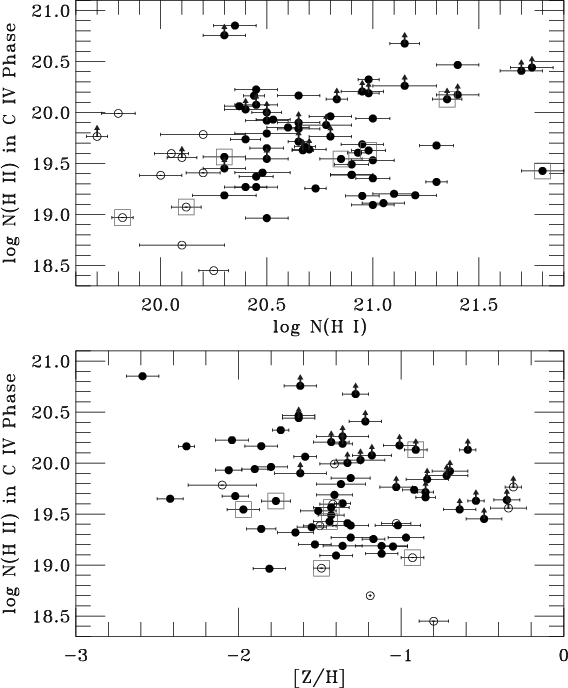 |
Figure 8:
Comparison of H II column density in the C IV-bearing
gas integrated over all velocities
with ( top)
|
| Open with DEXTER | |
In the text
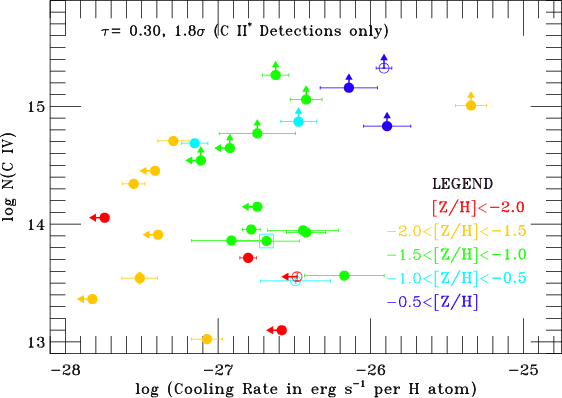 |
Figure 9:
Dependence of the C IV column density on the cooling rate derived from the
|
| Open with DEXTER | |
In the text
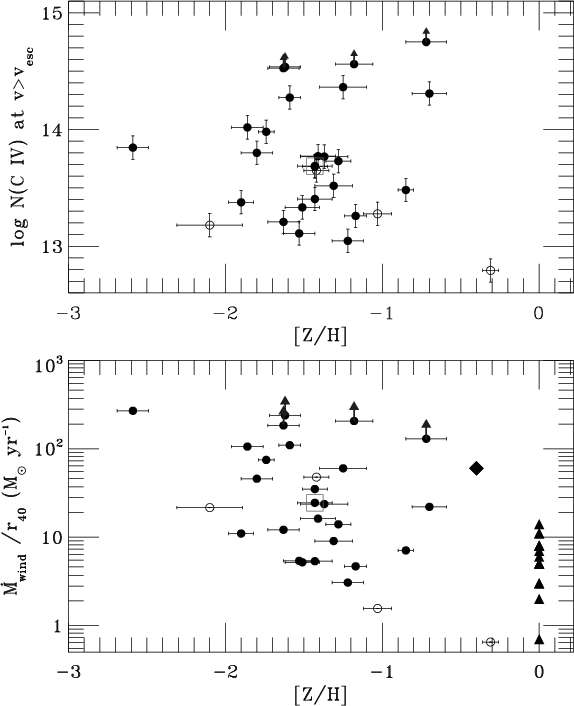 |
Figure 10:
Top panel: C IV column density moving above the escape speed
(i.e. wind candidate
|
| Open with DEXTER | |
In the text
![\begin{figure}
\par\includegraphics[width=15cm,clip]{7640f1a.eps}
\end{figure}](/articles/aa/full/2007/39/aa7640-07/img161.gif) |
Figure 1:
VLT/UVES absorption line spectra of C IV
|
| Open with DEXTER | |
In the text
![\begin{figure}\par\includegraphics[width=15cm,clip]{7640f1b.eps}
\end{figure}](/articles/aa/full/2007/39/aa7640-07/img162.gif) |
Figure 1: continued. |
| Open with DEXTER | |
In the text
![\begin{figure}\par\includegraphics[width=15cm,clip]{7640f1c.eps}
\end{figure}](/articles/aa/full/2007/39/aa7640-07/img163.gif) |
Figure 1: continued. |
| Open with DEXTER | |
In the text
![\begin{figure}\par\includegraphics[width=15cm,clip]{7640f1d.eps}
\end{figure}](/articles/aa/full/2007/39/aa7640-07/img164.gif) |
Figure 1: continued. |
| Open with DEXTER | |
In the text