A&A 473, 377-387 (2007)
DOI: 10.1051/0004-6361:20066732
J. Frémaux - D. Pelat - C. Boisson - M. Joly
LUTH, UMR 8102 du CNRS, associé à l'Université Denis Diderot, Observatoire de Paris, Section de Meudon, 92195 Meudon Cedex, France
Received 10 November 2006 / Accepted 24 May 2007
Abstract
Aims. Numerous studies of the host galaxy of Seyfert nuclei are being conducted in the optical/visible range. However, in the case of Seyfert 1, the spectra of the inner galactic core can be dominated by broad emission lines coming from the nucleus that totally flood the underlying galactic spectrum, preventing any study of stellar populations.
Methods. Because part of the IR H-band is free of the strongest AGN emission lines, we developed a method that allows the stellar population of the very internal regions of the Seyfert 1 galaxies to be studied in the presence of a diluting continuum.
Results. A new inverse method using the flux as observables was developed and deeply tested. The specificity of the method is to take the non stellar parameters (reddening, dust emission, and non-stellar continuum) into account directly in the synthetic distance to be minimised.
Conclusions. The method is powerful for deriving the stellar content of the very central part of AGN. However, the results for the stellar population are still tentative, as the incompleteness of the stellar base (lack of supermetallic giant stars) could lead to large uncertainties. New observations of stars in the infrared at high spectral resolution, in particular metal-rich stars, are mandatory to build a complete stellar library that can be used to synthesise the host galaxies of AGN with as much accuracy as possible.
Key words: galaxies: stellar content - galaxies: active - methods: analytical - infrared: galaxies - galaxies: individual: MCG-6-30-15
Stellar population synthesis is the only way to determine which kinds of stars compose a spatially unresolved astrophysical object. There are basically two different approaches to do this. The "direct'' approach, also called "evolutive synthesis method'' (e.g. Tinsley 1972; Bruzual & Charlot 1993,2003; Granato et al. 2001; Vazdekis et al. 2003; Le Borgne et al. 2004; Vazquez & Leitherer 2005), compares the spectrum at each time step of an evolving stellar population with the spectrum of the studied galaxy. The other methods attempt to extract the stellar components from the spectrum of the astrophysical object through a mathematical inversion of the information content of the observed spectrum. These so-called "inverse'' methods use building blocks of either stellar spectra (e.g. Faber 1972; Pickles 1985; Silva 1991; Moultaka & Pelat 2000; Moultaka 2005) or simple stellar population, SSP (e.g. Bica 1988; Vergely et al. 2002; Cid Fernandes et al. 2005; Ocvirk et al. 2006).
We chose to use the inverse method with an observed stellar data base because it does not rely on presupposed models or hypotheses, such as the shape of the initial mass function, the star formation rate, and a stellar evolutionary model. However, the credibility of any solution needs to be checked against the current astrophysical knowledge of stellar evolution. Such an approach should allow new evolutionary schemes to be unveiled if more appropriate. Basically, it finds the best combination of stars taken from a stellar base, using a minimisation procedure that fits the observed spectrum.
Using extensive Monte-Carlo simulations, Pelat (1997) has demonstrated that an inverse method using equivalent widths can provide an approximate (at 80-90% efficiency relative to the Rao-Cramer bound at high signal-to-noise ratio) global minimum that fits the observables best. This global minimum is demonstrated to be unique, when the signal-to-noise (S/N) ratio goes toward infinity. Thus this method avoids the usual multiple degenerate solutions, the former biggest flaw of this method, as soon as the size of the stellar library is limited by the number of linearly independent observables.
As the age and the metallicity of the stars may have a similar influence on the integrated spectrum, it is important to use as many observables as possible in order to decrease the degeneracy. In the case of galaxies hosting an active galactic nucleus (AGN), in particular the so-called Seyfert 1, the spectra of the inner galactic core can be dominated by broad emission lines coming from the nucleus that totally floods the underlying galactic spectrum, preventing any study of stellar population. The spatial resolution is still far from being sufficient for resolving each individual component of the AGN central part. It is about a hundred parsec for galaxies that are about ten or so Mpc away, observed with 4/8 m telescopes without the use of adaptative optics, thus including the Broad emission Line Region (BLR) and a part of the Narrow Line Region (NLR) for most of those observations.
However, there is a part of the IR H-band, between 1.57 and
1.64 ![]() m, that contains a wealth of stellar signatures while
limiting the risk of an overwhelming contamination by AGN emission:
only the three Brackett lines at 1.570
m, that contains a wealth of stellar signatures while
limiting the risk of an overwhelming contamination by AGN emission:
only the three Brackett lines at 1.570 ![]() m, 1.5880
m, 1.5880 ![]() m, and
1.6109
m, and
1.6109 ![]() m may be present. This spectral range allows the study of
the stellar population in the very internal regions, including the
nucleus, of the Seyfert 1 hosting galaxies.
m may be present. This spectral range allows the study of
the stellar population in the very internal regions, including the
nucleus, of the Seyfert 1 hosting galaxies.
This spectral domain is also rich in luminosity sensitive lines,
therefore in tools for telling the age of the stars (Dallier et al.
1996). Indeed one can see in Fig. 1 how the
relative variations in some metallic and molecular lines are good
marks for the age of the stars (e.g. 1.58 ![]() m (MgI and
CO), 1.60
m (MgI and
CO), 1.60 ![]() m (SiI and CO), and 1.62
m (SiI and CO), and 1.62 ![]() m (CO and FeI)). A
spectral resolution of at least 2000 is necessary to evaluate the
intensity ratios. In order to make full use of the information, the
velocity dispersion of the studied galaxy, which enlarges the spectral
lines, must not be too large, with the limit approximately at
150 km s-1.
m (CO and FeI)). A
spectral resolution of at least 2000 is necessary to evaluate the
intensity ratios. In order to make full use of the information, the
velocity dispersion of the studied galaxy, which enlarges the spectral
lines, must not be too large, with the limit approximately at
150 km s-1.
It is also in this wavelength range that the emission of the stellar
spectral energy distribution is at its maximum. This stellar emission
corresponds roughly to a blackbody spectrum with a temperature of
4000 K, which is quite a good representation for an elliptical or an
early-type spiral galaxy, as are the hosts of active nuclei supposed
to be. The spectral energy distribution of the active nucleus has a
local minimum around 1 ![]() m (e.g. Sanders et al. 1989),
between the emission peak of the dust that lies farther in the
infrared and the emission of the accretion disc that, when modelled by
a power law, is weaker for these wavelengths than for the visible and
the ultraviolet ranges. Thus, in the near infrared, the contrast
between the stellar contribution and the non stellar contributions is
higher than in other wavelength ranges.
m (e.g. Sanders et al. 1989),
between the emission peak of the dust that lies farther in the
infrared and the emission of the accretion disc that, when modelled by
a power law, is weaker for these wavelengths than for the visible and
the ultraviolet ranges. Thus, in the near infrared, the contrast
between the stellar contribution and the non stellar contributions is
higher than in other wavelength ranges.
![\begin{figure}
\par\includegraphics[width=7.7cm,height=14cm,clip]{6732fig1CMJN.eps}\end{figure}](/articles/aa/full/2007/38/aa6732-06/img5.gif) |
Figure 1: Intensity variations for 3 pairs of lines for different spectral types and luminosity classes, at a spectral resolution of about 2000 (from Dallier et al. 1996) |
| Open with DEXTER | |
The continuum emission by the AGN and the emission from the heated dust dilute the stellar absorption lines. Because of the non linearities introduced by the modeling of the intrinsic reddening, the active nucleus continuum, and the dust emission, the inverse method described by Pelat (1997), where absorption line equivalent widths are the observables, cannot be used for a stellar population synthesis of the most central parts of active galaxies in the near infrared. We have to use the observed flux instead. The goal of this paper is to describe a new method of disentangling the different components of the inner core of the galaxy that is composed of the addition of the spectra of stars and non stellar contributions.
Using the flux as an observable instead of the equivalent widths alleviates the difficulties of determining the level and shape of the continuum (see Boisson et al. 2000), which usually leads to a large source of uncertainties. Another advantage of using the flux as an observable comes from the number of observables. Indeed, it is the number of observables that limits, a priori, the number of stars in the stellar base in order to have a defined system. This will thus allow a greater sampling for the stellar composition of the studied galaxies, the goal being to include in the base as many stars as possible to represent the HR diagram best.
Moultaka (2005) already proposed such an inverse method using the flux as an observable for the stellar population synthesis in the visible range. Here we extend and improve this method such as taking the non stellar parameters into account (reddening, dust emission, and non-stellar continuum) directly in the synthetic distance to be minimised. In this way, these parameters are determined without the need of an external loop to probe all the possible values for the non stellar parameters. It is also mathematically more correct, because the non-stellar parameters can be bound to the stellar parameters, and thus preferable to treat them in a similar way.
Whatever the approach in stellar syntheses, a spectral database is
needed to build a synthetic galactic spectrum. The stellar population
synthesis in the infrared range is quite recent and the first detailed
catalogues of observed stellar spectra in the IR date from the 90s
(Lançon & Rocca-Volmerange 1992 with the FTS of the CFHT
at a spectral resolution
![]() ;
Origlia et al. 1993
with IRSPEC at the NTT,
;
Origlia et al. 1993
with IRSPEC at the NTT,
![]() ;
Dallier et al. 1996
with the spectrograph ISIS of the CFHT at
;
Dallier et al. 1996
with the spectrograph ISIS of the CFHT at
![]() ;
Meyer et al. 1998 with the FTS of the KPNO Mayall telescope at
;
Meyer et al. 1998 with the FTS of the KPNO Mayall telescope at
![]() ). The incompleteness of even the most recent libraries
in terms of metallicity led Frémaux et al. (2006) to compare
a set of observed infrared stellar spectra with theoretical ones (but
see Sect. 3).
). The incompleteness of even the most recent libraries
in terms of metallicity led Frémaux et al. (2006) to compare
a set of observed infrared stellar spectra with theoretical ones (but
see Sect. 3).
The new inverse method, using all the spectral pixels as observables and taking the non stellar diluting components into account, is described in the Sect. 2. In the Sect. 3, we show how we select the stellar spectra to compose the database. Section 4 provides different tests of the numerical synthesis code. These tests are useful for knowing which level of reliability the code is able to reach. An application to the well-known Seyfert 1 galaxy MCG-6-30-15 is shown in Sect. 5. The conclusions of this work will take place in Sect. 6.
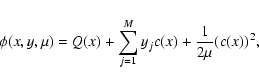
We use the flux received in each wavelength pixel as the observable
quantity to fit. We take into account the internal reddening of the
galaxy, the contribution to the spectrum from the galactic dust,
modeled by a modified blackbody, and the contribution of the active
nucleus continuum, modeled by a power law. The extinction, the
blackbody temperature, and the slope of the power law are free
parameters of the problem. All these non stellar parameters lead to a
non linearity in Eq. (1) that expresses the quadratic
distance Q to minimise, also called the objective function:
 |
(3) |
In Eq. (2),
 |
(4) |
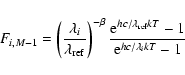
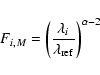
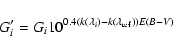
Finally, Gi is the flux of the studied galaxy for the wavelength
![]() normalised at
normalised at
![]() in the same way as
Fji. Then, G'i corresponds to this dereddened flux:
in the same way as
Fji. Then, G'i corresponds to this dereddened flux:
 |
(5) |
The introduction of a parameter pi (positive or null) allows giving a different weight to each part of the spectrum, or even to each individual pixel. The use of weights allows us to account for differences in signal-to-noise ratio and to highlight the most discriminant spectral data in terms of stellar population, or else to reduce the importance, or even to delete, the regions of the spectrum that are contaminated by e.g. the terrestrial atmosphere or by emission lines from the active nucleus.
The unknown variables xj have to satisfy the constraint
The non-linear quadratic Eq. (1) can be handled by the Lancelot B routine, from the optimisation library GALAHAD (Gould et al. 2003). This code allows us to obtain the best solution that minimises the Eq. (1) subject to the constraints (6) and (7).
The method implemented in Lancelot B is described in detail in Conn et al. (1992). An "augmented'' Lagrangian function, called the
merit function of the problem, is associated with the objective
function (1) and with the constraints (6).
It is written
Lancelot B uses a two-level iterative method (several internal
iterations are done for each external iteration) to determine the
minimum of Q(x). The yj and ![]() are automatically adjusted for
each external iteration and are determined so as to converge toward the
minimum as long as the precision criteria on the constraint
(
are automatically adjusted for
each external iteration and are determined so as to converge toward the
minimum as long as the precision criteria on the constraint
(
![]() )
and the projected gradient norm of the Lagrangian
function, which should also be smaller than
)
and the projected gradient norm of the Lagrangian
function, which should also be smaller than ![]() ,
are not reached. We
have arbitrarily chosen the value of 10-10, according to the
machine precision (the code is written in double precision).
,
are not reached. We
have arbitrarily chosen the value of 10-10, according to the
machine precision (the code is written in double precision).
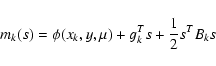
The internal iterations help in finding the minimum of
![]() inside a region defined by the constraints (6) and
(7), using a trust-region method. For that, at
the current point xk, we compute a quadratic model mk(s) of the variation in
the merit function for an increment s of xk. This model is
computed thanks to its secondary and primary partial derivatives and
is written
inside a region defined by the constraints (6) and
(7), using a trust-region method. For that, at
the current point xk, we compute a quadratic model mk(s) of the variation in
the merit function for an increment s of xk. This model is
computed thanks to its secondary and primary partial derivatives and
is written
 |
(9) |
The aim of each iteration is to determine a new point xk+1,
nearer than xk to the minimum of the objective function. If the
minimum sk of mk(s) inside the trust region allows
![]() to be smaller than
to be smaller than
![]() ,
xk+1=xk+sk. If not, we look for a new sk with a smaller
trust radius.
,
xk+1=xk+sk. If not, we look for a new sk with a smaller
trust radius.
The minimum sk is obtained in two steps. In the first one we determine an approximation of the "generalised Cauchy point''. This point corresponds to the first local minimum of mk(s), following the steepest descent direction, at the intersection of the trust region with the region defined by the constraints. Some variables lie on the edge of the constrained region (e.g. the contributions xj of several spectra are equal to zero) when we are on the generalised Cauchy point. These variables are thus fixed to their bounds, and the second step minimises the quadratic model using only the variables that remain free. This computation, which is equivalent to resolving a sequence of linear equations, can be done with a conjugate gradient method or a factorisation method. The minimum sk of the quadratic model is then obtained.
For our problem, the number of non-redundant observables is large (several hundreds), so we have chosen a conjugate gradient method, because it is less expensive in memory and requires fewer operations than the factorisation method. It is also possible to choose a more refined variation of the conjugate gradient method, using for example a preconditioner to readjust the system to minimised. But these methods that find the minimum more quickly are still very expensives in memory.
Finally, to know if the point xk + sk can be used as the starting point of a new iteration, we compute the ratio
 |
(10) |
Thanks to the new large instruments, the thinness of the galactic
spectral lines is limited not by the spectral resolution that can be
instrumentally obtained but by the velocity dispersion of the galaxy,
![]() ,
that is an intrinsic limitation. The stellar
base spectra, at the resolution
,
that is an intrinsic limitation. The stellar
base spectra, at the resolution
![]() ,
have to be degraded in order to compare them to the galactic spectrum,
which generally have larger
,
have to be degraded in order to compare them to the galactic spectrum,
which generally have larger ![]() .
We convolve these spectra with a
Gaussian with
.
We convolve these spectra with a
Gaussian with
 .
.
To perform the synthesis and use Eq. (1), we need
spectra at the same ![]() .
For that, the code determines the
longest starting wavelength and the shortest ending wavelength amongst
all the stellar and galactic spectra. All the spectra are truncated
inside these bounds. Then, they are all brought to the same wavelength
step. The mean step is calculated for each spectrum. The spectrum with
the largest mean step is taken as a reference and all the other
spectra are resampled to this step. The code computes the corresponding
flux for these new
.
For that, the code determines the
longest starting wavelength and the shortest ending wavelength amongst
all the stellar and galactic spectra. All the spectra are truncated
inside these bounds. Then, they are all brought to the same wavelength
step. The mean step is calculated for each spectrum. The spectrum with
the largest mean step is taken as a reference and all the other
spectra are resampled to this step. The code computes the corresponding
flux for these new ![]() by a Fourier interpolation.
by a Fourier interpolation.
Finally, all the spectra are normalised to a same reference wavelength
step
![]() chosen inside a small window free of any
emission lines and without strong absorption lines. Each spectrum is
divided by the mean value of the flux measured inside this window.
chosen inside a small window free of any
emission lines and without strong absorption lines. Each spectrum is
divided by the mean value of the flux measured inside this window.
The accuracy of the synthesis is revealed graphically, superimposing the observed and synthetic spectra and computing the residual spectrum between them, and of course numerically thanks to the value of the objective function (Eq. (1)) calculated by Lancelot B. The lower this value, the closer from the observation the synthetic spectrum is.
This code produces an output file that provides the number of iterations to reach the solution, the value of the objective function for the synthetic galaxy obtained, and the stellar composition of this galaxy, together with the percentage of contribution of each stellar spectrum to the galactic spectrum at the reference wavelength. The contribution of the non stellar elements (blackbody and power law) and the value of their parameters (temperature, slope, reddening) are also displayed in this file.
It should be noted that each individual spectral type in a library should encompass a significantly large domain of temperature, gravity, and metallicity, because one cannot pretend to have as many types of stars in the database as those forming a galaxy. This usually prevents individual stars from being truly representative of one spectral type, so a number of stars with nearby stellar parameters should be averaged.
The acquisition of stellar spectra at medium/high spectral resolution in the infrared range is still too recent to be able to gather a large number of stellar observations covering a wide range of stellar parameters. There are too few observations of high-metallicity stars, for example, in the infrared. It would then be interesting to use a library of theoretical stars. However, the spectra computed with the available models of stellar atmospheres fail to adequately reproduce all the absorption lines of the observed stars (see Frémaux et al. 2006). These spectra are not reliable enough to be used for our purpose.
Most of the stellar spectra used in the present study come from observations by Meyer et al. (1998) with the Fourier Transform Spectrometer of the 4m Mayall telescope at the Kitt-Peak National Observatory (KPNO). These spectra have a mean resolution of R=3000 in the H-band and are corrected for the terrestrial atmospheric absorption. However, they are normalised in flux, which is not convenient for what we want to do. We therefore calibrated them in flux using the Pickles (1998) library, which has a lower resolution but a wider wavelength domain.
Several stellar spectra, most of them from supermetallic stars, observed by Boisson et al. (2002) with the ISAAC spectrograph of the VLT at a resolution of R=3500 have been added to the stellar database. These spectra are also corrected for the terrestrial atmospheric absorption and are calibrated in flux. To homogenise the stellar database, we decrease the resolution of these spectra down to R=3000.
There are no stars hotter than A type in our stellar database, because
the contribution of the O and B type stars is negligible in the
infrared, compared to cold or intermediate stars (A, F spectral
types). Only one A type star (a A0V) remains in the library. The deep
Brackett lines of this type of star are important spectral features,
so even a weak contribution will be detectable![]() . The remaining of the library is composed by stars of all
luminosity classes and of spectral type from F0 to M4, chosen to
describe at best the HR diagram. A particular emphasis has been put on
the metal-rich stars, whenever observations of such stars were
available.
. The remaining of the library is composed by stars of all
luminosity classes and of spectral type from F0 to M4, chosen to
describe at best the HR diagram. A particular emphasis has been put on
the metal-rich stars, whenever observations of such stars were
available.
From a mathematical point of view, a spectrum may be indistinguishable from a linear combination of others according to a goodness-of-fit criterion that accounts for noise, if some spectra are badly calibrated or if the spectral resolution is too low. To avoid multiple degenerate solutions for the minimisation problem, the information brought by each spectrum should not be possibly confused with the information brought by all the others. We thus synthesised each spectrum by all the others and checked whether they can all be distinguished well individually. Actually we had to remove some of them. The selection is made with the help of the synthetic distance Q. If it is large enough (we fix the limit to 10-4), the star is kept in the database. If the distance is too small, the synthesised star or some of the stars that "composed'' it are removed from the database. The final library contains 30 stars (Table 1 provides for each selected star, spectral type, luminosity class, and lifetime) out of 96 if we add the stars from Meyer et al. (1998) and those of Boisson et al. (2002).
Table 1: Synthesis of fake galaxies: akegal1 is built with a 30% contribution from the F3III type star spectrum, 40% from the rK3V type star one and 30% from the M2I one, fakegal2 has the same stellar contributions but is reddened by E(B-V)=0.1.
Before starting to work on a real observed galactic spectrum, we have to verifiy how the synthesis code is able to reproduce a spectrum with known parameters and at which level of accuracy. To do so, we build several test-galaxies from various contributions of the stellar spectra, possibly adding noise. The discrepancies between fiducial and estimated spectra indicate the limits of the method.
Several different compositions of stars are used to build the fake galaxies. For example, a test is made over three stars, an intermediate giant star (F3III type), a cold supergiant (M2I type), and a supermetallic rK3V type dwarf (see Table 1). In other tests the fake galaxies are composed of several stars with similar spectral types (for example, only G type dwarf stars or only cold M type stars of all luminosity classes) in order to study the most unfavourable cases that are potentially the most degenerate. All these test cases are very well-reproduced, the input contributions being found to within about one percent. The largest synthetic distances Q are a few 10-7. We stopped the convergenge according to a tolerance parameter. This parameter defines the practical (i.e. numerical) value of "zero''. There is a trade-off in determining this value: if too high the algorithm stops without convergence, too low it will run for ever. A good compromise between speed and machine precision, here approximately 10-7. Because this parameter is not exactly zero, this algorithm cannot guarantee 100% success, as pointed out in Table 1.
In a second step, we test the efficiency of the code to detect a non
stellar contribution to the synthetic spectrum, whose property is to
dilute differentially the absorption lines. A fake galaxy built with
three stellar spectra (F3III, rK3V, and M2I; the first test-galaxy
quoted above) and diluted by a 20% non stellar contribution from a
blackbody spectrum with a temperature of 1000 K is
synthesised very well (distance of
![]() ): the non stellar contribution
is within 3% of the exact value, the blackbody temperature within
50 K and the composition of the stellar spectrum within 2% of the
exact contributions. The residual 2% includes stars with
similar spectral types. Likewise, when we introduce a power law
spectrum or a reddening, the fake spectra are reproduced very well:
the maximum distances are about a few 10-6 (see
Table 1).
): the non stellar contribution
is within 3% of the exact value, the blackbody temperature within
50 K and the composition of the stellar spectrum within 2% of the
exact contributions. The residual 2% includes stars with
similar spectral types. Likewise, when we introduce a power law
spectrum or a reddening, the fake spectra are reproduced very well:
the maximum distances are about a few 10-6 (see
Table 1).
Without any noise, the contributions of each stellar spectrum, as well
as those of the non stellar spectrum, are determined to within 3% at
most, the blackbody temperature is found to within 50 K, and the
![]() parameter of the power law is known within 0.2 and the
E(B-V) parameter within 0.04. These tests are a source of knowledge
for the maximum degree of precision we can obtain with our synthesis
method and the present-day observations that do not allow to reach a
better accuracy.
parameter of the power law is known within 0.2 and the
E(B-V) parameter within 0.04. These tests are a source of knowledge
for the maximum degree of precision we can obtain with our synthesis
method and the present-day observations that do not allow to reach a
better accuracy.
The real galactic spectra are never obtained with an infinite
signal-to-noise ratio (S/N). It is thus necessary to evaluate the
accuracy of the synthesis according to the noise level. To do so we
took the previous fake spectra and added noise to each pixel. The
photon noise dominates the other sources of noise when we work on
bright objects like nearby galaxies. This noise is therefore
proportional to the square root of the flux. At each pixel we add a
random Gaussian variable with a null mean value and a typical
deviation of
![]() .
.
With an S/N=100, the fake galactic spectra composed only by stellar
parameters are still reproduced very well, the stellar contributions
are found within a few percent (the maximal deviation to the correct
result is around 5%). When the S/N decreases, the discrepancies
between the stellar population of the fake galaxy and its synthesis
increase up to almost 10% for an S/N of 40 (typical synthetic
distances are about
![]() ). This 10% difference for a given
stellar type is spread over stars of nearby spectral types with same
luminosity class. Such a result shows that we cannot pretend to obtain
a galaxy synthesis within a precise spectral type, but the
interpretation of the synthesis will not be modified if we find, for
example, a small contribution of an rG1V type star instead of an rG4V
type star. With a lower S/N, however, the noise becomes much too
strong to synthesise the spectrum, most of the spectral features
becoming too heavily contaminated.
). This 10% difference for a given
stellar type is spread over stars of nearby spectral types with same
luminosity class. Such a result shows that we cannot pretend to obtain
a galaxy synthesis within a precise spectral type, but the
interpretation of the synthesis will not be modified if we find, for
example, a small contribution of an rG1V type star instead of an rG4V
type star. With a lower S/N, however, the noise becomes much too
strong to synthesise the spectrum, most of the spectral features
becoming too heavily contaminated.
We notice that the cold M spectral type stars are more sensitive to the noise than other stars. Their caracteristic lines are smered more quickly into the noise, and it is possible to see a K type star instead of an M type star in the synthetic spectrum when the S/N is weak, in particular for the M dwarfs. When the fake galaxy contains early type stars (A or F spectra type), an S/N as low as 40 or below leads to a degeneracy between the contribution of these stars and the reddening.
The inclusion of non stellar parameters can also lead to a degeneracy
with stellar contributions, but for all kinds of stellar repartition.
In the presence of noise, when a blackbody component dilutes the
stellar spectrum, a perceivable degeneracy between the blackbody and
the hot stars appears. For example, with an S/N of 40, a fake
spectrum, composed of 20% from a blackbody at a temperature of 1000 K
and 80% from a stellar contribution, can be synthesised with up to
10% contribution from extra early type stars. At the same time, the
blackbody temperature is found at 660 K instead of 1000 K. The typical
synthetic distances obtained when non stellar contributions are
present in the fake spectrum are similar to those obtained without
them (about
![]() for an S/N of 40), so the value of the
synthetic distance cannot be the only argument for determining whether the
synthesis is correct or not. We also use astrophysical
knowledges to validate a solution given by the numerical code.
for an S/N of 40), so the value of the
synthetic distance cannot be the only argument for determining whether the
synthesis is correct or not. We also use astrophysical
knowledges to validate a solution given by the numerical code.
In the same way, we notice a large degeneracy between the reddening and the relative contributions of early and late type stars. A fake spectrum reddened with an E(B-V)=0.1 can be synthesised by a spectrum containing too much cold and undermetallic stars and without any reddening, while another spectrum with the same reddening parameter can be synthesised by a spectrum containing early type stars and a higher reddening, even with an S/N as high as 80.
In general, the stellar repartition of the synthetic spectra is not far away from the real one for an S/N down to 40. However, particular care should be taken when the result shows a high reddening parameter associated with a stellar population that goes toward warm A or F type stars.
The AGN power law index, ![]() ,
is the most difficult non stellar
parameter to extract. Indeed, in our small wavelength domain, a
variation of the parameter
,
is the most difficult non stellar
parameter to extract. Indeed, in our small wavelength domain, a
variation of the parameter ![]() only induces a weak variation in
the slope of the power law. If the spectrum of a fake galaxy, with an
S/N as high as 80, contains a 20% contribution from a power law with
only induces a weak variation in
the slope of the power law. If the spectrum of a fake galaxy, with an
S/N as high as 80, contains a 20% contribution from a power law with
![]() = 1.0 as the only non stellar parameter, it can be
synthesised as well with a 20% contribution from a power law with
= 1.0 as the only non stellar parameter, it can be
synthesised as well with a 20% contribution from a power law with
![]() = 0.5 and some reddening (
E(B-V) = 0.1). It can be fitted equally
well by a 15% contribution from the same power law and a 5%
contribution from a blackbody with a temperature of 1500 K. These are
only two examples among the numerous possible combinations of non stellar
parameters that can reproduce, with equivalent accuracy, a spectrum
containing 20% of power law, as soon as we add some noise.
= 0.5 and some reddening (
E(B-V) = 0.1). It can be fitted equally
well by a 15% contribution from the same power law and a 5%
contribution from a blackbody with a temperature of 1500 K. These are
only two examples among the numerous possible combinations of non stellar
parameters that can reproduce, with equivalent accuracy, a spectrum
containing 20% of power law, as soon as we add some noise.
In conclusion, without non stellar contributions, the stellar
population synthesis method described here is able to perfectly
recover the stellar contributions to the galactic spectrum, as long as
the S/N of the galactic spectrum is above 40. However, we still have
meaningful astrophysical results for
![]() .
.
Even if this method theoritically allows to find all the non stellar parameters of the studied galaxy, it is very difficult to do so in practice. Indeed, in the presence of non stellar components in a fake galactic spectrum, all the degeneracies previously set out are present as soon as the S/N is lower than 80. Few observed galactic spectra are obtained nowadays with such an S/N, thus we have to be extremely careful when we want to interpret real spectra of low luminosity or distant galaxies. A large contribution of hot stars, for example, may suggest either a higher blackbody temperature or a weaker reddening. Thus it would be mandatory, for a more reliable solution, to regularise the mathematical results by meaningful physical constraints upon the non stellar parameters. Such an additional contribution can be gained from an optical wavelength, from known AGN properties, or from a favourite stellar evolution model.
The stellar population of a circumnuclear region of this
Seyfert 1 galaxy![]() has already been studied in the visible range, while the
population of the most internal part of the galaxy was not reachable
owing to the large contamination of the spectrum by strong broad
emission lines due to the active nucleus in this wavelength range.
has already been studied in the visible range, while the
population of the most internal part of the galaxy was not reachable
owing to the large contamination of the spectrum by strong broad
emission lines due to the active nucleus in this wavelength range.
The near-IR range is nearly free of emission lines, for the first time allowing study of the population of the very nucleus. The new synthesis method described in this paper is suitable for completing such a study. In a first step, we determine the stellar population in the circumnuclear region that we compare to the previous results in order to further test our method.
This E/S0 type nearby galaxy (z=0.008) hosts a Seyfert 1 nucleus. The heavily reddened active nucleus has been studied and monitored in great detail in the X-ray, leading to estimations of the black hole mass or spin, the accretion disc properties, and the X-ray spectrum variability (see e.g. Vaughan & Fabian 2004; Ponti et al. 2004; Turner et al. 2004; Arévalo et al. 2005; Zycki & Niedzwiecki 2005; McHardy et al. 2005; Reynolds et al. 2005). However, the properties of the most central part of the host galaxy still remains, in comparison, rather unknown.
Its lenticular form is very elongated, and photometric observations
(Ferruit et al. 2000) show that it presents a dust lane south
of the nucleus (at a distance around 150 pc, as estimated by
Ballantyne et al. 2003), which should be the cause of the great
internal reddening measured by Reynolds et al. (1997) from the
hydrogen lines ratio H![]() /H
/H![]() that infers an E(B-V) value
between 0.61 and 1.09 for the central region.
that infers an E(B-V) value
between 0.61 and 1.09 for the central region.
The population of the host galaxy was studied, in the visible (Boisson et al. 2004) with the synthesis method described by Pelat (1997, 1998) and Moultaka & Pelat (2000) using the absorption lines equivalent widths as observables. Two circumnuclear regions of MCG-6-30-15 were synthesised, one ring lying between 200 and 510 pc from the nucleus and the other one between 510 and 790 pc. The spectra were obtained with the NTT telescope at La Silla, Chile, in the range 4500 to 9000 Å. The results infer a population composed mainly of old mildly metallic stars with a contribution of intermediate age stars (around 1 Gyr) that increases farther away from the galactic centre. A high intrinsic reddening, with E(B-V)=0.15 to 0.2, was inferred in these regions. The stellar population of the external regions of MCG-6-30-15 seems to be typical of lenticular galaxies with one (or more) stellar burst episode in the past Gyr.
Unfortunately, this study in the visible range could not access the stellar population of the most central part of the galaxy due to the strong emission lines that limit the number of observables that can be used for the synthesis.
Comparing the equivalent widths of the galactic absorption lines at
1.59, 1.62, and 2.29 ![]() m, with the equivalent width of the same
lines observed in stars and stellar clusters, Oliva et al.
(1999) determined the presence of a non-stellar continuum in
the internal region of this galaxy (with a slit aperture of 4.4'',
corresponding to
m, with the equivalent width of the same
lines observed in stars and stellar clusters, Oliva et al.
(1999) determined the presence of a non-stellar continuum in
the internal region of this galaxy (with a slit aperture of 4.4'',
corresponding to ![]() 600 pc), which they identify as a power law
with a parameter
600 pc), which they identify as a power law
with a parameter
![]() equal to 2.3. They interpret this
power law as dust emission at a temperature of 1100 K. This
continuum emission dilutes the stellar contribution that only amounts
to 40% of the total emitted flux at 1.62
equal to 2.3. They interpret this
power law as dust emission at a temperature of 1100 K. This
continuum emission dilutes the stellar contribution that only amounts
to 40% of the total emitted flux at 1.62 ![]() m. However, these
results obtained from very few absorption features are subject to high
uncertainties, the strength of the features depending on both the age
and the metallicity of the stellar population, but also on the level of
dilution by the non stellar components (that can vary from the H band to the K band).
m. However, these
results obtained from very few absorption features are subject to high
uncertainties, the strength of the features depending on both the age
and the metallicity of the stellar population, but also on the level of
dilution by the non stellar components (that can vary from the H band to the K band).
In this section, we try to recover the population of the external circumnuclear region from IR observations, using our new method of population synthesis. The results are compared to those we obtained previously in the visible range (Boisson et al. 2004).
We use the spectrum of the circumnuclear ring, lying between 200 and
510 pc from the nucleus of MCG-6-30-15, observed by Boisson et al.
(2002) with the ISAAC spectrograph on the VLT with a spectral
resolution of 4.5 Å FWHM and a sampling step of 0.79 Å. Note
that the S/N ratios are about 80 and 40 for the nuclear and the ring
spectra respectively. These authors have determined a velocity
dispersion of 83
![]() for this external region according to
two different methods, the cross-correlation method of Tonry & Davis
(1979) and the fit of the galactic spectrum by a stellar
spectrum convolved with a Gaussian. The stellar base spectra are
therefore degraded to be comparable to this galactic spectrum, as
shown in the Sect. 2.2. No AGN contribution is expected
in a circumnuclear region so far away from the nucleus, so it is
fixed to zero.
for this external region according to
two different methods, the cross-correlation method of Tonry & Davis
(1979) and the fit of the galactic spectrum by a stellar
spectrum convolved with a Gaussian. The stellar base spectra are
therefore degraded to be comparable to this galactic spectrum, as
shown in the Sect. 2.2. No AGN contribution is expected
in a circumnuclear region so far away from the nucleus, so it is
fixed to zero.
Table 2: Summary of the syntheses of the external region for different settings for the non stellar parameters. In the first column, BB means "blackbody'', PL "power law'', D corresponds to the synthetic distance obtained. (1) the contribution of the power law is fixed to zero, (2) same as the previous one with the reddening parameter E(B-V) fixed to 0.6, (3) same as (1) with the blackbody contribution fixed to zero. The fixed parameters are indicated in bold font.
When the blackbody and the reddening parameters are free parameters, the synthetic spectrum contains a small contribution of a blackbody spectrum with a temperature of 300 K, which is an acceptable value for the temperature of dust grains at several hundred parsecs away from the nucleus. The reddening is found equal to zero (case 1, see Table 2). However, this galaxy should, on the contrary, have a high internal reddening (e.g. Reynolds et al. 1997, who found an E(B-V) between 0.61 and 1.09, for the emission line region). Thus, in a second step, we have imposed a minimum value of 0.6 for the reddening parameter (case 2), still leaving the blackbody contribution free. The result is very close to the case 1 for the stellar contributions, but we notice a lower contribution of the blackbody, which compensates for the reddening of the spectrum.
We have also fixed the contribution of the blackbody to zero (as well as the one of the power law) in order to leave the reddening as the only non stellar parameter (case 3). The synthetic spectrum obtained is then reddened with a value of E(B-V)=1.10, in agreement with the maximum value determined by Reynolds et al. (1997). The overall distribution of the stars is quite similar for all the cases: we find a contribution of about 25% for the intermediate dwarf stars, 10% for the metal-rich G dwarf stars, about 30% for the cold dwarf stars, and 35% for the cold giant stars.
The synthetic distance obtained is very close in all 3 cases (between
![]() and
and
![]() )
and residuals are quite similar.
Figure 2 we provide the comparison between the observed
and synthetic spectra obtained in case 2 (contribution of the
power law fixed to zero and reddening fixed to
E(B-V)=0.6, all the
other parameters remaining free).
)
and residuals are quite similar.
Figure 2 we provide the comparison between the observed
and synthetic spectra obtained in case 2 (contribution of the
power law fixed to zero and reddening fixed to
E(B-V)=0.6, all the
other parameters remaining free).
![\begin{figure}
\par\includegraphics[width=\columnwidth,height=8cm]{6732fig2.ps}\end{figure}](/articles/aa/full/2007/38/aa6732-06/img69.gif) |
Figure 2:
Observed spectrum of the external region of MCG-6-30-15 (solid black line) and synthetic spectrum (grey line: case 2, Table 2). Residuals corresponding to the relative difference between the observation and the synthetic spectra (
|
| Open with DEXTER | |
Table 3: Stellar contributions to the galactic spectrum in the visible range by Boisson et al. (2004), converted to the near infrared range.
![\begin{figure}
\par\includegraphics[width=\columnwidth,height=8cm]{6732fig3.ps}\end{figure}](/articles/aa/full/2007/38/aa6732-06/img71.gif) |
Figure 3:
Observed spectrum of the internal region of MCG-6-30-15 (solid black line) and diluted spectrum of the external region (grey line; R=3600,
|
| Open with DEXTER | |
![\begin{figure}
\par\includegraphics[width=\columnwidth,height=8cm]{6732fig4.ps}\end{figure}](/articles/aa/full/2007/38/aa6732-06/img73.gif) |
Figure 4:
Observed spectrum of the internal region of MCG-6-30-15 (solid black line) and synthetic spectrum (grey line: case 3, Table 4), at the stellar base resolution (R=3000,
|
| Open with DEXTER | |
It is worth pointing out that all the results described here were
obtained without any help from merit functions, which can attribute
more or less weight to different parts of the spectrum. However, the
edges of the spectral domain are often subject to larger uncertainties
due to e.g. flux calibration errors, and indeed we notice in the
Fig. 2 that the edges are the least well-fitted parts
of the spectrum. We therefore perform some syntheses attributing less
weight to these regions, as well as higher weight to the regions
containing the strongest absorption lines around 1.58, 1.59 and
1.62 ![]() m, but the results obtained in this way do not change the
composition of the stellar population distribution of the synthetic
galaxy.
m, but the results obtained in this way do not change the
composition of the stellar population distribution of the synthetic
galaxy.
To compare the results obtained in the visible and the near infrared domain, Table 3 provides the stellar contribution of the population determined in the visible by Boisson et al. (2004). These contributions are also transcribed in the near infrared since they vary with wavelength. It shows a rather weak contribution (less than 10%) of intermediate type star, and a major contribution (about 60%) of metal-rich cold giant stars, the remaining flux being supplied by G to M solar metallicity dwarf stars.
The results in the infrared range in the present study provide a younger stellar population if we compare with the results in the visible. Indeed, based on the optical spectrum, the cold giant stars are the main contributors in the near-IR, and the contribution of intermediate type dwarf stars is lower. However, we suspect that the infrared stellar spectra library that we use does not describe the HR diagram with sufficient completeness, in particular for the supermetallic stars. Indeed, our library is totally lacking in supermetallic giant stars, while these last contribute about 40% according to the results obtained by Boisson et al. (2004). The lack of such stars could result in the spurious increase in the contribution of strong-lined stars that are not supermetallic, like dwarf M stars; to compensate for a red continuum the synthesis includes an enhanced contribution from intermediate F type stars.
Furthermore, we noticed in Sect. 4 that hot stars and reddening can be degenerate, their effects being able to compensate for each other. Indeed, the reddening found here is higher than the value of 0.2 found by Boisson et al. (2004), and at the same time, we find a stronger contribution of intermediate stars.
In conclusion, the study of Boisson et al. (2004) has determined a population mainly composed by old stars plus a small component of intermediate ones. Similar conclusions can be drawn from our study in the infrared as the main contributors to the synthetic spectrum consist in an old stellar population (M dwarf and giant stars). The remaining come from intermediate stars, which can be the signature of a recent stellar burst. However, in the IR, the old stellar component is certainly underestimated because of the lack of supermetallic stars in the database and, in addition, we cannot conclude much about the metallicity of the population.
Boisson et al. (2002) have shown that it is possible to
recover the spectrum of the inner 100 pc of the galaxy by diluting the
spectrum of the external region with 20% of a power law spectrum with
a slope
![]() and 30% of a blackbody spectrum with a
temperature of 600 K. This spectrum has also to be reddened with an
additional
E(B-V)=0.5, in agreement with the greater intrinsic
reddening of MCG-6-30-15 in its internal region (see Reynolds et al.
1997).
and 30% of a blackbody spectrum with a
temperature of 600 K. This spectrum has also to be reddened with an
additional
E(B-V)=0.5, in agreement with the greater intrinsic
reddening of MCG-6-30-15 in its internal region (see Reynolds et al.
1997).
Table 4: Summary of the syntheses of the internal region obtained for different settings for the non stellar parameters. In the first column, BB means "blackbody'', PL "power law'', D corresponds to the synthetic distance obtained. (1) the lower bound of the E(B-V) parameter is fixed to 0.8, (2) same as the previous one with upper bound for the contribution of the power law fixed to 30%, (3) same as the first one with the blackbody temperature fixed to 1200 K. The constraint parameters are indicated in bold font.
We tried to reproduce this result by fitting the nuclear spectrum
without the use of the stellar library, but with the external region
spectrum imposed and the non stellar components as free parameters. We then
obtain a dilution of 56.1% by a power law with
![]() and
of 2.8% by a blackbody with a temperature of 300 K, and a reddening
E(B-V)=0.3 (see Fig. 3). Thus the external region
spectrum is diluted by about 60% of non stellar contributions, which
is close to the result previously found by Boisson et al.
(2002). However, the repartition between the blackbody and the
power law is different. If we fix a 30% contribution for the
blackbody, we obtain a result that is similar from a mathematical point of
view (synthetic distance of
and
of 2.8% by a blackbody with a temperature of 300 K, and a reddening
E(B-V)=0.3 (see Fig. 3). Thus the external region
spectrum is diluted by about 60% of non stellar contributions, which
is close to the result previously found by Boisson et al.
(2002). However, the repartition between the blackbody and the
power law is different. If we fix a 30% contribution for the
blackbody, we obtain a result that is similar from a mathematical point of
view (synthetic distance of
![]() instead of
instead of
![]() )
with a power law contribution of 27.8%; the blackbody temperature is
now 1140 K and the reddening is null. Because the absence of reddening is
not an appropriate result for the nucleus, which again shows the strong
degeneracy between all the non stellar parameters, we are obliged to
constrain some parameters.
)
with a power law contribution of 27.8%; the blackbody temperature is
now 1140 K and the reddening is null. Because the absence of reddening is
not an appropriate result for the nucleus, which again shows the strong
degeneracy between all the non stellar parameters, we are obliged to
constrain some parameters.
Now we perform the synthesis of the inner 100 pc with our stellar
database (results shown in Table 4). Boisson et al.
(2002) have determined a velocity dispersion of 69
![]() for this region. Due to the supposed greater dilution and higher
reddening of the internal region, compared to the external one, we
impose a minimum of 0.8 for the reddening parameter E(B-V) for case 1.
We then obtain a very strong dilution (about 80% by a power law with
for this region. Due to the supposed greater dilution and higher
reddening of the internal region, compared to the external one, we
impose a minimum of 0.8 for the reddening parameter E(B-V) for case 1.
We then obtain a very strong dilution (about 80% by a power law with
![]() and 2% by a blackbody at 300 K). The power law
contribution may be too high, so we have made another attempt to
limit the power law contribution to 30% (case 2). The blackbody
contribution then increases to keep a dilution of about 70% by the
non stellar components, and the blackbody temperature increases to
1500 K. If we free the power law contribution and fix the
blackbody temperature to a value of 1200 K (case 3), as 1500 K is a
very high temperature for dust grains, we still obtain a total
dilution of about 80% but with a smaller contribution from the powerlaw
component, compared to the first case.
and 2% by a blackbody at 300 K). The power law
contribution may be too high, so we have made another attempt to
limit the power law contribution to 30% (case 2). The blackbody
contribution then increases to keep a dilution of about 70% by the
non stellar components, and the blackbody temperature increases to
1500 K. If we free the power law contribution and fix the
blackbody temperature to a value of 1200 K (case 3), as 1500 K is a
very high temperature for dust grains, we still obtain a total
dilution of about 80% but with a smaller contribution from the powerlaw
component, compared to the first case.
The stellar contributions are highly dominated by M type stars in all
the cases. The giant stars are the major contributor in cases 1 and 3,
but the dwarf stars component is comparable in case 2. As for the
external region, the stellar population does not contain any
supergiants. The synthetic distances of these tests are contained
between
![]() and
and
![]() .
Figure 4
we graphically show the result obtained for case 3, and
Table 4 sums up the stellar populations and the non
stellar parameters of the different attempts.
.
Figure 4
we graphically show the result obtained for case 3, and
Table 4 sums up the stellar populations and the non
stellar parameters of the different attempts.
All the cases show that the stellar population in the internal region is older than in the external region. We do not notice any sign of a recent stellar burst, in agreement with the hypothesis of an age sequence for the different classes of AGN where Seyfert 1 should be quite old compared to starburst and Seyfert 2 galaxies (Boisson et al. 2000).
In this paper, we have described a new inverse method of stellar synthesis using flux as the observables, instead of equivalent widths. It allows determination of the stellar populations in wavelength ranges where the stellar lines are diluted by non stellar continua, as in the infrared range.
This method allows recovery of the population distribution of an
astrophysical object for an S/N of ![]() 40 and more with the use of
a stellar database. The run of several tests of the code in the
infrared range has shown that the exact balance of non stellar
contributions is quite hard to determine in the presence of noise.
The results obtained for the non stellar parameters are then to be
taken with care. It could be helpful to impose some astrophysical
constraints on the non stellar parameters due to their strong
degeneracy. The joint synthesis of optical and near IR data could
help, as would the knowledge of reddening or the continuum shape
gained via other wavelength bands or observational techniques (e.g.
imaging).
40 and more with the use of
a stellar database. The run of several tests of the code in the
infrared range has shown that the exact balance of non stellar
contributions is quite hard to determine in the presence of noise.
The results obtained for the non stellar parameters are then to be
taken with care. It could be helpful to impose some astrophysical
constraints on the non stellar parameters due to their strong
degeneracy. The joint synthesis of optical and near IR data could
help, as would the knowledge of reddening or the continuum shape
gained via other wavelength bands or observational techniques (e.g.
imaging).
Under these conditions, synthesis of a type 1 AGN is possible. The spectrum of the internal region of MCG-6-30-15 is heavily diluted by the non stellar components, the AGN continuum emission in particular. The circumnuclear region of this galaxy in the infrared provides a population dominated by old stars, but including some young stars that suggest a more or less recent episode of star formation in the external region. These results agree with those obtained previously. This also substantiates the idea of an age sequence: we can classify the starbursts, the Seyfert 2, the Seyfert 1, and then the LINERs from the younger to the older (e.g. Joly et al. 2001).
Although the method cannot fully disentangle the dust emission from the power law contribution, in our small wavelength range, the method is powerful enough to derive the stellar content of the very central part of AGN. However, the results for the stellar population are still tentative, because the incompleteness of the stellar base (lack of supermetallic giant stars) could lead to large uncertainties.
Whatever the IR library used, individual stellar spectra or SSP, we are facing a common problem in the lack of high spectral resolution IR data (observed spectra, as well as "theoretical'' ones, Frémaux et al. 2006) leading to the incompleteness of the HR diagram coverage. New observations, in particular of metal-rich stars, are thus mandatory to build a complete stellar library that can be used to synthesise the spatially unresolved stellar population of galaxies or star clusters as accurately as possible.