A&A 473, 389-398 (2007)
DOI: 10.1051/0004-6361:20066005
NGC 5218 - a starburst driven LINER galaxy?
High resolution CO, radio continuum and H I-absorption
E. Olsson1 - S. Aalto1 - M. Thomasson1 - R. Beswick3 - S. Hüttemeister2
1 - Chalmers University of Technology, Department of
Radio and Space Science, Onsala Space Observatory, 43992 Onsala, Sweden
2 -
Astronomisches Institut der Universität Bochum,
Universitätsstraße 150, 44780 Bochum, Germany
3 - The University of Manchester, Jodrell Bank Observatory, Macclesfield, Cheshire SK11 9DL, UK
Received 10 July 2006 / Accepted 19 June 2007
Abstract
Aims. We investigate the distribution of molecular and atomic gas and the nature of the power source of the LINER (Low-Ionisation Nuclear Emission-line Region) activity in NGC 5218.
Methods. We performed a multi wavelength study of the barred interacting LINER galaxy NGC 5218. We used the Owens Valley Radio Observatory to obtain interferometer data of CO 1-0, the Multi Element Radio Linked Interferometer for 1.4 GHz continuum and HI-absorption, and the Onsala Space Observatory to obtain single dish data of CO 1-0, HCN 1-0 and HCO+ 1-0.
Results. Toward the center of the galaxy, we have detected a double CO peak. The peaks are separated by 2'' (380 pc). The observed peaks appear to be caused by an almost edge-on ring of molecular gas with a radius of 470 pc and a rotational velocity of 140
 .
We see no kinematical signs of a compact nuclear disc. However, there are kinematical signs of an expanding shell of molecular gas at the eastern side of the ring. The mass of the gas involved in the expansion is 7
.
We see no kinematical signs of a compact nuclear disc. However, there are kinematical signs of an expanding shell of molecular gas at the eastern side of the ring. The mass of the gas involved in the expansion is 7 
 ,
and we suggest that the expansion is driven by a burst of supernovae that took place some 5
106 years ago. We estimated that 10 000 supernovae were required to drive the expansion and that the corresponding number of supernovae per year was 0.002 over the age of the expanding shell. The radio continuum peak agrees well in space with the expanding molecular shell, and the HI-absorption agrees well in both space and velocity, and supports the notion of an expanding shell. We find that the radio flux density and the bulk of the FIR are associated with nuclear, but slightly off-centre, star formation in the central R=2'' (380 pc).
,
and we suggest that the expansion is driven by a burst of supernovae that took place some 5
106 years ago. We estimated that 10 000 supernovae were required to drive the expansion and that the corresponding number of supernovae per year was 0.002 over the age of the expanding shell. The radio continuum peak agrees well in space with the expanding molecular shell, and the HI-absorption agrees well in both space and velocity, and supports the notion of an expanding shell. We find that the radio flux density and the bulk of the FIR are associated with nuclear, but slightly off-centre, star formation in the central R=2'' (380 pc).
Conclusions. We suggest a scenario where shock fronts of the expanding shell shock heat the surrounding gas, and give rise to a LINER like spectrum. We conclude that the LINER activity observed in NGC 5218 is probably due to nuclear starburst activity, and not to AGN-activity. A fraction of the molecular gas in the bar, outside of the central region, appears to be in a different, gravitationally unbound phase, possibly on x2 orbits to the large scale optical bar.
Key words: galaxies: evolution
- galaxies: individual: NGC 5218
- galaxies: starburst
- galaxies: ISM
- galaxies: active
It has long been known that certain galaxies have nuclear emission-line
spectra that are not typical for either Starburst or Seyfert galaxies, but
have similarities with both. If certain criteria of the intensity ratios
of the emission-lines are met, the galaxy is defined as containing
a LINER (Low-Ionisation Nuclear Emission-line Region). At present, there is still
no single consensus to what is powering the emission in LINERs, and it may be possible that it differs between individual LINER galaxies.
Central activity in galaxies has been suggested by e.g. Ho (1999) to be the most
common power source in LINERs, and gravitational interaction between galaxies
(e.g. Byrd et al. 1986) are thought to be connected to central activity. The
interaction would trigger an inflow of gas which then feeds the central
activity. Bars may also be instrumental in letting the gas flow to the center, but
the exact mechanisms behind, and the timescales for the process, are still
unclear.
NGC 5218 is an SBb pec galaxy
hosting a LINER (Veilleux et al. 1995) at its center. The galaxy is barred, has a high FIR luminosity (L

 )
and is in distant interaction with
the early type galaxy NGC 5216 (see Fig. 1). This system has been previously studied in HI in emission (e.g. Cullen et al. 2003). We carried out a multi wavelength study of NGC 5218, using the Owens Valley Radio Observatory (OVRO) and the Onsala 20-m telescope to study the distribution, dynamics and properties of the molecular gas, and the Multi Element Radio Linked Interferometer (MERLIN) to map the 1.4 GHz continuum and H I absorption. The purpose of this investigation was to
study the morphology and kinematics of the cold gas within NGC 5218 from large to central scales. The arc second resolution molecular and radio maps may provide information about the feeding and nature of the central activity giving rise to the LINER like spectrum in NGC 5218. In particular, we would like to address the question whether the LINER activity is due to an AGN or to a nuclear starburst.
)
and is in distant interaction with
the early type galaxy NGC 5216 (see Fig. 1). This system has been previously studied in HI in emission (e.g. Cullen et al. 2003). We carried out a multi wavelength study of NGC 5218, using the Owens Valley Radio Observatory (OVRO) and the Onsala 20-m telescope to study the distribution, dynamics and properties of the molecular gas, and the Multi Element Radio Linked Interferometer (MERLIN) to map the 1.4 GHz continuum and H I absorption. The purpose of this investigation was to
study the morphology and kinematics of the cold gas within NGC 5218 from large to central scales. The arc second resolution molecular and radio maps may provide information about the feeding and nature of the central activity giving rise to the LINER like spectrum in NGC 5218. In particular, we would like to address the question whether the LINER activity is due to an AGN or to a nuclear starburst.
The OVRO mm interferometer was used to map NGC 5218
in CO 1-0 in the inner 30'' (R=5.7 kpc). The array consists of six
10.4 m telescopes, and we used the low and
high resolution array configuration. The observations were carried
out in May 1996 (low resolution) and January 2004 (high resolution).
The NRAO AIPS software package was used to
deconvolve the images. The low and high resolution data-sets were combined into one single
data-set. Different tapers and weighting schemes were applied to these data to produce both low
resolution maps with high sensitivity and high resolution maps with lower sensitivity. For the
low resolution maps, the data-set was uv-tapered to include baselines up to 65 k ,
and
a natural weighting was applied. This resulted in a synthesised beam of
,
and
a natural weighting was applied. This resulted in a synthesised beam of

 .
For the high resolution maps, an almost uniform weighting was
applied (robustness parameter -4), which resulted in a synthesised beam of
.
For the high resolution maps, an almost uniform weighting was
applied (robustness parameter -4), which resulted in a synthesised beam of

 .
The primary beam diameter was 60''.
The digital correlator was centered at 114.2 GHz (2900
)
and was configured to cover 448 MHz (1120
), with 16 MHz (40
)
resolution. Typical system temperatures were 400 K.
.
The primary beam diameter was 60''.
The digital correlator was centered at 114.2 GHz (2900
)
and was configured to cover 448 MHz (1120
), with 16 MHz (40
)
resolution. Typical system temperatures were 400 K.
Single dish CO 1-0 data were obtained in April 2002 with the Onsala 20 m
telescope in seven positions on NGC 5218. A filter bank with 512 channels of 1 MHz each was used as backend. The corresponding velocity resolution was 2.6
and the total velocity width was 1340
.
The FWHM beam width of the telescope was 33'', which corresponds to  6 kpc at the distance of NGC 5218. The main beam efficiency,
 ,
was 0.5 and the system temperature was typically 500 K. NGC 5218 was observed towards the center position as well as 30'' offset in the eastern, western, northern and southern directions. Toward the east and the west, observations were also carried out at 45'' offset positions.
,
was 0.5 and the system temperature was typically 500 K. NGC 5218 was observed towards the center position as well as 30'' offset in the eastern, western, northern and southern directions. Toward the east and the west, observations were also carried out at 45'' offset positions.
The same telescope was used in April and May 2003 to obtain HCN and HCO+ 1-0 data toward the center position of NGC 5218. The FWHM beam width was 44'', corresponding to 8 kpc, and the main beam efficiency,
,
was 0.7. The backend correlator was used in its widest mode, with 1600 channels of 800 kHz each. This provided a total bandwidth of 1280 MHz. The corresponding velocity bandwidth was 4300
,
and the velocity resolution was 2.7
.
Typical system temperatures were 350 K.
The wide total bandwidth was sufficient for the lines to be simultaneously observed and fitted into the same spectrometer
band, which eliminates relative pointing errors between the two lines.
MERLIN was used in August 2005 to observe NGC 5218 at 1420 MHz. The 76-m Lovell Telescope was included. The observations were interspersed with regular observations of the nearby phase calibrator 1337+637. 3C 286 was used as the primary calibrator and 2134+004 as the secondary. They were both observed at the beginning and end of the observing run. Dual bands of circular polarization were recorded over a total bandwidth of 8 MHz, which was correlated into 64 channels width a bandwidth of 125 kHz each, which equals a velocity resolution of 26 km s-1. Initial editing and calibration of the data was done at Jodrell Bank in September 2005 using the local MERLIN DPROGS software. The data were read into AIPS and further calibration was done using the MERLIN pipeline, which included several cycles of self calibration on the phase calibrator. Our target source was not itself suitable for self-calibration, following the constraints given in the MERLIN handbook, so the phase corrections derived from the phase calibrator were applied to our target source in the MERLIN pipeline. The calibrated uv data-set was Fourier transformed with no deconvolution initially applied. The line free channels were combined to produce continuum images which were used to subtract the continuum contribution in the spectral line cubes. Two different weighting schemes were applied to the data in order to obtain maximum sensitivity and angular resolution. For maximum sensitivity, the data were uv-tapered to 700 k
and a natural weigting was applied. The synthesized beam was convolved to
 .
For maximum angular resolution, an almost uniform weighting (robustness parameter -4) was applied. The resulting synthesized beam was
.
For maximum angular resolution, an almost uniform weighting (robustness parameter -4) was applied. The resulting synthesized beam was

 .
The field of view in both cases was of the order of 0.5
.
The field of view in both cases was of the order of 0.5 .
The MERLIN instrumental response was removed from the continuum images and from the continuum subtracted spectral line cubes using the AIPS task APCLN. Further analysis such as presenting cleaned contoured continuum images and absorption spectra were done with AIPS standard tasks.
.
The MERLIN instrumental response was removed from the continuum images and from the continuum subtracted spectral line cubes using the AIPS task APCLN. Further analysis such as presenting cleaned contoured continuum images and absorption spectra were done with AIPS standard tasks.
![\begin{figure}
\par\includegraphics[width=9cm,clip]{6005fig2.eps}\end{figure}](/articles/aa/full/2007/38/aa6005-06/Timg25.gif) |
Figure 2:
Integrated intensity ( upper panel), velocity field ( middle panel) and velocity width ( lower panel) of NGC 5218 derived from the UV-tapered (65 k)
naturally weighted data. The integrated intensity contours are in percent of the peak value of 86 Jy km s-1 per beam of
.
The levels are 1.7, 3, 5.2, 9, 15.6, 27, 46.8 and 81%. The integrated intensity gray scale range is from 0 to 80 Jy km s-1 beam-1. The velocity field contours are from 2820 to 3000 km s-1, with 20 km s-1 increments. The velocity field grey scale range is from 2800 to 3020 km s-1. The velocity width contours are 30, 40, 50, 60 and 70 km s-1 and the velocity width grey scale is from 0 to 70 km s-1. |
| Open with DEXTER |
Figure 2 (upper panel) shows the
integrated intensity map derived from the UV-tapered (65 k)
naturally weighted data.
We detect a roughly circular central CO-feature with a diameter of 8'' (1.5 kpc). An
extension with CO at lower integrated intensities protrudes an additional 5'' to the east,
hence the CO distribution is asymmetric with
respect to the central peak. The total integrated intensity detected is 93 Jy
.
A standard CO to H2 conversion factor (see Table 1) was
used to calculate a total molecular mass of 1.3
 .
The maximum flux in one beam (
)
is 86 Jy
.
This is 93% of the total flux, and yields a projected surface density of 2600
.
The maximum flux in one beam (
)
is 86 Jy
.
This is 93% of the total flux, and yields a projected surface density of 2600 
 in the central beam. The adopted inclination of
 indicates that the true surface density may more likely be 1800
.
indicates that the true surface density may more likely be 1800
.
The velocity field map is shown in the middle panel of Fig. 2. The central 8'' (1.5 kpc) has regularly spaced velocity contours with velocities ranging from 2820 to 2960
.
This may indicate solid body rotation, but may also be an effect of insufficient spatial resolution. On a linear scale, the observed velocity gradient corresponds to 100
per kpc. A constant velocity gradient is also seen in the position velocity diagram (Fig. 3), where the velocity increases steadily out to a radius of about 4''. For the central few arc seconds, this may again be a smearing effect due to insufficient resolution. At larger radii, the velocity curve turns and becomes flat.
The lower panel of Fig. 2 shows the velocity width map. The peak occurs slightly northeast of the peak of the integrated intensity, which may indicate an additional kinematical component in this region. It may also be an effect of lack of spatial resolution or the lower signal to noise ratio outside of the central beam.
Table 1:
NGC 5218: adopted properties.
![\begin{figure}
\par\includegraphics[width=9cm,clip]{6005fig3.eps}\end{figure}](/articles/aa/full/2007/38/aa6005-06/Timg40.gif) |
Figure 3:
Position-velocity diagram derived from the UV-tapered (65 k)
naturally weighted data. The position-velocity diagram is averaged over a 2'' wide slit posotioned as the rectangle in the upper panel. The contour levels in the position-velocity diagrams start at 50 mJy beam-1 and increase with a factor of 1.2 per level. |
| Open with DEXTER |
![\begin{figure}
\par\includegraphics[width=9cm,clip]{6005fig4.eps}\end{figure}](/articles/aa/full/2007/38/aa6005-06/Timg41.gif) |
Figure 4:
Onsala 20-m single dish cross map, with spectra toward the center, offset 30'' in each direction and offset 45'' to the east and west. |
| Open with DEXTER |
3.2 The Onsala Space Observatory CO results
The results from the CO 1-0 observations carried out with the Onsala 20-m telescope are presented in Fig. 4. We detect the presence of significant amounts of molecular gas in the center, and at a radius of 30'' in the eastern, western and southern direction. No significant
amount of molecular gas is detected in the northern direction (30''), or at
larger radius (45'') in the eastern and western direction. The peak OSO antenna
temperature toward the center of NGC 5218 is
 mK.
At both the eastern and western 45'' offset positions, the lack of gas detected indicates that the bulk of the gas in the 30'' offset positions originates in the inner half of the OSO beam. The FWHM beam width of the OSO beam is 33'', hence the bulk of the gas detected in the 30'' offset positions originates at radii of approximately 14'' to 30''.
We have converted the OVRO low resolution flux density in Jy to a source temperature in Kelvin with the formula
mK.
At both the eastern and western 45'' offset positions, the lack of gas detected indicates that the bulk of the gas in the 30'' offset positions originates in the inner half of the OSO beam. The FWHM beam width of the OSO beam is 33'', hence the bulk of the gas detected in the 30'' offset positions originates at radii of approximately 14'' to 30''.
We have converted the OVRO low resolution flux density in Jy to a source temperature in Kelvin with the formula
where d is the angular source size in radians (
 for
elliptical sources). An expected OSO antenna temperature was estimated with
the product of the source temperature above and the source filling factor in
the OSO beam,
for
elliptical sources). An expected OSO antenna temperature was estimated with
the product of the source temperature above and the source filling factor in
the OSO beam,
 .
Our expected OSO antenna
temperature towards the center of NGC 5218 is thereby 40 mK, which
agrees well with our observations and indicates that the missing flux in the OVRO
beam is small (10%). However, for the OSO CO 1-0 observations at positions offset to the center, the situation is different. In both the eastern and western positions offset 30'', we detect 50% of the integrated intensity in the central OSO beam (see Table 2). The FWHM of the OSO beam is 33
.
Our expected OSO antenna
temperature towards the center of NGC 5218 is thereby 40 mK, which
agrees well with our observations and indicates that the missing flux in the OVRO
beam is small (10%). However, for the OSO CO 1-0 observations at positions offset to the center, the situation is different. In both the eastern and western positions offset 30'', we detect 50% of the integrated intensity in the central OSO beam (see Table 2). The FWHM of the OSO beam is 33
 ,
hence an offset of 30'' equals almost one full beam, and thus the integrated intensity in the offset positions is mostly a result of gas distributed outside of the central OSO beam of 33''. In the OVRO map we detect no gas at all outside of the central OSO beam, indicating that the gas outside of the central structure (8''
13'') detected by OVRO may be in a different smooth diffuse phase, not detectable with OVRO.
,
hence an offset of 30'' equals almost one full beam, and thus the integrated intensity in the offset positions is mostly a result of gas distributed outside of the central OSO beam of 33''. In the OVRO map we detect no gas at all outside of the central OSO beam, indicating that the gas outside of the central structure (8''
13'') detected by OVRO may be in a different smooth diffuse phase, not detectable with OVRO.
3.3 The OVRO high resolution CO
Figure 5 (upper panel) shows the
integrated intensity map derived from the robustly weighted (robustness parameter -4) data. The CO is double peaked and is distributed over what appears to be an inclined, almost edge on ring. The separation between the CO peaks is 2'' (380 pc). Both peaks are of very similar integrated intensity, although the maximum value does occur at the eastern peak at this resolution. The total integrated intensity detected is 51 Jy
.
For a standard conversion factor, this corresponds to a molecular mass of 7
 .
The maximum projected surface density occurs at the eastern peak and is 10 000
.
The reason for this very high gas surface density is partly due to the almost edge on geometry of the ring, which increases the observed column path length at the eastern and western ends of the ring. The middle panel in Fig. 5 shows the velocity field. Most of the detected molecular gas appears to be part of the main rotation of the inclined ring. The western end is approaching and the eastern end receding. However, at the eastern end the velocity field lines are more irregular, and show signs of an additional kinematic component. These signs are also seen in the velocity width map (lower panel), which has its peak value at the eastern end. In the position velocity diagram (Fig. 6) both the main rotation of the ring, as well as the eastern additional kinematical component are detected and well separated. This is explained in more detail in Sect. 4.2.2. The western peak associated with the ring occurs at 2835
.
The angular distance to the corresponding eastern peak is 2.7'' and it peaks at a velocity of 2990
.
Slightly closer to the dynamical center of these two components, but still on the eastern end, there are three additional peaks at lower velocities (2930, 2890 and 2865
). These components do not have a counterpart on the western side.
.
The maximum projected surface density occurs at the eastern peak and is 10 000
.
The reason for this very high gas surface density is partly due to the almost edge on geometry of the ring, which increases the observed column path length at the eastern and western ends of the ring. The middle panel in Fig. 5 shows the velocity field. Most of the detected molecular gas appears to be part of the main rotation of the inclined ring. The western end is approaching and the eastern end receding. However, at the eastern end the velocity field lines are more irregular, and show signs of an additional kinematic component. These signs are also seen in the velocity width map (lower panel), which has its peak value at the eastern end. In the position velocity diagram (Fig. 6) both the main rotation of the ring, as well as the eastern additional kinematical component are detected and well separated. This is explained in more detail in Sect. 4.2.2. The western peak associated with the ring occurs at 2835
.
The angular distance to the corresponding eastern peak is 2.7'' and it peaks at a velocity of 2990
.
Slightly closer to the dynamical center of these two components, but still on the eastern end, there are three additional peaks at lower velocities (2930, 2890 and 2865
). These components do not have a counterpart on the western side.
![\begin{figure}
\par\includegraphics[width=9cm,clip]{6005fig5.eps}\end{figure}](/articles/aa/full/2007/38/aa6005-06/Timg48.gif) |
Figure 5:
Integrated intensity ( upper panel), velocity field ( middle panel) and velocity width ( lower panel) of NGC 5218 derived from the robustly weighted (robustness parameter -4) data. The integrated intensity contours are in percent of the peak value of
34 Jy km s-1 per beam of
.
The levels are 5
(1.4, 2, 2.8, 4, 5.6, 8, 11.2, and 16)%. The integrated intensity gray scale range is from 0 to 34 Jy km s-1 beam-1. The velocity field contours are from 2820 to 2940 km s-1, with 10 km s-1 increments. The velocity field grey scale range is from 2800 to 3020 km s-1. The velocity width contours are 30, 40, 50 and 60 km s-1 and the velocity width grey scale is from 30 to 60 km s-1. |
| Open with DEXTER |
![\begin{figure}
\par\includegraphics[width=9cm,clip]{6005fig6.eps}\end{figure}](/articles/aa/full/2007/38/aa6005-06/Timg49.gif) |
Figure 6:
Position-velocity diagram derived from the robustly weighted (robustness parameter -4) data. The position-velocity diagram is averaged over a 0.8'' wide slit positioned as the rectangle in the upper panel. The contour levels in the position-velocity diagram start at 5 mJy beam-1 and increase with a factor of 1.2 per level. |
| Open with DEXTER |
![\begin{figure}
\par\includegraphics[width=9cm,clip]{6005fig7.eps}\end{figure}](/articles/aa/full/2007/38/aa6005-06/Timg50.gif) |
Figure 7:
MERLIN radio continuum at 1.4 GHz, uv-tapered (700 k)
and convolved with a 500 mas beam. The noise level is 0.35 mJy per beam, and the contour levels start at 0.7 mJy and increase with a factor of  per level. The gray scale range is from 0 to 5 mJy. The spectrum is averaged over the central 1'', indicated by the dashed circle.
 |
| Open with DEXTER |
![\begin{figure}
\par\includegraphics[width=9cm,clip]{6005fig8.eps}\end{figure}](/articles/aa/full/2007/38/aa6005-06/Timg51.gif) |
Figure 8:
MERLIN radio continuum derived from the robustly weighted data set. The levels start at 3 (0.17 mJy), and increase with a factor of
per level. The grey scale range is from 0 to 1 mJy.
(0.17 mJy), and increase with a factor of
per level. The grey scale range is from 0 to 1 mJy. |
| Open with DEXTER |
![\begin{figure}
\par\includegraphics[width=9cm,clip]{6005fig9.eps}\end{figure}](/articles/aa/full/2007/38/aa6005-06/Timg52.gif) |
Figure 9:
Onsala Space Observatory detection of HCN and HCO+ toward the center of NGC 5218. |
| Open with DEXTER |
To maximize sensitivity, the MERLIN data was first mapped using a 700 k
uv-taper and was convolved to a 0.5'' beam. The corresponding map, together with a spectrum, is shown in Fig. 7. In this map the continuum is extended east west along a bar-like structure 6'' long - comparable to the extent and position angle of the OVRO high resolution CO. The total flux density detected is 26 mJy, which agrees well with the VLA 5'' and 15'' flux densities measured by Condon et al. (1990) (27.2 and 26.2 mJy respectively).
To improve the angular resolution, an almost uniformly weighted (robustness parameter -4) map was derived and is shown in Fig. 8. The radio continuum is distributed over an area of 1''
0
 (190
95 pc), with a position angle of 90 degrees. The continuum is double peaked with a separation of
(190
95 pc), with a position angle of 90 degrees. The continuum is double peaked with a separation of
 (47 pc). The total flux density detected is 13.7 mJy and the maximum value in one beam (
)
is 1.2 mJy.
(47 pc). The total flux density detected is 13.7 mJy and the maximum value in one beam (
)
is 1.2 mJy.
Atomic hydrogen was searched for in absorption toward the MERLIN 1.4 GHz radio continuum peaks. The signal-to-noise ratio in the 700 k
uv-tapered data set was just enough for detectable absorption in some regions. A spectrum averaged over the central 1'' (R=95 pc) is shown in Fig. 7. The bandwidth per channel is 26
,
and the width of the absorption at half of its maximum depth is 180
.
In the robustly weighted data set, the signal-to-noise ratio did not allow any absorption spectra with better angular resolution as compared to the uv-tapered map.
The HCN molecule is, if it is collisionally excited, tracing gas of
densities

 and the CO/HCN 1-0 intensity ratio is therefore
often used as a measure of the dense molecular gas content in galaxies.
An Onsala 20-m spectrum of HCN and HCO+ 1-0 toward the center of
NGC 5218 is shown in Fig. 9. Assuming that the CO and HCN 1-0 emission is emerging from the same central gas structure, we assume a source size of 8''
13''(from the OVRO large scale CO map).
Thus, the total CO/HCN 1-0 intensity ratio is estimated to be 17 (from the
integrated intensities of CO and HCN, scaled with main beam filling factors and main beam efficiencies).
and the CO/HCN 1-0 intensity ratio is therefore
often used as a measure of the dense molecular gas content in galaxies.
An Onsala 20-m spectrum of HCN and HCO+ 1-0 toward the center of
NGC 5218 is shown in Fig. 9. Assuming that the CO and HCN 1-0 emission is emerging from the same central gas structure, we assume a source size of 8''
13''(from the OVRO large scale CO map).
Thus, the total CO/HCN 1-0 intensity ratio is estimated to be 17 (from the
integrated intensities of CO and HCN, scaled with main beam filling factors and main beam efficiencies).
However, even though the HCN emission is observed with a larger beam (44'')
than that of CO (33''), we note that its linewidth is narrower by more
than a factor of two than the central CO emission (which has
a line width of 225
).
From inspecting the pV diagram in Fig. 3, we propose that
the different linewidths
for the CO and HCN emissions indicate that the emission from
the two molecules have different radial distribution.
In fact, the velocity width of
the HCN line emission is even slightly smaller than the line width
of the suggested nuclear molecular ring.
Thus the CO/HCN line ratio will decrease with decreasing radius. We
estimate that 55% of the emission in the central CO single dish beam emerges from
the rotating torus (see Table 2) - and if indeed most of the HCN emission can be
associated with this feature then, the CO/HCN ratio here is about 8.
This is in good agreement with the ratio we obtain if we use only the peak
temperature intensity between the CO and HCN lines - instead of the
integrated intensities.
The HCO+ molecule is also a high density gas tracer and sensitive to
similar densities as HCN. However, its critical density is a factor of a
few lower than that of HCN due to the fact that the cross-section for ion-neutral
collisions are larger than for neutral-neutral collisions. The HCO+ emission
is fainter than HCN in terms of peak intensity by a factor of 2,
but the HCO+ line appears broader with a fitted line width of 220
-
similar to that of CO. However, the signal-to-noise does not permit deeper speculation about
the cause of this, and higher resolution and/or higher sensitivity observations are
required for confirmation. The global, integrated CO/HCO+ 1-0 ratio is close to 22 (assuming a
source size of 8'' 13'').
Table 2:
NGC 5218: observational results.
Figure 10 shows the OVRO low resolution CO integrated intensity contours overlayed on a K-band image. The large scale
OVRO structure is aligned with the inner 2 kpc IR bar - which in turn appears inside, and inclined to, a larger scale optical bar (which is visible in Fig. 1). Although the OVRO observations suffer from insensitivity to larger structures, we suggest that the molecular gas detected on radii outside of 2'' is moving on x2 orbits perpendicular (in the plane of the galaxy) to the larger scale optical bar. This is consistent with the notion that
bars are instrumental in funneling gas to the central regions in interacting galaxies
and we are likely seeing an example of this in NGC 5218. Further high resolution studies would be necessary to determine if this picture
is correct - and how the gas is transferred from these x2 orbits to the inner,
edge-on rotating molecular ring (see Sect. 4.2.1).
In the OVRO low resolution map we detect no gas at all outside of the central OSO beam (FWHM = 33''). However, with OSO (see Sect. 3.2) we have clear CO 1-0 detections in the 30'' offset positions to the east and west. We interpret this as that the gas in these offset positions detected by OSO may be in a different smooth diffuse phase, not detectable with OVRO at current resolution and sensitivity.
This can be tested by measuring the line ratio between 12CO 1-0 and 13CO 1-0. In the central OSO beam this ratio has been measured by Aalto et al. (1991) and was found to be 9. This is a typical value for CO in gravitationally bound molecular clouds where the 12CO line is typically optically thick and the 13CO is optically thin. In a diffuse gravitationally unbound state, both 12CO and 13CO would be optically thin, and the observed line ratio would be elevated. We will investigate if this is the case in the outer parts of NGC 5218 by observing the 30'' offset positions in 13CO with the Onsala 20-m telescope during the spring of 2007.
An example of a galaxy with diffuse molecular gas in its bar is
NGC 7479 (Hüttemeister et al. 2000), where the 13CO emission in the bar generally
is faint compared to the 12CO emission.
![\begin{figure}
\par\includegraphics[width=8.1cm,clip]{6005fig10.eps}\end{figure}](/articles/aa/full/2007/38/aa6005-06/Timg63.gif) |
Figure 10:
Low resolution CO integrated intensity contours overlayed on a 2MASS K-band image. The OVRO primary beam diameter is 60'', which is outside of this image (33'' 46''). |
| Open with DEXTER |
![\begin{figure}
\par\includegraphics[width=9cm,clip]{6005fig11.eps}\end{figure}](/articles/aa/full/2007/38/aa6005-06/Timg64.gif) |
Figure 11:
The upper panel shows the CO integrated intensity of the OVRO robust -4 weighted data in contours. The greyscale is the robust -4 weighted MERLIN radio continuum at 1.4 GHz. The middle panel is the position velocity diagram of the OVRO data. The dashed box marks the components associated with the rotating molecular ring. The arrows point at additional kinematical components not associated with the ring. The dashed circle marks the possible extent of an expanding shell of molecular gas. The lower panel shows the naturally weighted MERLIN radio continuum at 1.4 GHz in greyscale. The contours are the H I-absorption toward the background continuum at two different velocities, centered at 2862
(white contour) and 2889
(black contour). The contour level is -1 mJy. |
| Open with DEXTER |
4.2.1 A nuclear ring
The upper panel in Fig. 11 shows the OVRO integrated intensity map in contours. We interpret the double CO peak as an inclined almost edge-on rotating ring of molecular gas. The dynamical components associated with the ring are contained within the dashed box in the middle panel of Fig. 11, which shows that the eastern and western peaks associated with the ring occur at velocities of 2835 and 2990
respectively. However, the intensity peaks occur at the maximum pathlength through the ring along our line of sight, and do thereby not directly give the mid-radius and rotational velocity of the ring. To calculate the total dynamical mass enclosed by the ring, the
maximum velocity and distance where molecular gas appears to be
associated with the ring (each end of the dashed box in Fig. 11)
should be used instead, i.e. a radius of 2.5'' (470 pc) with respect to the kinematical center and velocities from 2770 to 3050
.
The resulting rotational velocity of the ring of 140
at a radius of 470 pc was used to calculate a dynamical mass using the Keplerian relation
where
 is in
and R in pc. This resulted in a dynamical mass of 2.0
,
which has to be taken as an estimate since we can not rule out the presence of non-Keplerian orbits. The molecular mass in the same region was estimated using a standard CO flux to molecular mass conversion factor and was found to be 7
i.e. one third of the dynamical mass.
is in
and R in pc. This resulted in a dynamical mass of 2.0
,
which has to be taken as an estimate since we can not rule out the presence of non-Keplerian orbits. The molecular mass in the same region was estimated using a standard CO flux to molecular mass conversion factor and was found to be 7
i.e. one third of the dynamical mass.
4.2.2 An expanding gas-shell - the molecular gas
The main rotation of the molecular ring is enclosed with dashed lines in the position velocity diagram (Fig. 11). The arrows point at intensity peaks of molecular gas at velocities not corresponding to the rotation of the ring. These peaks occur only on the eastern side of the center, and are all blue shifted with respect to the main rotation of the ring. We interpret these additional features as an outflow or expanding shell of molecular gas, originating from the inner egde of the rotating ring. We suggest that the expanding shell of gas may be driven by a population of young supernova remnants pushing on the gas. Similar position velocity diagrams were seen in M 82 by Weiss et al. (1999) and Wills et al. (2002). Although their linear resolution is better, the same expansion features are visible in our position diagram as in their case. It also does occur asymmetrically in both cases, i.e. only on the eastern side of the dynamical center. We estimate that 10% of the flux in the position velocity diagram is associated with the expansion. This corresponds to a molecular mass of 7
.
From the position velocity diagram we estimated an expansion velocity of 30
and a radius of 150 pc of the expanding shell. We have used these values to calculate a kinematical age of the shell to 5
106 years. This age is to be taken as an upper limit since the shell is probably decelarating. We used Chevalier's equation,
(Chevalier 1974) in order to calculate the energy required to drive the expansion of the shell. Chevalier's equation applies to H I, hence we multiplied the result with a factor of two to compensate for the double mass of the H2 molecule as compared to H I. We assumed that the molecular mass of 7
was distributed evenly in a disk with a radius of 470 pc and a thickness of 200 pc prior to the expansion, and calculated a corresponding initial H2 density, n0, before the expansion of the shell of 100 cm-3. The other inputs to the Chevalier equation were the expansion velocity of 30
and the radius of the shell of 150 pc. The units are n0 in cm-3,
 in
and R in pc.
The resulting total energy derived from the Chevalier equation is 1.3
1055 erg. This corresponds to an energy equivalent of 10 000 type II supernovae, which yields a supernova rate as calculated over the kinematical age of 0.002 supernovae per year.
in
and R in pc.
The resulting total energy derived from the Chevalier equation is 1.3
1055 erg. This corresponds to an energy equivalent of 10 000 type II supernovae, which yields a supernova rate as calculated over the kinematical age of 0.002 supernovae per year.
In Fig. 11 the radio continuum is overlayed on the high resolution CO contours (upper panel). All of the radio continuum detected is on the eastern side of the dynamical center. The peak value occurs on the inner side of the eastern CO peak, and thus coincides with the signatures of an additional kinematical component in the position velocity diagram (the peaks at 2930, 2890 and 2865
in the middle panel, discussed in Sect. 4.2.2).
The lower panel shows the channels with the strongest H I-absorption, overlayed on the uv-tapered radio continuum map. The white contour is the channel centered at 2862
,
and the black contour is the channel centered at 2889
.
The contour level is -1 mJy. Both the absorption at 2862
and 2889
(marked with arrows) line up in space and velocity with the features associated with the expanding shell in the position velocity diagram (middle panel, also marked with arrows), and hence strengthen our hypothesis of an expanding shell.
The component at 2930
in the position velocity diagram does not have a corresponding H I-absorption. This indicates that the 2930
component of the expansion is located behind (or at least not directly in front of) the continuum.
The robustly weighted MERLIN 1.4 GHz radio continuum is overlayed on the OVRO CO contours in Fig. 11, upper panel. In the middle panel, the position velocity diagram of the CO data is given. The radio continuum spatially coincides with the eastern features in the position velocity diagram marked with arrows in Fig. 11. The peak of the radio continuum is 1.2 mJy in a
beam, which we converted to a source temperature of 36 000 K. We conclude that the radio continuum at this scale is consistent with the scenario of an off-center cluster of young supernova remnants, SNRs, which also causes the expanding shell of molecular gas discussed in the sections above. An unresolved, off-center high brightness radio core can not be ruled out at current resolution, but we consider such a scenario unlikely. Follow up EVN-observations to resolve this issue is under way.
The total flux density in the robustly weighted map is 13.7 mJy, i.e. 50% of the 27 mJy detected with the VLA 5'' and 15'' by Condon et al. (1990). We recover almost all of that flux density (26 mJy) in our uv-tapered radio continuum map (Fig. 7 and lower panel, Fig. 11). Hence we conclude that all of the radio continuum inside a diameter of 15'' originates in the east to west elongated continuum structure in these figures. As can be seen in Fig. 11, the dimensions and position angle of the continuum structure agree well with the dimensions of the rotating ring of molecular gas (upper panel). The continuum flux density missing in the high resolution map, but detected in the low resolution map may originate from a population of older, more evenly distributed supernova remnants in the molecular ring.
We see no evidence of a high brightness radio core close to the dynamical center in neither of the continuum maps, hence the notion of AGN-driven activity is not supported by our current continuum data. Furthermore, we see no dynamical signs of a compact nuclear disc (CND) in the position velocity diagram (Fig. 11). For example, a CND rotating in the same plane as the molecular ring, with a radius of 50 pc and an enclosed mass of 5
would rotate with a speed exceeding 200
and would, even spatially unresolved, be evident in the position velocity diagram.
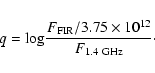
The q parameter (Helou et al. 1985) is a measure of the logarithmic ratio between FIR flux and radio flux density, and can be used to determine if there is any excess radio continuum or FIR component. We have calculated q as:
The radio flux density is in units of
 and the FIR flux in
 .
The FIR flux was calculated from the IRAS flux densities at 60
.
The FIR flux was calculated from the IRAS flux densities at 60  m and 100 m with the formula:
Using this FIR flux and the MERLIN radio flux density of 26 mJy, we calculated a q-value of 2.6, which is in good agreement with the average value of q = 2.3 derived for disk galaxies by Helou et al. (1985). This confirms that there is no large radio continuum or FIR excess in this galaxy. Hence the global FIR is mostly related to the radio continuum, which is detected in the inner few arc seconds, inside the molecular ring. The current star formation therefore occurs mostly in the molecular ring, and not at larger radii.
Alonso-Herrero et al. (2000) claim that LINER-like optical spectra would be the consequence of the shock-heating by supernovae of the surrounding gas after a burst of star formation. This would typically occur 10-15 Myr after the onset of the starburst. NGC 5218 may be an example of this scenario, where the expanding shell detected in the eastern end of the molecular ring is the result of a previous burst of star formation. The shock fronts of the shell would shock heat the surrounding gas, giving rise to the LINER spectrum. The time scales of the expansion, as calculated in Sect. 4.2.2 are also consistent with the time scales in the Alonso-Herrero et al. (2000) scenario. We therefore conclude that the LINER like optical spectrum seen in NGC 5218 is probably caused by a burst of star formation, and not by an AGN.
The flux density of the high resolution MERLIN-map, which roughly corresponds to the outflow region, is 13.7 mJy, corresponding to a star formation rate of 2-3 solar masses per year (using SFR =
0.14 D2 F1.4, where D is in Mpc and F is the flux density at 1.4 GHz in Jy). For a standard Salpeter initial mass function, IMF, 200
of stars formed will result in one supernova. Hence the observed SFR of 2-3 solar masses per year would result in 0.01 supernovae per year. This number is a factor of 5 larger than the supernova rate calculated in Sect. 4.2.2. Possible reasons are that the kinematical age used to calculate the supernova rate was over-estimated, due to deceleration of the expanding shell, or that the burst of star formation is currently in a more intense phase as compared to the average intensity over the kinematical age, or that not all the SN energy goes into kinetic energy of the molecular shell, or most likely, a combination of these reasons.
From the narrow line width of the single-dish HCN 1-0 line, we propose
that it must be emerging from the very inner region - the central
500 pc. Since the HCN 1-0 line requires densitites in excess of n >
104
to become excited, it seems like the dense gas is even more concentrated toward the
center than CO - even though the gas surface density indicated by the CO
emission is already quite large. A global CO/HCN luminosity ratio of 17 is actually
quite low for
a galaxy of such moderate luminosity. The luminous starburst galaxy
NGC 4194 (the Medusa merger)
for instance, has a CO/HCN ratio twice the value found for NGC 5218, but is forming stars
at a substantial rate and with a high star forming efficiency (SFE).
One can use the simultaneous single-dish observation of HCN and HCO+ to address the issue of the
nature of the nuclear activity of NGC 5218. The HCN/HCO+ 1-0 line ratio
is suggested by Kohno et al. (2001) to be a tracer of
what fraction of the dense gas is involved in AGN activity.
They suggest that the HCO+ 1-0 line emission is suppressed relative
to HCN 1-0 and that this can be attributed to selective destruction of
HCO+ near an X-ray source (an XDR - X-ray Dominated Region), while the HCN
abundance instead becomes enhanced. They suggest that HCN/HCO+ 1-0 line ratios
exceeding 1.5 - combined with low CO/HCN 1-0 line ratios of 2-5 - imply the presence
of an AGN. For NGC 5218, the peak-intensity ratio of 1.8 may then suggest the
presence of an AGN - while the CO/HCN ratio does not. The latter could be explained
with a dilution effect - that CO is sensitive to more extended emission not
associated with the AGN. Thus, in the context of the model suggested by Kohno et al. (2001), the HCN/HCO+ 1-0 line ratio of NGC 5218 could be seen as contradicting our conclusion that NGC 5218
is starburst driven rather than AGN driven.
Recent work by Meijerink et al. (2006), however, disagree
with the Kohno interpretation
of the HCN/HCO+ 1-0 line ratio. Instead of HCO+ being
underabundant near an X-ray source, they find that HCO+ has quite a steady, high
abundance for a large range of ionization rates. HCO+ does become destroyed
at the very edge of the XDR, but the global effect on the XDR should be quite small. Also in the
often cited Lepp & Dalgarno work (1996) it is evident that the HCO+ abundances remain high for most of the range of ionization rates.
We therefore hesitate to use the HCN/HCO+ 1-0 line ratio of NGC 5218 as an
indicator of AGN activity since
the theoretical interpretation of this ratio is under debate. Meijerink et al. (2006)
show that a low-ionization PDR, (Photon Dominated Region) where no
supernovae has gone off, has an
HCN/HCO+ abundance ratio >1. Thus, the result for NGC 5218 may instead suggest that the dense
gas in the torus is in an early pre-supernova stage. Since the
supernovae detected in the radio continuum observations are mainly found inside of the torus,
this may be a possible interpretation for NGC 5218.
- 1.
- We have detected a double peak of molecular gas toward the center of the LINER galaxy NGC 5218. The integrated intensity peaks are separated by 2''. We suggest that the observed peaks are caused by an almost edge-on ring of molecular gas with a radius of 470 pc and a rotational velocity of 140
.
The dynamical mass enclosed by the ring is 2.0
,
a factor of three more than the observed molecular mass within the same region.
- 2.
- On the inner edge of the molecular ring, to the east of the dynamical center, there is an expanding shell of molecular gas. The mass of the gas involved in the expansion is 7
,
and we suggest that the expansion is driven by a burst of supernovae that took place some 5
106 years ago. The current expansion velocity and radius was used to estimate that 10 000 supernovae were required to drive the expansion and that the corresponding number of supernovae per year was 0.002 over the age of the expanding shell.
- 3.
- We have 1.4 GHz radio continuum observations from MERLIN indicating a population of supernovae in the same region as the expanding molecular gas shell. The current supernova rate as calculated from the radio continuum flux density is in the same order as in the calculation above. A spatially larger radio continuum component with lower brightness temperature was detected and aligns well with the ring of molecular gas in 1. We suggest that this component is due to an older population of supernovae more spread in the molecular ring.
- 4.
- We see no evidence of a high brightness radio core close to the dynamical center in neither of our continuum maps, hence the notion of AGN-driven activity is not supported by our current continuum data.
- 5.
- H I-absorption in front of our continuum detections agree well in space and velocity with the signatures of the expanding shell detected in CO.
- 6.
- The q-factor as calculated between global FIR and radio flux density is 2.6, indicating no large FIR or radio excess. We conclude that the radio flux density and the bulk of the FIR is associated with nuclear star formation in the central R=2'' (380 pc).
- 7.
- The shock fronts of the expanding shell may shock heat the surrounding gas, and give rise to a LINER like spectrum. We conclude that the LINER activity observed in NGC 5218 is probably due to nuclear starburst activity, and not to AGN-activity.
- 8.
- A fraction of the molecular gas in the bar, outside of the central region, appears to be in a different, gravitationally unbound phase, possibly on x2 orbits to the large scale optical bar.
Acknowledgements
This research made use of the NASA/IPAC Extragalactic Database
(NED) which is operated by the Jet Propulsion Laboratory, California
Institute of Technology, under contract with the National Aeronautics and
Space Administration. Parts of this work was supported by the EU Marie Curie Training Site programme
under contract No. HPMT-CT-2000-00069 (JTRA). We would like to thank an anonymous referee for helpful comments on our manuscript.
- Aalto, S., Black, J.
H., Johansson, L. E. B., & Booth, R. S. 1991, A&A, 249,
323 [NASA ADS] (In the text)
- Aalto, S., Booth, R.
S., Black, J. H., & Johansson, L. E. B. 1995, A&A, 300,
369 [NASA ADS]
- Alonso-Herrero, A.,
Rieke, M. J., & Rieke, G. H. 2000, ApJ, 530, 688 [NASA ADS] [CrossRef] (In the text)
- Arimoto, N., Sofue, Y.,
& Tsujimoto, T. 1996, PASJ, 48, 275 [NASA ADS]
- Byrd, G. G., Valtonen,
M. J., Valtaoja, L., & Sundelius, B. 1986, A&A, 166,
75 [NASA ADS] (In the text)
- Chevalier, R. A. 1974,
ApJ, 188, 501 [NASA ADS] [CrossRef] (In the text)
- Condon, J. J., Helou,
G., Sanders, D. B., & Soifer, B. T. 1990, ApJS, 73, 359 [NASA ADS] [CrossRef] (In the text)
- Cullen, H., Alexander,
P., & Clemens, M. 2003, Ap&SS, 284, 503 [NASA ADS] [CrossRef] (In the text)
- Haynes, M. P., &
Giovanelli, R. 1991, ApJS, 77, 331 [NASA ADS] [CrossRef]
- Helou, G., Soifer, B.
T., & Rowan-Robinson, M. 1985, ApJ, 298, L7 [NASA ADS] [CrossRef] (In the text)
- Hubble, E. 1926, ApJ,
64, 321 [NASA ADS] [CrossRef]
- Hüttemeister, S.,
Aalto, S., Das, M., & Wall, W. F. 2000, A&A, 363, 93 [NASA ADS] (In the text)
- Kohno, K., Matsushita,
S., Vila-Vilaro, B., et al. 2001, in The Central Kiloparsec of
Starbursts and AGN: The La Palma Connection, ed. J. H. Knapen, J.
E. Beckman, I. Shlosman, & T. J. Mahoney, ASP Conf. Proc.,
249
(In the text)
- Lepp, S., &
Dalgarno, A. 1996, A&A, 306, 21 [NASA ADS] (In the text)
- Meijerink, R., Spaans,
M., & Israel, F. P. 2006, ApJL, in press
[arXiv:astro-ph/0609184]
(In the text)
- Planesas, P., Colina,
L., & P'erez-Olea, D. 1997, A&A, 325, 81 [NASA ADS]
- Sakamoto, K., Okumura,
S. K., Ishizuki, S., & Scoville, N. Z. 1999, ApJ, 525, 691 [NASA ADS] [CrossRef]
- Scoville, N., &
Young, J. S. 1983, ApJ, 265, 148 [NASA ADS] [CrossRef]
- Theureau, G.,
Bottinelli, L., Coudreau-Durand, N., et al. 1998, A&AS, 130,
333 [NASA ADS] [CrossRef] [EDP Sciences]
- Veilleux, S., Kim,
D.-C., Sanders, D. B., Mazzarella, J. M., & Soifer, B. T. 1995,
ApJS, 98, 171 [NASA ADS] [CrossRef] (In the text)
- Weiss, A., Walter, F.,
Neininger, N., & Klein, U. 1999, A&A, 345, 23 [NASA ADS] (In the text)
- Wills, K. A., Pedlar,
A., & Muxlow, T. W. B. 2002, MNRAS, 331, 313 [NASA ADS] (In the text)
- Young, J. S., Xie, S.,
Kenney, J. D. P., & Rice, W. L. 1989, ApJS, 70, 699 [NASA ADS] [CrossRef]
Copyright ESO 2007
![\begin{figure}
\par\includegraphics[width=5.5cm,clip]{6005fig1.eps} \end{figure}](/articles/aa/full/2007/38/aa6005-06/img14.gif)
![\begin{figure}
\par\includegraphics[width=9cm,clip]{6005fig2.eps}\end{figure}](/articles/aa/full/2007/38/aa6005-06/img25.gif)
![\begin{figure}
\par\includegraphics[width=9cm,clip]{6005fig3.eps}\end{figure}](/articles/aa/full/2007/38/aa6005-06/img40.gif)
![\begin{figure}
\par\includegraphics[width=9cm,clip]{6005fig4.eps}\end{figure}](/articles/aa/full/2007/38/aa6005-06/img41.gif)
![\begin{eqnarray*}S/T ~ ~ ~ [{\rm Jy/K}] = {{2k\over \lambda^2} \pi {d^2\over
4}}\times 10^{26}
\end{eqnarray*}](/articles/aa/full/2007/38/aa6005-06/img43.gif)
![\begin{figure}
\par\includegraphics[width=9cm,clip]{6005fig5.eps}\end{figure}](/articles/aa/full/2007/38/aa6005-06/img48.gif)
![\begin{figure}
\par\includegraphics[width=9cm,clip]{6005fig6.eps}\end{figure}](/articles/aa/full/2007/38/aa6005-06/img49.gif)
![\begin{figure}
\par\includegraphics[width=9cm,clip]{6005fig7.eps}\end{figure}](/articles/aa/full/2007/38/aa6005-06/img50.gif)
![\begin{figure}
\par\includegraphics[width=9cm,clip]{6005fig8.eps}\end{figure}](/articles/aa/full/2007/38/aa6005-06/img51.gif)
![\begin{figure}
\par\includegraphics[width=9cm,clip]{6005fig9.eps}\end{figure}](/articles/aa/full/2007/38/aa6005-06/img52.gif)
![\begin{figure}
\par\includegraphics[width=8.1cm,clip]{6005fig10.eps}\end{figure}](/articles/aa/full/2007/38/aa6005-06/img63.gif)
![\begin{figure}
\par\includegraphics[width=9cm,clip]{6005fig11.eps}\end{figure}](/articles/aa/full/2007/38/aa6005-06/img64.gif)