A&A 472, 805-822 (2007)
DOI: 10.1051/0004-6361:20077598
A. M. S. Richards1 - T. W. B. Muxlow1 - R. Beswick1 - M. G. Allen2 - K. Benson3 - R. C. Dickson1 - M. A. Garrett4 - S. T. Garrington1 - E. Gonzalez-Solarez5 - P. A. Harrison6 - A. J. Holloway1 - M. M. Kettenis7 - R. A. Laing6 - E. A. Richards8 - H. Thrall1 - H. J. van Langevelde7,9 - N. A. Walton5 - P. N. Wilkinson1 - N. Winstanley1
1 - Jodrell Bank Observatory, University of Manchester,
SK11 9DL, Macclesfield, UK
2 - Centre de Données astronomiques de Strasbourg (UMR
7550), 67000 Strasbourg, France
3 - Mullard Space Science Laboratory, UCL, Holmbury St. Mary, Dorking, Surrey, RH5 6NT, UK
4 - Netherlands Foundation for Research in Astronomy, Postbus 2, 7990 AA Dwingeloo, The Netherlands
5 - Institute of Astronomy, Madingley Road, Cambridge, CB3 0HA, UK
6 - European Southern Observatory, 85748 Garching bei München, Germany
7 - Joint Institute for VLBI in Europe, Postbus 2, 7990 AA Dwingeloo, The Netherlands
8 - Department of Physics, Talledega College, Talledega, Alabama 35160, USA
9 - Sterrewacht Leiden, Leiden University, Postbus 9513, 2300 RA Leiden, The Netherlands
Received 3 April 2007 / Accepted 21 June 2007
Abstract
Context. A 10-arcmin region around the Hubble Deep Field (North) contains 92 radio sources brighter than 40 ![]() Jy which are well-resolved by MERLIN+VLA at 0
Jy which are well-resolved by MERLIN+VLA at 0
![]() 2-2
2-2
![]() resolution (average size
resolution (average size ![]() 1
1
![]() ). 55 of these have Chandra X-ray counterparts in the 2-Ms CDF(N) field including at least 17 with a hard X-ray photon index and high luminosity characteristic of a type-II (obscured) AGN. More than 70% of the radio sources have been classified as starbursts or AGN using radio morphologies, spectral indices and comparisons with optical appearance and rest-frame MIR emission. On this basis, starbursts outnumber radio AGN 3:1.
). 55 of these have Chandra X-ray counterparts in the 2-Ms CDF(N) field including at least 17 with a hard X-ray photon index and high luminosity characteristic of a type-II (obscured) AGN. More than 70% of the radio sources have been classified as starbursts or AGN using radio morphologies, spectral indices and comparisons with optical appearance and rest-frame MIR emission. On this basis, starbursts outnumber radio AGN 3:1.
Aims. We investigate the possibility that very luminous radio and X-ray emission originates from different phenomena in the same high-redshift galaxies.
Methods. This study extends the Virtual Observatory (VO) methods previously used to identify X-ray-selected obscured type-II AGN, to examine the relationship between radio and X-ray emission. We describe a VO cut-out server for MERLIN+VLA 1.4-GHz radio images in the HDF(N) region.
Results. The high-redshift starbursts have typical sizes of 5-10 kpc and star formation rates of ![]()
![]() yr-1, an order of magnitude more extended and intense than in the local universe. There is no obvious correlation between radio and X-ray luminosities nor spectral indices at
yr-1, an order of magnitude more extended and intense than in the local universe. There is no obvious correlation between radio and X-ray luminosities nor spectral indices at ![]() .
About 70% of both the radio-selected AGN and the starburst samples were detected by Chandra. The X-ray luminosity indicates the presence of an AGN in at least half of the 45 cross-matched radio starbursts. Eleven of these are type-II AGN, of which 7 are at
.
About 70% of both the radio-selected AGN and the starburst samples were detected by Chandra. The X-ray luminosity indicates the presence of an AGN in at least half of the 45 cross-matched radio starbursts. Eleven of these are type-II AGN, of which 7 are at ![]() .
This distribution overlaps closely with the X-ray detected radio sources which were also detected by SCUBA. In contrast, all but one of the AGN-dominated radio sources are at z<1.5, including the 4 which are also X-ray selected type-II AGN. The stacked 1.4-GHz emission at the positions of radio-faint X-ray sources is correlated with X-ray hardness.
.
This distribution overlaps closely with the X-ray detected radio sources which were also detected by SCUBA. In contrast, all but one of the AGN-dominated radio sources are at z<1.5, including the 4 which are also X-ray selected type-II AGN. The stacked 1.4-GHz emission at the positions of radio-faint X-ray sources is correlated with X-ray hardness.
Conclusions. Almost all extended radio starbursts at z>1.3 host X-ray selected obscured AGN. The radio emission from most of these ultra-luminous objects is dominated by star formation although the highest redshift (z=4.424) source has a substantial AGN contribution. Star-formation appears to contribute less than 1/3 of their X-ray luminosity. Our results support the inferences from SCUBA and IR data, that at ![]() ,
star formation is observably more extended and more copious, it is closely linked to AGN activity and it is triggered differently, compared with star formation at lower redshifts.
,
star formation is observably more extended and more copious, it is closely linked to AGN activity and it is triggered differently, compared with star formation at lower redshifts.
Key words: astronomical data bases: miscellaneous - X-rays: galaxies - radio continuum: galaxies - galaxies: active - galaxies: starburst - galaxies: evolution
There is now general agreement that the number of vigorous star-forming galaxies, and the star formation rate (SFR) within these galaxies, increases dramatically at z > 1. The details of how these starburst galaxies relate to the high redshift Active Galactic Nucleus (AGN) population are less clear. Objects detected individually at z>1 in radio and X-rays, by even the deepest available exposures, are inevitably abnormally luminous. Is it equally inevitable that, in a galaxy detected in both regimes, all such bright emission emanates from the same phenomenon, or can we separate contributions from AGN and from starbursts if these coexist?
The unprecedentedly sensitive observations of the Hubble Deep Field
(North) (HDF(N)![]() ) which commenced in 1996 provided the
first detailed attempts to quantify the star formation history of the
universe (Madau et al. 1996). The radio luminosity function evolves
rapidly with redshift, as (1+z)3 for 0.5<z<1.5 (Cowie et al. 2004a).
Subsamples classified using optical spectra and X-ray power suggest
that the AGN luminosity function is declining at z>0.9 compared to
lower redshifts, while the reverse is the case for star-forming
galaxies. This is supported by Spitzer detections of
Ultra-Luminous IR Galaxies (ULIRGs) with IR luminosities >
) which commenced in 1996 provided the
first detailed attempts to quantify the star formation history of the
universe (Madau et al. 1996). The radio luminosity function evolves
rapidly with redshift, as (1+z)3 for 0.5<z<1.5 (Cowie et al. 2004a).
Subsamples classified using optical spectra and X-ray power suggest
that the AGN luminosity function is declining at z>0.9 compared to
lower redshifts, while the reverse is the case for star-forming
galaxies. This is supported by Spitzer detections of
Ultra-Luminous IR Galaxies (ULIRGs) with IR luminosities >
![]() .
These show that the co-moving density of ULIRGs (with a
typical SFR of 200-300
.
These show that the co-moving density of ULIRGs (with a
typical SFR of 200-300 ![]() yr-1) at
yr-1) at ![]() was at
least 3 orders of magnitude greater than in the local universe
(Daddi et al. 2005).
was at
least 3 orders of magnitude greater than in the local universe
(Daddi et al. 2005).
Star-formation rates (SFR) measured from optical data only can be greatly
underestimated or overlooked altogether (Reddy & Steidel 2004). For example,
Cowie et al. (2004a), using optical spectra, were only able to classify
53% of the radio sources <100 ![]() Jy in the HDF(N), finding
that 28% are star forming galaxies.
In contrast, over 2/3 of the 58 resolved sources <100
Jy in the HDF(N), finding
that 28% are star forming galaxies.
In contrast, over 2/3 of the 58 resolved sources <100 ![]() Jy in the HDF(N) were classified using the radio-based criteria of Muxlow et al. (2005), containing 60% starbursts.
Similarly, up to 90% of the distant or obscured AGN revealed by deep
X-ray observations may be missed by optical surveys (Bauer et al. 2004).
Jy in the HDF(N) were classified using the radio-based criteria of Muxlow et al. (2005), containing 60% starbursts.
Similarly, up to 90% of the distant or obscured AGN revealed by deep
X-ray observations may be missed by optical surveys (Bauer et al. 2004).
Classification based on IR, sub-mm and radio properties is favoured
because local starburst galaxies show a strong peak in their spectral
energy distributions (SED) around 3 THz (100 ![]() m)
(e.g. Yun & Carilli 2002) which can be used to estimate the SFR
(Yun et al. 2001; Condon 1992; Cram et al. 1998). The most striking evidence for
extraordinary levels of high-redshift star formation came from Sub-mm
Common User Bolometer Array (SCUBA) observations (Hughes et al. 1998;
Smail et al. 2002; review by Blain et al. 2002). The median redshift
for SCUBA sources (SMG) in the HDF(N) with optical counterparts is at
least 2. SMG have a typical SFR of
1000-2000
m)
(e.g. Yun & Carilli 2002) which can be used to estimate the SFR
(Yun et al. 2001; Condon 1992; Cram et al. 1998). The most striking evidence for
extraordinary levels of high-redshift star formation came from Sub-mm
Common User Bolometer Array (SCUBA) observations (Hughes et al. 1998;
Smail et al. 2002; review by Blain et al. 2002). The median redshift
for SCUBA sources (SMG) in the HDF(N) with optical counterparts is at
least 2. SMG have a typical SFR of
1000-2000 ![]() yr-1, an order of magnitude greater than
in the most active local ULIRGs such as
Arp 220 (SFR 50-150
yr-1, an order of magnitude greater than
in the most active local ULIRGs such as
Arp 220 (SFR 50-150 ![]() yr-1).
The FIR intensity is well-correlated with radio emission (on scales
greater than a few tens of pc) (Yun et al. 2001; Condon 1992). Elbaz et al. (2002), Garrett (2002) and Chapman et al. (2005) have shown that the relationship is valid out to at least
yr-1).
The FIR intensity is well-correlated with radio emission (on scales
greater than a few tens of pc) (Yun et al. 2001; Condon 1992). Elbaz et al. (2002), Garrett (2002) and Chapman et al. (2005) have shown that the relationship is valid out to at least ![]() .
.
Star formation dominates the rest-frame MIR and FIR output even if an AGN is
present (Downes & Solomon 1998; Frayer et al. 1998)
as emission due to dust heating by AGN declines steeply
from the NIR to the FIR (e.g. Markarian 231, Soifer et al. 2000). The
observed ratio of X-ray to rest frame FIR luminosity is ![]() 10% in
local active galaxies even when a strong AGN is present and lower
still at high redshifts, especially for starburst-dominated sources
(Alexander et al. 2005a,2003a).
10% in
local active galaxies even when a strong AGN is present and lower
still at high redshifts, especially for starburst-dominated sources
(Alexander et al. 2005a,2003a).
Almost half of the optical spectra available for 2-Ms X-ray sources in
the HDF(N) indicate the presence of star formation in the same galaxy
(Barger et al. 2005; Sadler et al. 2002). There is evidence that radio and
X-ray emission has a common origin in starforming galaxies at
relatively low redshifts (Alexander et al. 2002).
Bauer et al. (2002b) derive a relationship between radio and
X-ray luminosities for 102 emission-line galaxies at ![]() (of
which only 2 sources at z>1 were detected in both
radio and X-rays in the data then available):
(of
which only 2 sources at z>1 were detected in both
radio and X-rays in the data then available):
In this paper, we investigate whether the relationship holds at high redshift using classifications independent of optical detections and we explore the properties of radio counterparts to the obscured AGN (type-II AGN) identified from their hard X-ray photon indices and high X-ray luminosities by Padovani et al. (2004).
Many investigations of high-redshift star formation deliberately
exclude AGN hosts. We do not need to do this because we use
sub-arcsec resolution to distinguish between different energy
sources in the same galaxy, which may correspond to different
classifications in different wavelength regimes.
The whole field has only been well-resolved by the HST and by
MERLIN+VLA at 1.4 GHz. The extent of radio emission from high-redshift
galaxies in the HDF(N) is typically 1
![]() -2
-2
![]() .
.
We present the first detailed comparision between the highest
sensitivity MERLIN+VLA and Chandra data ever taken and the
HST ACS images. The data used in this paper are described in
more detail in Sect. 2, followed by a summary of the
Virtual Observatory and RadioNet![]() software which has made these results
possible, in Sect. 3.1. In Sects. 4
and 5 we explain how we derive the radio and X-ray
luminosities
software which has made these results
possible, in Sect. 3.1. In Sects. 4
and 5 we explain how we derive the radio and X-ray
luminosities![]() and deduce the origins of the emission,
based primarily radio data for the radio
sources and X-ray data for X-ray sources. Their relationships are
explored in Sect. 6 and we present evidence for the
presence of embedded type-II AGN in radio starbursts in
Sect. 7. We demonstrate statistically the presence of
faint radio emission associated with the majority of X-ray sources in
Sect. 8 and summarise our conclusions in
Sect. 9.
and deduce the origins of the emission,
based primarily radio data for the radio
sources and X-ray data for X-ray sources. Their relationships are
explored in Sect. 6 and we present evidence for the
presence of embedded type-II AGN in radio starbursts in
Sect. 7. We demonstrate statistically the presence of
faint radio emission associated with the majority of X-ray sources in
Sect. 8 and summarise our conclusions in
Sect. 9.
In this section we introduce the radio observations and describe briefly the X-ray and other data and tools used to make comparisons. The positions, flux densities and spectral and photon indices of radio sources with X-ray counterparts are listed in Table 1, along with their redshifts and any IR or sub-mm detections. All positions given in this paper have been aligned with the VLA or MERLIN+VLA data as these provide the most accurate reference frame, aligned with the International Celestial Reference Frame (ICRF) to better than 15 milli-arcsec (mas) (Muxlow et al. 2005).
Muxlow et al. (2005), Richards (2000) and Richards et al. (1998) describe
the MERLIN and VLA observations of the HDF(N) made in 1996-7. The
VLA-only 1.4-GHz image contains 92 sources above its completeness
limit of 40 ![]() Jy per 2
Jy per 2
![]() beam (
beam (![]()
![]() )
in a box of
side 10
)
in a box of
side 10![]() (the 10-arcmin field), the "radio-bright'' sample.
The MERLIN field was centred on Right
Ascension 12
(the 10-arcmin field), the "radio-bright'' sample.
The MERLIN field was centred on Right
Ascension 12
![]() 36
36
![]() 49
49
![]() 4000,
Declination +62$^$12
4000,
Declination +62$^$12![]() 58
58
![]() 000 (J2000), hereafter taken
as the reference position.
000 (J2000), hereafter taken
as the reference position.
The combined MERLIN+VLA 1.4 GHz data reach an rms noise level of
![]()
![]() Jy at
Jy at ![]() 5
5![]() from the pointing centre,
twice the sensitivity of the VLA-only data. Both arrays observed in
wide-field mode, using short integration times and multiple narrow
frequency channels across the bandpass in order to ensure that
time-averaging and chromatic aberrations were less significant than
the fundamental limitations of the primary beams. This is described
in detail by Richards (2000, his Sect. 3.2 and Fig. 3) and
Muxlow et al. (2005, their Sect. 2). Computational limitations meant
that the calibrated MERLIN and VLA data were separately Fourier
transformed into multiple small dirty maps covering the region to be
imaged; each pair was then combined and CLEANed. Tests showed
that, for an image with the same weighting and CLEANing, there
was no appreciable difference between this method and data
combination in the visibility plane (Muxlow et al. 2005, their Fig. 1). The final combined images show
from the pointing centre,
twice the sensitivity of the VLA-only data. Both arrays observed in
wide-field mode, using short integration times and multiple narrow
frequency channels across the bandpass in order to ensure that
time-averaging and chromatic aberrations were less significant than
the fundamental limitations of the primary beams. This is described
in detail by Richards (2000, his Sect. 3.2 and Fig. 3) and
Muxlow et al. (2005, their Sect. 2). Computational limitations meant
that the calibrated MERLIN and VLA data were separately Fourier
transformed into multiple small dirty maps covering the region to be
imaged; each pair was then combined and CLEANed. Tests showed
that, for an image with the same weighting and CLEANing, there
was no appreciable difference between this method and data
combination in the visibility plane (Muxlow et al. 2005, their Fig. 1). The final combined images show ![]() 6% loss of flux
at 5' from the pointing centre and there is no systematic radial
distortion of the source contours (Muxlow et al. 2005, their Fig. C1).
6% loss of flux
at 5' from the pointing centre and there is no systematic radial
distortion of the source contours (Muxlow et al. 2005, their Fig. C1).
![\begin{figure}
\par\includegraphics[width=8.05cm,clip]{7598f1.eps} \end{figure}](/articles/aa/full/2007/36/aa7598-07/img42.gif) |
Figure 1: The filled symbols show the measured angular sizes of radio sources with X-ray counterparts compared with the radio-X-ray peak separation. The sloping line has a gradient of unity, showing that all the radio sources have an angular size greater than the distance to their X-ray counterpart. The hollow symbols show the measured angular size as a function of randomised X-ray position errors (see text). |
| Open with DEXTER | |
Muxlow et al. (2005) resolved all 92 radio-bright sources at
0
![]() 2-2
2-2
![]() resolution, see Table 1,
Fig. 1 and Muxlow et al. (2005). J123644+621133 is an
FR 1 (Fanaroff & Riley 1974) radio galaxy with jets extending over
12
resolution, see Table 1,
Fig. 1 and Muxlow et al. (2005). J123644+621133 is an
FR 1 (Fanaroff & Riley 1974) radio galaxy with jets extending over
12
![]() .
Excluding this source, the mean angular size of sources at
.
Excluding this source, the mean angular size of sources at
![]() is 1
is 1
![]() 3, corresponding to
3, corresponding to ![]() 10 kpc at z>0.8.
Sources at
10 kpc at z>0.8.
Sources at
![]() have a mean size of 8 kpc and the source at z=4.424 has a
size of 2 kpc. The smaller apparent size of higher redshift sources
is probably at least partly due to the non-detection of fainter
extended emission (as well as being affected by the adopted cosmology)
and is not obviously linked to the inverse relationship between
angular size and redshift established for bright radio galaxies by
Barthel & Miley (1988).
have a mean size of 8 kpc and the source at z=4.424 has a
size of 2 kpc. The smaller apparent size of higher redshift sources
is probably at least partly due to the non-detection of fainter
extended emission (as well as being affected by the adopted cosmology)
and is not obviously linked to the inverse relationship between
angular size and redshift established for bright radio galaxies by
Barthel & Miley (1988).
VLA observations at 8.4 GHz covered the inner HDF(N) to a radius of
![]() 4
4![]() (Fomalont et al. 2002; Richards et al. 1998) at a resolution of 3
(Fomalont et al. 2002; Richards et al. 1998) at a resolution of 3
![]() 5,
finding a total of 50 sources within the 10-arcmin field. 27 of these
sources were detected at >40
5,
finding a total of 50 sources within the 10-arcmin field. 27 of these
sources were detected at >40 ![]() Jy by MERLIN+VLA at 1.4 GHz. The
remainder cannot be classified using their radio morphologies and are
omitted from our analysis, apart from 7 which do have X-ray
counterparts (Sect. 2.2). We refer to these as 8.4-GHz
selected sources. Their properties are given in Table 1,
including 1.4-GHz flux densities taken from Richards et al. (1998)
where available or calculated using the spectral indices
described in Sect. 2.1.2, so that the rest-frame
luminosities of the whole sample can be derived consistently in
Sect. 4.1.
Jy by MERLIN+VLA at 1.4 GHz. The
remainder cannot be classified using their radio morphologies and are
omitted from our analysis, apart from 7 which do have X-ray
counterparts (Sect. 2.2). We refer to these as 8.4-GHz
selected sources. Their properties are given in Table 1,
including 1.4-GHz flux densities taken from Richards et al. (1998)
where available or calculated using the spectral indices
described in Sect. 2.1.2, so that the rest-frame
luminosities of the whole sample can be derived consistently in
Sect. 4.1.
We use
![]() to denote the total radio flux density
measured by the VLA at either frequency, further subscripted by the
specific frequency only where relevant.
to denote the total radio flux density
measured by the VLA at either frequency, further subscripted by the
specific frequency only where relevant.
Four of the 92 sources were detected at (4-20)-mas resolution by
the EVN (European VLBI Network) and global VLBI (Chi et al. 2006; Garrett et al. 2001).
At the other extreme, the Westerbork Synthesis Radio Telescope at 15
![]() resolution detected
resolution detected ![]() 10% more sources than the VLA
(Garrett et al. 2000). Further VLA images on larger scales
are in preparation (Morrison et al. 2006) and recent
low-frequency observations have been made using the GMRT (Lal,
D. V., in prep.).
10% more sources than the VLA
(Garrett et al. 2000). Further VLA images on larger scales
are in preparation (Morrison et al. 2006) and recent
low-frequency observations have been made using the GMRT (Lal,
D. V., in prep.).
The radio spectral index ![]() is given by
is given by
![\begin{displaymath}%
\sigma_{\alpha_-} = \frac{2}{\ln~[8.4/1.4]} \frac{\sigma_{S_{{\rm R1.4}}}}{S_{{\rm R1.4}}}
\end{displaymath}](/articles/aa/full/2007/36/aa7598-07/img49.gif) |
(3) |
Radio sources classified as AGN or as starbursts (see
Sect. 5) detected at both frequencies had spectral
indices in the ranges (
![]() )
and (
)
and (
![]() )
respectively; all unclassified sources had
)
respectively; all unclassified sources had ![]() within the extrema
of these ranges. Where
within the extrema
of these ranges. Where ![]() is a lower limit we set
is a lower limit we set
![]() to the relevant upper limit. e.g. (
to the relevant upper limit. e.g. (
![]() )
for starburst or unclassified sources. The errors in
)
for starburst or unclassified sources. The errors in ![]() for
8.4-GHz selected sources were deduced in a similar fashion for the
opposite limits. For sources outside the 8.4 GHz field we adopted
typical values of
for
8.4-GHz selected sources were deduced in a similar fashion for the
opposite limits. For sources outside the 8.4 GHz field we adopted
typical values of ![]() of 0 and 0.8 for AGN and starbursts
respectively and an average of 0.4 for unclassified sources, using the
extrema to deduce the uncertainties, so that for example a starburst
would have
of 0 and 0.8 for AGN and starbursts
respectively and an average of 0.4 for unclassified sources, using the
extrema to deduce the uncertainties, so that for example a starburst
would have
![]() .
.
The Chandra X-ray observatory made a total of 2 Ms multi-band
exposures of the HDF(N) (Alexander et al. 2003b).
All X-ray flux densities, counts and luminosities given in this paper
refer to the Chandra full band from 0.5-8.0 keV unless
otherwise stated. Soft-band values are used for J123709+620841 and
J123646+621445 as they were not detected in the full band.
There are 100 sources in common within the area of overlap between
the whole VLA and Chandra fields of view, with a median offset
of ![]() 0
0
![]() 2 after small corrections to align the X-ray frame
(Alexander et al. 2003b).
2 after small corrections to align the X-ray frame
(Alexander et al. 2003b).
The Chandra observations completely enclose the radio 10-arcmin
field and the decline in sensitivity in both images towards the edges
of this region is less than 6%. This field contains 253 X-ray
sources with position uncertainties 0
![]() 3-0
3-0
![]() 9. Fifty-five
(60%) of the radio-bright sources have X-ray counterparts within
0
9. Fifty-five
(60%) of the radio-bright sources have X-ray counterparts within
0
![]() 9 of the radio peak; the separation is <0
9 of the radio peak; the separation is <0
![]() 4 for 42 of
these. Increasing the cross-match search radius up to 2
4 for 42 of
these. Increasing the cross-match search radius up to 2
![]() failed to produce any more matches. One or two additional matches
appear for each additional arcsec radius from 2-5
failed to produce any more matches. One or two additional matches
appear for each additional arcsec radius from 2-5
![]() .
Each of these
radio sources also has a counterpart at <0
.
Each of these
radio sources also has a counterpart at <0
![]() 9; in about half
these cases the multiple associations appear to be genuine
(e.g. similar redshifts). We consider that we can only be confident that the
emission is coming from the same galaxy for the 55 unambiguous matches
at <0
9; in about half
these cases the multiple associations appear to be genuine
(e.g. similar redshifts). We consider that we can only be confident that the
emission is coming from the same galaxy for the 55 unambiguous matches
at <0
![]() 9 separation. These make up 22% of the X-ray detections
in the 10-arcmin field. Seven additional 8.4-GHz selected sources have
X-ray counterparts within their combined position uncertainties.
9 separation. These make up 22% of the X-ray detections
in the 10-arcmin field. Seven additional 8.4-GHz selected sources have
X-ray counterparts within their combined position uncertainties.
We compared the largest angular size of each radio-bright source with
the X-ray - radio source separation, represented by the solid circles
in Fig. 1 (J123644+621133, with an angular size of
12
![]() ,
has been omitted). In every case the X-ray peak is no
further from the radio peak than the most extended radio emission. We
produced randomised X-ray position errors, in a Gaussian distribution,
such that 80-90% of the X-ray positions were within the published
errors of 0
,
has been omitted). In every case the X-ray peak is no
further from the radio peak than the most extended radio emission. We
produced randomised X-ray position errors, in a Gaussian distribution,
such that 80-90% of the X-ray positions were within the published
errors of 0
![]() 3-0
3-0
![]() 9 (Alexander et al. 2003b), which are plotted
as hollow squares. The radio peak position errors are negligible in
comparison (
9 (Alexander et al. 2003b), which are plotted
as hollow squares. The radio peak position errors are negligible in
comparison (![]() 0
0
![]() 1). There is no evidence for any systematic
excess in the measured source separations with respect to the X-ray
position errors but peak offsets of
1). There is no evidence for any systematic
excess in the measured source separations with respect to the X-ray
position errors but peak offsets of ![]() 1
1
![]() cannot be ruled
out.
cannot be ruled
out.
The X-ray photon index ![]() ,
for flux density
,
for flux density
![]() in
10-18 W m-2 at energy E keV is defined by
in
10-18 W m-2 at energy E keV is defined by
The original HDF and surrounding fields (out to a distance of
![]() 5
5![]() )
was observed by the HST WFPC2 in 1996
(Williams et al. 1996). In 2003 the GOODS project used the HST ACS
to re-observe the HDF region in the F435W, F606W, F775W and F850LP filters (B, V, i and z bands). We find
that the GOODS images and source catalogue r1.1z (Giavalisco et al. 2004)
require a linear shift of -0
)
was observed by the HST WFPC2 in 1996
(Williams et al. 1996). In 2003 the GOODS project used the HST ACS
to re-observe the HDF region in the F435W, F606W, F775W and F850LP filters (B, V, i and z bands). We find
that the GOODS images and source catalogue r1.1z (Giavalisco et al. 2004)
require a linear shift of -0
![]() 342 in Declination to align them
with the ICRF.
342 in Declination to align them
with the ICRF.
The ISO fields and the Spitzer catalogue published by
Teplitz et al. (2005) only cover part of the 10-arcmin field so it is only
possible to give meaningful statistics for the fractions of the IR catalogues detected at other wavelengths (not vice versa). More
quantitative analysis will be available using further Spitzer
results at 24 ![]() m (see e.g. Beswick et al. 2006). Extensive SCUBA
searches have been made over most of the HDF(N).
m (see e.g. Beswick et al. 2006). Extensive SCUBA
searches have been made over most of the HDF(N).
One hundred sources were detected in the inner HDF(N) by ISO at
7 or 15 ![]() m (Aussel et al. 1999). Although the beam size was
3-6
m (Aussel et al. 1999). Although the beam size was
3-6
![]() the tight correlation between radio and 15
the tight correlation between radio and 15 ![]() m flux
densities out to at least z=3 (Garrett 2002;
Elbaz et al. 2002; see Sect. 1) supports the association
of radio and IR sources within the position errors even if they
overlap more than one optical source. 28 radio-bright sources lie
within the ISO field, of which 17 have ISO counterparts
(Muxlow et al. 2005). All matched sources were detected at 15-
m flux
densities out to at least z=3 (Garrett 2002;
Elbaz et al. 2002; see Sect. 1) supports the association
of radio and IR sources within the position errors even if they
overlap more than one optical source. 28 radio-bright sources lie
within the ISO field, of which 17 have ISO counterparts
(Muxlow et al. 2005). All matched sources were detected at 15-![]() m
except for J123656+621301. This is nonetheless an extended diffuse
radio source with a very steep spectrum characteristic of a
starburst. An additional 7-
m
except for J123656+621301. This is nonetheless an extended diffuse
radio source with a very steep spectrum characteristic of a
starburst. An additional 7-![]() m source in the catalogue of
Goldschmidt et al. (1997) is matched with the FR 1 J12364+621133.
m source in the catalogue of
Goldschmidt et al. (1997) is matched with the FR 1 J12364+621133.
The radio-MIR association has been reinforced by recently-published
Spitzer observations at 16 ![]() m (Teplitz et al. 2005). 18
Spitzer sources have MERLIN+VLA counterparts within
1
m (Teplitz et al. 2005). 18
Spitzer sources have MERLIN+VLA counterparts within
1
![]() 2. Half of these lie outside the ISO fields. Of the
other nine, 7 already had ISO counterparts (including the
very red source J123651+621221 at z=2.71; Teplitz et al. (2005)
associate the IR emission with an elliptical galaxy at a similar
separation but lower redshift). The other two, J123633+621005 and
J123708+621056, lie close to the edges of the ISO field where
its noise was higher. We cannot confidently associate
J123646+621445 with the Spitzer source 1
2. Half of these lie outside the ISO fields. Of the
other nine, 7 already had ISO counterparts (including the
very red source J123651+621221 at z=2.71; Teplitz et al. (2005)
associate the IR emission with an elliptical galaxy at a similar
separation but lower redshift). The other two, J123633+621005 and
J123708+621056, lie close to the edges of the ISO field where
its noise was higher. We cannot confidently associate
J123646+621445 with the Spitzer source 1
![]() 7 to the SW as
they have two separate optical counterparts. An ISO source
lies within 3
7 to the SW as
they have two separate optical counterparts. An ISO source
lies within 3
![]() of the 16
of the 16 ![]() m source but further from
J123646+621445. There are no further candidate radio-IR matches
within 2
m source but further from
J123646+621445. There are no further candidate radio-IR matches
within 2
![]() .
.
The combined Spitzer and ISO data contain 205 separate
15- or 16-![]() m sources within the 10-arcmin field of which a quarter
(53) have X-ray counterparts. Even fewer (26, 13%) have radio-bright
counterparts, but almost all of these (21/26) are also X-ray
detections. This complements the tendency, noted by
Alexander et al. (2002), that optically identified (emission line)
15
m sources within the 10-arcmin field of which a quarter
(53) have X-ray counterparts. Even fewer (26, 13%) have radio-bright
counterparts, but almost all of these (21/26) are also X-ray
detections. This complements the tendency, noted by
Alexander et al. (2002), that optically identified (emission line)
15 ![]() m starbursts with X-ray emission are more likely to have radio
counterparts than those without. Four of the 7 8.4-GHz selected
sources with X-ray counterparts have ISO counterparts, 3 of
which were also detected by Spitzer.
m starbursts with X-ray emission are more likely to have radio
counterparts than those without. Four of the 7 8.4-GHz selected
sources with X-ray counterparts have ISO counterparts, 3 of
which were also detected by Spitzer.
Several sets of observing and data reduction techniques have produced
various SCUBA catalogues optimised for different regions and
properties (e.g. Serjeant et al. 2003; Borys et al. 2004; Chapman et al. 2005; Wang et al. 2004).
The techniques used to minimise ambiguity in cross-identifications are
summarised in Muxlow et al. (2005). The most comprehensive list is
currently provided by Borys et al. (2004) (the revisions by Pope et al. 2005,
do not affect any radio-bright sources). We use all their secure
identifications between SMGs and radio-bright sources. We also
include the additional identifications of J123622+621629 and
J123711+621325 made by Chapman et al. (2005). We do not include the SMGs
known as HDF 850-1 and 850-6 as most authors conclude that they do not
have radio-bright counterparts.
J123608+621431 is
![]() 3
3
![]() from the nearest X-ray source so it is not included
in the detailed analysis in this paper, but both objects are within
the larger error circle of a SCUBA source. We reject the
identification of J123646+621445 for reasons similar to those given in
Sect. 2.4.1 with respect to IR sources.
from the nearest X-ray source so it is not included
in the detailed analysis in this paper, but both objects are within
the larger error circle of a SCUBA source. We reject the
identification of J123646+621445 for reasons similar to those given in
Sect. 2.4.1 with respect to IR sources.
This leaves 16 radio-bright sources in the 10-arcmin field with SCUBA
counterparts, of which 11 were also detected by Chandra; one
further 8.4-GHz source has both SCUBA and X-ray detections. All these
sources have either spectroscopic or photometric redshifts, which we
adopt in preference to redshifts derived from the 1.4-GHz/850-![]() m
flux density ratio in order to avoid circular arguments.
m
flux density ratio in order to avoid circular arguments.
61 radio-bright sources and 140 Chandra sources in the 10-arcmin field have measured redshifts, including 50 of the 55 radio-bright X-ray sources. 19 of the 8.4-GHz selected sources also have measured redshifts, including 7 with X-ray counterparts.
Table 1 gives our adopted redshift measurements,
uncertainties
![]() and references for the sources
detected in both regimes. We include the published errors,
and references for the sources
detected in both regimes. We include the published errors,
![]() ,
where given. If not we adopt
,
where given. If not we adopt
![]() for
spectroscopic redshifts, which were all obtained using the Keck LRIS or
instruments with resolution as good or better. The uncertainties
in photometric redshifts are
for
spectroscopic redshifts, which were all obtained using the Keck LRIS or
instruments with resolution as good or better. The uncertainties
in photometric redshifts are ![]() apart from J123725+621128 where
1<z<2 was estimated from the K:z band flux density
ratio (Hornschemeier et al. 2001). The uncertainties do not include
possible misidentifications of objects or of spectral lines, nor
instabilities in photometric fitting.
In most cases the differences between different redshift
estimates for the same source are small, or have been discussed and
resolved in the literature. The redshift for J123616+621513 has now
been revised to 2.58 (Chapman et al. 2004a).
We adopt recently-published redshifts for faint NICMOS or
ACS galaxies associated with
the radio sources J123606+621021, J123642+62133, J123651+621221 and
J123716+621512, in preference to the photometric redshifts derived by
Barger et al. (2003) for their X-ray counterparts using more widely
separated, older optical detections.
apart from J123725+621128 where
1<z<2 was estimated from the K:z band flux density
ratio (Hornschemeier et al. 2001). The uncertainties do not include
possible misidentifications of objects or of spectral lines, nor
instabilities in photometric fitting.
In most cases the differences between different redshift
estimates for the same source are small, or have been discussed and
resolved in the literature. The redshift for J123616+621513 has now
been revised to 2.58 (Chapman et al. 2004a).
We adopt recently-published redshifts for faint NICMOS or
ACS galaxies associated with
the radio sources J123606+621021, J123642+62133, J123651+621221 and
J123716+621512, in preference to the photometric redshifts derived by
Barger et al. (2003) for their X-ray counterparts using more widely
separated, older optical detections.
The redshift distributions of radio and X-ray sources and of objects detected in both regimes are compared in Fig. 2. All three distributions peak at 0.5<z<1.0 but the fraction of X-ray sources with measured redshifts which are radio-loud changes from less than a third at z<1 to a half or greater at higher z. A similar increase in codetections with redshift is seen in the fraction of radio sources which are X-ray-selected type-II AGN. We used the Kolmogorov-Smirnov test to investigate the relationship between the redshift distributions of the radio and X-ray sources. We found that there is a 93% probability that radio and X-ray sources at z<1.1are drawn from the same population and a 98% probability for sources at z>1.1, but this drops to an insignificant probability of 27% for all redshifts considered together. This only makes sense if the radio counterparts to X-ray sources at lower redshifts are a separate population from those at higher redshifts. These implications are discussed in Sects. 5.2 and 7.
![\begin{figure}
\par\includegraphics[width=8.05cm,clip]{7598f2.eps} \end{figure}](/articles/aa/full/2007/36/aa7598-07/img70.gif) |
Figure 2: The distribution of sources with published redshifts in the 10-arcmin field. The filled blue area in the lower panel shows X-ray sources and the dashed yellow line shows X-ray selected type-II AGN. The filled orange area in the upper panel shows radio sources. In both panels the cross-matched X-ray and radio sources, and those which are also X-ray selected type-II AGN, are shown by the thick grey and thin black lines, respectively. (This figure is available in color in electronic form.) |
| Open with DEXTER | |
We made use of a wide range of published surveys and catalogues.
These were obtained using the Vizier![]() service where possible, in order to
select sources in the exact area covered by the radio data, and obtain
tables in VOTable
service where possible, in order to
select sources in the exact area covered by the radio data, and obtain
tables in VOTable![]() format for ease of further
manipulation. Other data (e.g. in IPAC format) were converted to
VOTable using TopCat
format for ease of further
manipulation. Other data (e.g. in IPAC format) were converted to
VOTable using TopCat![]() ,
which preserves accuracy equivalent to full double precision. Sources
were crossmatched using either the AstroGrid
,
which preserves accuracy equivalent to full double precision. Sources
were crossmatched using either the AstroGrid![]() Xmatch tool or TopCat, which allowed us to
identify and correct for any systematic linear offsets due to
astrometric errors. We also used TopCat to calculate luminosities and
other derived quantities (Sect. 4) presented in the tables, and to prepare many of
the plots.
Xmatch tool or TopCat, which allowed us to
identify and correct for any systematic linear offsets due to
astrometric errors. We also used TopCat to calculate luminosities and
other derived quantities (Sect. 4) presented in the tables, and to prepare many of
the plots.
![\begin{figure}
\par\includegraphics[width=11.5cm,clip]{7598f3.ps} \end{figure}](/articles/aa/full/2007/36/aa7598-07/img71.gif) |
Figure 3:
The use of the Euro-VO Aladin and PLASTIC to investigate
the starburst candidate J123633+621005. Clockwise from top left,
the panels show: a) Chandra image overlaid with the outlines
of HST ACS field boundaries; clicking in the appropriate
square selects the relevant image(s) for loading. The coloured
symbols show radio sources, with symbol size proportional to source
size and shade proportional to redshift. b) Radio contours for
J123633+621005; the red cross and blue square mark radio and X-ray peaks,
respectively. c) ACS F775W image d) ACS false colour
composite of F435W, F606W and F850LP bands, all overlaid with radio
contours. The
scale bars in the bottom left of each panel represent a) 1 arcmin,
b) 1 arcsec, c) and d) 0
|
| Open with DEXTER | |
The original images have resolutions from ![]() 0
0
![]() 015 (HST) to several arcsec (ISO, SCUBA). The MERLIN+VLA and HST maps are made up of many small panels each containing about a
million pixels. We used the Aladin visualisation tool as modified for
the Euro-VO
015 (HST) to several arcsec (ISO, SCUBA). The MERLIN+VLA and HST maps are made up of many small panels each containing about a
million pixels. We used the Aladin visualisation tool as modified for
the Euro-VO![]() to find, cross-identify
and visualise regions of interest on such different scales; an example
is shown in Fig. 3. The International
Virtual Observatory
to find, cross-identify
and visualise regions of interest on such different scales; an example
is shown in Fig. 3. The International
Virtual Observatory![]() Simple Image
Access Protocol (SIAP) for descriptions of images and their locations is used
to locate the corresponding fields in Chandra, MERLIN+VLA and
HST images despite the different resolutions, image sizes and
even orientations. The PLASTIC
Simple Image
Access Protocol (SIAP) for descriptions of images and their locations is used
to locate the corresponding fields in Chandra, MERLIN+VLA and
HST images despite the different resolutions, image sizes and
even orientations. The PLASTIC![]() protocol developed for
VOTech
protocol developed for
VOTech![]() allows any of these VO
tools to manipulate the same data.
allows any of these VO
tools to manipulate the same data.
It is now feasible to image much larger radio fields in entirety,
compared with the epoch when the MERLIN+VLA observations were made,
thanks to increased computing power, improved algorithms in AIPS
and the use of Virtual Observatory standards and tools for data
management. We made 81 slightly overlapping square images, each of
1024 ![]() 0
0
![]() 0625 pixels on a side. We combined these images
into a single (8
0625 pixels on a side. We combined these images
into a single (8 ![]() 8) arcmin2 1.4-GHz image, hereafter the
8-arcmin field. This contains over 67 Mpixels, covering most of the
maximum sensitivity regions of both the radio and X-ray images, with
good overlap with the ACS data. This will be extended to cover
the 5-arcmin radius region of near-optimum radio sensitivity. We
describe our use of the new 8-arcmin HDF(N) image in
Sect. 8.
8) arcmin2 1.4-GHz image, hereafter the
8-arcmin field. This contains over 67 Mpixels, covering most of the
maximum sensitivity regions of both the radio and X-ray images, with
good overlap with the ACS data. This will be extended to cover
the 5-arcmin radius region of near-optimum radio sensitivity. We
describe our use of the new 8-arcmin HDF(N) image in
Sect. 8.
The range of baseline lengths in the combined MERLIN+VLA data means
that maps can be extracted at resolutions of 0
![]() 2-2
2-2
![]() depending
on whether the observer wants to investigate potential
compact hot spots or faint extended emission. Muxlow et al. (2005) gives
a full description of the method which was used to produce the earlier
hand-processed images. We now provide an automatic imaging service
which extracts the required region and convolves it with the chosen
restoring beam within this resolution range. This uses the
python-based package ParselTongue
depending
on whether the observer wants to investigate potential
compact hot spots or faint extended emission. Muxlow et al. (2005) gives
a full description of the method which was used to produce the earlier
hand-processed images. We now provide an automatic imaging service
which extracts the required region and convolves it with the chosen
restoring beam within this resolution range. This uses the
python-based package ParselTongue![]() (Kettenis et al. 2006), developed in the RadioNet Consortium, to provide a scripting interface between AstroGrid and
"classic'' AIPS. The AstroGrid workbench offers a simple dialogue
box for the user to select image size, resolution and region within
the HDF(N). These parameters are passed to the MERLIN archive server
which uses ParselTongue to extract the required image. A
pointer to the image and a basic (SIAP-compliant) description is
either returned straight to the user or can be used to pass it to
another VO-enabled tool such as Aladin or a source extractor. This VO
tool and the complementary MERLINImager (which operates on the
visibility data for other MERLIN archive data) are the first to allow
an astronomer to obtain customised radio images without having to
install their own specialised radio data reduction package. Moreover,
only the required image (at most 0.25 GB) is moved over the internet
to the point of use; the parent data set, which can be many GB, is
processed in situ.
(Kettenis et al. 2006), developed in the RadioNet Consortium, to provide a scripting interface between AstroGrid and
"classic'' AIPS. The AstroGrid workbench offers a simple dialogue
box for the user to select image size, resolution and region within
the HDF(N). These parameters are passed to the MERLIN archive server
which uses ParselTongue to extract the required image. A
pointer to the image and a basic (SIAP-compliant) description is
either returned straight to the user or can be used to pass it to
another VO-enabled tool such as Aladin or a source extractor. This VO
tool and the complementary MERLINImager (which operates on the
visibility data for other MERLIN archive data) are the first to allow
an astronomer to obtain customised radio images without having to
install their own specialised radio data reduction package. Moreover,
only the required image (at most 0.25 GB) is moved over the internet
to the point of use; the parent data set, which can be many GB, is
processed in situ.
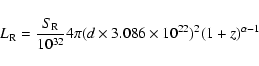
There is no correlation between radio and X-ray flux densities for the whole cross-matched sample nor for any subsets; however this is not surprising given the wide span of redshifts and the different behaviour of the spectral/photon indices for different sources. We therefore compared the K-corrected luminosities for all 50 sources with measured redshifts.
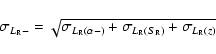
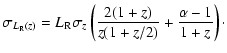
Table 1 lists the observed-frame 1.4-GHz total radio flux density per
source,
![]() ,
in
,
in ![]() Jy. The flux densities and their
uncertainties (
Jy. The flux densities and their
uncertainties (
![]() )
are given in Muxlow et al. (2005) and
Richards et al. (1998).
)
are given in Muxlow et al. (2005) and
Richards et al. (1998).
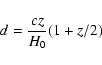
We assume an empty Friedmann universe (
![]() ), for
consistency with Padovani et al. (2004) and take H0 = 70 km s-1 Mpc-1.
The radio rest-frame luminosity
), for
consistency with Padovani et al. (2004) and take H0 = 70 km s-1 Mpc-1.
The radio rest-frame luminosity
![]() ,
taking into account the K-correction and the expansion of the bandwidth in the observed frame, is given in W Hz-1 by
,
taking into account the K-correction and the expansion of the bandwidth in the observed frame, is given in W Hz-1 by
The rest-frame X-ray luminosity is given by the analogy of Eq. (5).
In this section, we discuss diagnostics for the specific origins of the radio and X-ray emission, based on the references and discussion of Sect. 1, applied to the derived source properties. We keep the initial radio source classification independent of X-ray properties (and vice versa) as we wish to investigate whether the observed radio and X-ray emission comes from different sources within the same galaxies. In particular, we do not use published radio-X-ray relationships such as Eq. (1) for classification, but compare our results with this in the next Sect. 6.
The main diagnostics for the origins of the radio-bright emission are:
VLBI results support the AGN interpretation of compact, flat-spectrum radio cores. Extremely compact radio cores (brightness temperature (> 105-106) K) were detected in J123642+621331, J123644+621133, J123646+621404 and J123652+121444 using the European VLBI Network (EVN) and global VLBI (Chi et al. 2006; Garrett et al. 2001), confirming the presence of an AGN. J123644+621133 is unmistakably an FR 1. The EVN recovers all the VLA flux from J123646+621404. About 1/3 of the VLA flux from J123652+121444 is present in the 4-mas resolution global VLBI image but the source is known to be variable (Richards et al. 1998). All three sources have flat or inverted spectra. J123642+621133 is discussed in more detail in Sect. 5.3; in summary we infer that it consists of compact AGN-powered emission embedded in a more diffuse starburst. The MERLIN+VLA data suggest that this is also the situation for J123635+621424 and J123642+121545.
Table 2 gives our classifications for the objects with X-ray counterparts. The recent ACS and Spitzer data and improved SCUBA source lists have allowed us to strengthen the classification of a number of sources. We have changed the classification of 4 sources, as follows. J123622+621544 was tentatively assigned AGN status by Muxlow et al. (2005) but the ACS image shows that the radio emission is extended over bright optical knots in a distorted spiral, not seen in the original CFHT plate (Canada-France-Hawaii Telescope, Barger et al. 1999). It is also a new MIR detection by Spitzer and has a radio spectral index >0.6 so we reclassify J123622+621544 as a starburst. We infer from the Spitzer and ACS images that two previously unclassified sources with steep radio spectra are starbursts. J123629+621046 is extended, with a red optical counterpart which is either a distorted galaxy with a dust lane or two interacting galaxies. J123641+620948 has a compact core but the ACS image confirms the suggestion by Cohen et al. (2000) that it is associated with two interacting spiral galaxies. The ACS morphology allows us to reclassify J123642+621545 as a starburst candidate with a possible AGN core, as its extended radio emission overlays blue knots in the arms of a face-on spiral. It also possesses a relatively bright compact radio and optical core. It was detected by ISO and has an intermediate radio spectral index of 0.5.
Note that the classifications of radio-bright sources are made primarily on the
basis of radio properties such as morphology and/or spectral index
(conditions 1. and 2. above) whilst information from other wavebands
(conditions 3. and 4.) is used as supporting evidence. The origins of the radio emission from the seven 8.4-GHz-selected
sources with X-ray counterparts are less certain as they are
unresolved in the radio and have approximate spectral indices or upper
limits only. The ACS images show that J123637+621135,
J123639+621249 and J123648+621427 are associated with spiral galaxies
with knots of star-formation (the lower-resolution CFHT image of J123648+621427
appeared elliptical). J123644+621249 is associated with a pair of
apparently interacting optical galaxies at very similar redshifts. All
four have
![]() and we list them as starbursts although the closest
(J123637+621135) is in fact of low luminosity, more like a normal
star-forming galaxy. The remaining 3 have flatter spectra;
J123655+621311 is associated with an elliptical galaxy likely to
contain an AGN; the other two are unclassified.
and we list them as starbursts although the closest
(J123637+621135) is in fact of low luminosity, more like a normal
star-forming galaxy. The remaining 3 have flatter spectra;
J123655+621311 is associated with an elliptical galaxy likely to
contain an AGN; the other two are unclassified.
In total, the 92 radio-bright sources include 23 unclassified objects,
52 starbursts and 17 AGN, using the radio-based classification. The 55 sources with X-ray counterparts include 9 of the unclassified sources,
36 starbursts and 12 radio AGN. The starburst:AGN ratio is almost
identical, ![]() 3:1, to the that of the full radio-bright sample.
The three starbursts which contain radio AGN (counted once only, as
starbursts) are all X-ray detections. MIR observations only cover part
of the field but contain 22 sources detected at 15- or 16-
3:1, to the that of the full radio-bright sample.
The three starbursts which contain radio AGN (counted once only, as
starbursts) are all X-ray detections. MIR observations only cover part
of the field but contain 22 sources detected at 15- or 16-![]() m as
well as in the radio and X-ray. Nineteen of these (86%) are radio
starbursts, including 3 with radio AGN cores, 4 with X-ray selected
type-II AGN (see Sect. 5.2) and one with both. Two more are
probably AGN, J123646+621404 (also an X-ray type-II AGN) and
J123709+620841 (see Muxlow et al. 2005). J123655+620808 is
unclassified as, although the ACS image shows an apparently
spiral galaxy with a dust lane, the extended radio emission is
misaligned.
m as
well as in the radio and X-ray. Nineteen of these (86%) are radio
starbursts, including 3 with radio AGN cores, 4 with X-ray selected
type-II AGN (see Sect. 5.2) and one with both. Two more are
probably AGN, J123646+621404 (also an X-ray type-II AGN) and
J123709+620841 (see Muxlow et al. 2005). J123655+620808 is
unclassified as, although the ACS image shows an apparently
spiral galaxy with a dust lane, the extended radio emission is
misaligned.
The great majority of X-ray sources in the HDF region are unresolved by Chandra so only luminosity and spectral index information may be available to determine the specific origin of the X-ray emission. Many classifications in the literature are based on optical and other properties which could be due to separate mechanisms within the host galaxy. A comprehensive source-by-source breakdown is not available but out of the 19 sources from the 1 Ms sample cross-matched by Bauer et al. (2002b), about 1/3 are classed as emission-line galaxies and presumed to have X-ray emission of starburst origin; most of the remainder are X-ray AGN.
Star-forming galaxies and ULIRGs show a close correlation between their star formation rates represented by FIR emission, and both hard- and soft-band X-ray emission (Ranalli et al. 2003), although Rosa-Gonzalez et al. (2007) has recently found that, for a higher-redshift sample in the CDF(S), the SFR implied hard-band luminosities can be excessive compared from the rates derived from soft-band or Spitzer MIR data, presumably due to obscured-AGN contamination in the hard band. Hard X-ray emission associated with star formation is thought to originate from high-mass X-ray binaries (e.g. Grimm et al. 2003). More slowly-evolving low-mass X-ray binaries are likely to be less significant (Rosa-Gonzalez et al. 2007), especially in young starburst galaxies. This leaves young supernova remnants and hot plasmas associated with star-forming regions and galactic winds as possible sources of the soft-x-ray component (Ranalli et al. 2003), especially if super star clusters are forming (Griffiths et al. 2000), as discussed by Norman et al. (2004).
The X-ray luminosity of most optically classified starbursts is
<1035 W (Alexander et al. 2002) whilst the presence of detectable
hard band (2-8 keV) emission and X-ray luminosities ![]() 1035 W is
usually taken to indicate the presence of an AGN;
1035 W is
usually taken to indicate the presence of an AGN; ![]() 1037 W
implies a QSO (Alexander et al. 2003a). However, it is not unreasonable
that the most extreme starbursts could exceed an X-ray power of
1035 W, if the X-ray luminosity is proportional to the rest-frame
IR emission (e.g. Ranalli et al. 2003), whilst some nearby FR 1 have
X-ray luminosities of only
1033-1035 W (Evans et al. 2006).
Soft-band dominated X-ray emission (photon index
1037 W
implies a QSO (Alexander et al. 2003a). However, it is not unreasonable
that the most extreme starbursts could exceed an X-ray power of
1035 W, if the X-ray luminosity is proportional to the rest-frame
IR emission (e.g. Ranalli et al. 2003), whilst some nearby FR 1 have
X-ray luminosities of only
1033-1035 W (Evans et al. 2006).
Soft-band dominated X-ray emission (photon index
![]() )
can
indicate a starburst origin (Ptak et al. 1999) but is also seen from
unobscured AGN (George et al. 2000). In the latter situation the emission
could be due to accretion or to jets but both mechanisms are
AGN-powered and included in X-ray AGN statistics.
)
can
indicate a starburst origin (Ptak et al. 1999) but is also seen from
unobscured AGN (George et al. 2000). In the latter situation the emission
could be due to accretion or to jets but both mechanisms are
AGN-powered and included in X-ray AGN statistics.
Obscured (type II) AGN have a harder photon index (
![]() );
they are the only known sources with
);
they are the only known sources with
![]() (Alexander et al. 2005a) but
(Alexander et al. 2005a) but
![]() is also seen from high-mass
X-ray binaries in starbursts. Nonetheless, the combination of
is also seen from high-mass
X-ray binaries in starbursts. Nonetheless, the combination of
![]() with a rest-frame 2-8-keV luminosity
with a rest-frame 2-8-keV luminosity
![]() W can only be explained by a type-II AGN (see
Sect. 6.2). Padovani et al. (2004) identified a total of 91 such
sources in the HDF(N) with a hardness ratio corresponding
approximately to
W can only be explained by a type-II AGN (see
Sect. 6.2). Padovani et al. (2004) identified a total of 91 such
sources in the HDF(N) with a hardness ratio corresponding
approximately to
![]() .
Of these, 64 lie within the
10-arcmin field and 17 are radio-bright. These are identified in
Table 2. A column density
.
Of these, 64 lie within the
10-arcmin field and 17 are radio-bright. These are identified in
Table 2. A column density
![]() m-2 is required to
provide sufficient obscuration. The estimates of
m-2 is required to
provide sufficient obscuration. The estimates of
![]() given by Alexander et al. (2005a) for SMG confirmed that all 8 of the
type-II AGN common to their sample and ours exceed this threshold.
given by Alexander et al. (2005a) for SMG confirmed that all 8 of the
type-II AGN common to their sample and ours exceed this threshold.
Bauer et al. (2004) find that around 75-90% of the 2-Ms HDF(N) X-ray sources are AGN, of which about 2/3 appear absorbed, and about half the remainder are starbursts. A variety of studies of the GOODS fields, including the use of multi-wavelength properties (Szokoly et al. 2004; Bauer et al. 2002b; Hornschemeier et al. 2001) give similar results, implying a ratio of approximately 8:1 AGN to starbursts among the X-ray detected sources.
Our sample contains 62 X-ray sources with radio-bright counterparts of which 17 or 18 appear to be heavily obscured X-ray AGN. In total, 37 (about 2/3) of the sources with measured redshifts, have hard-band X-ray luminosities brighter than 1035 W (see Sect. 6.2) suggesting the presence of an AGN of some type (Alexander et al. 2003a; Cowie et al. 2004a). Statistically, the majority of all the X-ray emission is probably AGN-powered but it is not possible to distinguish between very luminous but softer emission from starbursts or unobscured AGN on the basis of X-ray properties alone; moreover, diagnostics from other regimes do not guarantee that the emission is from the same phenomenon on a sub-galactic scale. We therefore concentrate on comparing the X-ray-selected type-II AGN population with radio sources classified as AGN or as starbursts.
The highest redshift radio source, J123642+621331, at z=4.424, has a
high total 1.4-GHz flux density (467 ![]() Jy). It has a steep radio
spectrum, it is a very reddened NICMOS detection (Waddington et al. 1999)
and it was detected by ISO at 15
Jy). It has a steep radio
spectrum, it is a very reddened NICMOS detection (Waddington et al. 1999)
and it was detected by ISO at 15 ![]() m, all properties
consistent with starforming activity. Its 1.4-GHz/FIR ratio, however,
is 20-50 times higher than other HDF(N) star-forming galaxies
(Garrett 2002). The MERLIN+VLA image shows that about 10% of the
flux is diffuse and extended at between 100-200 mas from the core
(
m, all properties
consistent with starforming activity. Its 1.4-GHz/FIR ratio, however,
is 20-50 times higher than other HDF(N) star-forming galaxies
(Garrett 2002). The MERLIN+VLA image shows that about 10% of the
flux is diffuse and extended at between 100-200 mas from the core
(![]() 1 kpc), which is likely to contain the starburst component.
The star formation rate inferred from the IR flux density is
1 kpc), which is likely to contain the starburst component.
The star formation rate inferred from the IR flux density is
![]()
![]() yr-1, comparable to the other highest
star formation rates deduced for starbursts in the HDF(N), which would
account for
yr-1, comparable to the other highest
star formation rates deduced for starbursts in the HDF(N), which would
account for ![]() 1% of the radio emission.
1% of the radio emission.
The compact core is AGN-dominated; the EVN detected over half the
1.4-GHz flux (Garrett 2002) and global VLBI (Chi et al. 2006) resolves
a jet component a few tens of pc from the core. J123642+621331 has a
measured
![]() ,
above the limit for type-II AGN, but
Padovani et al. (2004) noted that high-redshift sources might be
misclassified. The expressions in
Sect. 4.2 assume that
,
above the limit for type-II AGN, but
Padovani et al. (2004) noted that high-redshift sources might be
misclassified. The expressions in
Sect. 4.2 assume that ![]() is constant from the
observed frame to the rest frame. Alexander et al. (2005a), in their Fig. 7,
demonstrate how absorption is a strong function of wavelength, such
that for
is constant from the
observed frame to the rest frame. Alexander et al. (2005a), in their Fig. 7,
demonstrate how absorption is a strong function of wavelength, such
that for
![]()
![]() 1027 m-2, rest-frame
energies
1027 m-2, rest-frame
energies ![]() 6 keV are much less affected than lower energies. At
6 keV are much less affected than lower energies. At
![]()
![]() 1027 m-2 the iron emission and
absorption lines, at rest frame energies 6-7 keV and 7-8 keV
respectively, become more prominent. The measured
1027 m-2 the iron emission and
absorption lines, at rest frame energies 6-7 keV and 7-8 keV
respectively, become more prominent. The measured ![]() is derived
from the ratio of flux densities above and below 2 keV in the
observed frame. This dividing energy corresponds to
is derived
from the ratio of flux densities above and below 2 keV in the
observed frame. This dividing energy corresponds to ![]() 6 keV at
6 keV at
![]() ,
so the observed
,
so the observed ![]() of a high redshift absorbed source
may appear greater than the actual rest-frame 0.5-8 keV photon index.
In turn, the actual
of a high redshift absorbed source
may appear greater than the actual rest-frame 0.5-8 keV photon index.
In turn, the actual
![]() would be higher than the value
given in Table 2. J123642+621331 would be most strongly
affected. If it is a type-II AGN with a rest frame 0.5-8 keV
would be higher than the value
given in Table 2. J123642+621331 would be most strongly
affected. If it is a type-II AGN with a rest frame 0.5-8 keV
![]() ,
this is compatible with the observed
,
this is compatible with the observed
![]() .
.
![\begin{figure}
\par\includegraphics[width=10cm,clip]{7598f4.eps} \end{figure}](/articles/aa/full/2007/36/aa7598-07/img113.gif) |
Figure 4:
The distribution of the classes of radio-bright sources
(see key) with respect to
|
| Open with DEXTER | |
![\begin{figure}
\par\includegraphics[width=12cm,clip]{7598f5.eps} \end{figure}](/articles/aa/full/2007/36/aa7598-07/img114.gif) |
Figure 5:
The accuracy of
|
| Open with DEXTER | |
Figure 4 shows the relationship between
![]() and
and
![]() taken from Table 2 for the
radio-bright X-ray sources with redshifts. The symbol sizes
and shapes represent the largest angular size and the
classification applied to the radio emission with a blue A
denoting the presence of an X-ray selected type-II AGN. The shade
of the symbols indicates the redshift. The accuracy of our
estimates of
taken from Table 2 for the
radio-bright X-ray sources with redshifts. The symbol sizes
and shapes represent the largest angular size and the
classification applied to the radio emission with a blue A
denoting the presence of an X-ray selected type-II AGN. The shade
of the symbols indicates the redshift. The accuracy of our
estimates of
![]() and
and
![]() and potential
selection effects are shown in Fig. 5, for all
cross-matched sources with redshifts. All sources shown have
measured flux densities in both radio and X-ray regimes and
measured redshifts (Sect. 2.2 and Table 1). Filled
triangles pointing up (down) indicate objects which were detected
at both 1.4 and 8.4 GHz (in at least two X-ray bands) giving a
measured spectral (photon) index. Thus, the filled stars show
objects with complete measurements. Where one band is a defined
limit, an arrow shows the resulting direction of uncertainty in the
luminosity. Open triangles show sources where the spectral or
photon index has been estimated as described in Sects. 2.1.1
and 2.2. The error bars were derived as described in
Sect. 4 which also describes the method for
estimating spectral (photon) indices where a source was only
detected in one band in the radio (X-ray) regime; such sources are
shown by open triangles pointing up (down).
and potential
selection effects are shown in Fig. 5, for all
cross-matched sources with redshifts. All sources shown have
measured flux densities in both radio and X-ray regimes and
measured redshifts (Sect. 2.2 and Table 1). Filled
triangles pointing up (down) indicate objects which were detected
at both 1.4 and 8.4 GHz (in at least two X-ray bands) giving a
measured spectral (photon) index. Thus, the filled stars show
objects with complete measurements. Where one band is a defined
limit, an arrow shows the resulting direction of uncertainty in the
luminosity. Open triangles show sources where the spectral or
photon index has been estimated as described in Sects. 2.1.1
and 2.2. The error bars were derived as described in
Sect. 4 which also describes the method for
estimating spectral (photon) indices where a source was only
detected in one band in the radio (X-ray) regime; such sources are
shown by open triangles pointing up (down).
Sources with a given rest-frame luminosity can
be detected at higher redshifts if they have steeper spectra, implying
that the sample might be biased towards radio starbursts with
low-obscuration X-ray counterparts. The red lines in Fig. 5 show the limits of
detectability by the MERLIN+VLA and Chandra observations
described in Sect. 2 for the two arbitrary combinations of
![]() and
and ![]() .
The lines are
marked with the redshifts out to which a source would be detectable
for the combination of luminosities at that point and the
spectral/photon index combination for that line. This shows that
X-ray sources at
.
The lines are
marked with the redshifts out to which a source would be detectable
for the combination of luminosities at that point and the
spectral/photon index combination for that line. This shows that
X-ray sources at ![]() need to
have
need to
have
![]() W (i.e. in the AGN regime) to be
detectable if they have harder photon indices.
W (i.e. in the AGN regime) to be
detectable if they have harder photon indices.
![\begin{figure}
\par\includegraphics[width=10.8cm,clip]{7598f6.ps} \end{figure}](/articles/aa/full/2007/36/aa7598-07/img116.gif) |
Figure 6:
X-ray luminosity as a function of radio luminosity for all
57 radio sources with X-ray counterparts and measured
redshifts, classified as shown in the key (the squares
enclosing stars are the three starbursts with apparent
radio AGN cores; the lowest luminosity one is at
z<1.3). The X-ray luminosity limit for AGN,
|
| Open with DEXTER | |
Figure 6 shows that there is a correlation between
![]() and
and
![]() at lower luminosities but there
is a very large scatter at
at lower luminosities but there
is a very large scatter at
![]() W, in particular
for sources at
W, in particular
for sources at ![]() .
We investigated this by
looking for power-law relationships between
.
We investigated this by
looking for power-law relationships between
![]() and
and
![]() expressed as
expressed as
| (15) |
We obtained values of
![]() (very low significance) for
most data selections including all those based on radio-selected AGN.
The 10 radio-selected starbursts hosting X-ray-selected
type-II AGN gave the most significant result, with
(very low significance) for
most data selections including all those based on radio-selected AGN.
The 10 radio-selected starbursts hosting X-ray-selected
type-II AGN gave the most significant result, with
![]()
We obtained
![]() for low-luminosity, low-redshift
starbursts, e.g. z < 1.3,
for low-luminosity, low-redshift
starbursts, e.g. z < 1.3,
![]() W (17 sources) gives
W (17 sources) gives
Barger et al. (2007) dispute the existence of the radio-X-ray luminosity
relationship, as applied to high-redshift samples including the
HDF(N), suggesting that it is a selection effect. We cannot compare
this directly with our weak correlation given in
Eqs. (16) and (17) since about half of our
radio starbursts with obscured X-ray AGN and a third of low-X-ray
luminosity starbursts have
![]() less than their cutoff of
60
less than their cutoff of
60 ![]() Jy, and our criteria for starburst classification is more
specific to the origins of the radio emission than is their optical
method. The significant point for both this paper and
Barger et al. (2007) is that although a high proportion of high-redshift
star-forming sources detected in the radio are also detected in
X-rays, their luminosities are weakly correlated or uncorrelated,
suggesting that the X-ray emission is of non-starburst origin.
Jy, and our criteria for starburst classification is more
specific to the origins of the radio emission than is their optical
method. The significant point for both this paper and
Barger et al. (2007) is that although a high proportion of high-redshift
star-forming sources detected in the radio are also detected in
X-rays, their luminosities are weakly correlated or uncorrelated,
suggesting that the X-ray emission is of non-starburst origin.
Figure 6 also shows that 2 out of 4 radio AGN with
![]() W lie close to the starburst-based
relationships and the other 2 are under-luminous in X-rays (although
one of these, the source with the lowest value of
W lie close to the starburst-based
relationships and the other 2 are under-luminous in X-rays (although
one of these, the source with the lowest value of
![]() ,
is the FR 1 J123644+621133, the only
radio-X-ray crossmatched source to have jet-dominated radio emission).
Conversely, only one each of a radio starburst and an unclassified
source are present with z>1.3 and
,
is the FR 1 J123644+621133, the only
radio-X-ray crossmatched source to have jet-dominated radio emission).
Conversely, only one each of a radio starburst and an unclassified
source are present with z>1.3 and
![]() W
although as shown by Fig. 5, such a source detected in
one regime would also be detected in the other out to
W
although as shown by Fig. 5, such a source detected in
one regime would also be detected in the other out to ![]() for a
typical starburst spectral index.
for a
typical starburst spectral index.
We emphasise that the significance of quantitative luminosity
relationships is low for samples drawn exclusively from the HDF(N)
data. The presence of X-ray and radio emission appears to be
correlated (Sect. 2.5), but not the precise luminosities,
whether starbursts or any other classes of objects are studied. The
clear correlation between
![]() and
and
![]() found
for samples dominated by lower-redshift sources does not apply to the
high-redshift, high-luminosity sources. We already noted (in
Sect. 2.5) that the nature of the overlap between radio and
X-ray detections changes around
found
for samples dominated by lower-redshift sources does not apply to the
high-redshift, high-luminosity sources. We already noted (in
Sect. 2.5) that the nature of the overlap between radio and
X-ray detections changes around ![]() ,
which supports our
contention that
the relationship between radio- and X-ray-emission mechanisms changes
dramatically around
z=1.1-1.3.
,
which supports our
contention that
the relationship between radio- and X-ray-emission mechanisms changes
dramatically around
z=1.1-1.3.
![\begin{figure}
\par\includegraphics[width=11cm,clip]{7598f7.ps} \end{figure}](/articles/aa/full/2007/36/aa7598-07/img136.gif) |
Figure 7:
The symbols, dividing line at
|
| Open with DEXTER | |
The values of
![]() given in Table 2, derived
using Eq. (11) in Sect. 4.2, do not take into
account corrections for absorption nor for the intrinsic photon
index. Padovani et al. (2004) derived the rest-frame X-ray luminosities
for candidate type-2 AGN using the observed hard-band flux densities
and assuming an intrinsic
given in Table 2, derived
using Eq. (11) in Sect. 4.2, do not take into
account corrections for absorption nor for the intrinsic photon
index. Padovani et al. (2004) derived the rest-frame X-ray luminosities
for candidate type-2 AGN using the observed hard-band flux densities
and assuming an intrinsic
![]() .
We follow this method to
calculate
.
We follow this method to
calculate
![]() for all the cross-matched sources with
published redshifts, shown as the arrow ends in Fig. 7.
We looked for relationships between
for all the cross-matched sources with
published redshifts, shown as the arrow ends in Fig. 7.
We looked for relationships between
![]() and
and
![]() using a method similar to that described in
Sect. 6.1 but btained results of even lower significance.
using a method similar to that described in
Sect. 6.1 but btained results of even lower significance.
Figure 7 shows that all the type-2 AGN have
![]() ,
as expected, and that the difference
is greater for the more radio-luminous sources. All sources with
arrow tips above the blue horizontal line have
,
as expected, and that the difference
is greater for the more radio-luminous sources. All sources with
arrow tips above the blue horizontal line have
![]() W,
indicating the presence of an X-ray AGN (Alexander et al. 2003a; Cowie et al. 2004a).
W,
indicating the presence of an X-ray AGN (Alexander et al. 2003a; Cowie et al. 2004a).
We used Eq. (1) to predict the full-band X-ray luminosity
of starburst origin,
![]() ,
assuming that
,
assuming that
![]() was entirely due to starburst activity.
was entirely due to starburst activity.
![]() is an overestimate where a significant fraction of
radio emission is of AGN origin, although J123642+621331 is the only
powerful starburst where over half the radio emission is AGN-powered
(Sect. 5.1). As it has been shown empirically
(e.g. Ranalli et al. 2003) that hard- and soft-band X-ray emission of
starburst origin have similar dependencies in the relationships with
emission of common origin in other regimes, the difference between the
measured hard-band luminosity and
is an overestimate where a significant fraction of
radio emission is of AGN origin, although J123642+621331 is the only
powerful starburst where over half the radio emission is AGN-powered
(Sect. 5.1). As it has been shown empirically
(e.g. Ranalli et al. 2003) that hard- and soft-band X-ray emission of
starburst origin have similar dependencies in the relationships with
emission of common origin in other regimes, the difference between the
measured hard-band luminosity and
![]() can thus be
regarded as a lower limit to the X-ray luminosity of non-starburst origin. We
find that
can thus be
regarded as a lower limit to the X-ray luminosity of non-starburst origin. We
find that
![]() exceeds 1035 W
for all 17 type-2 AGN identified by Padovani et al. (2004), including the
10 radio starbursts, with a mean difference of
exceeds 1035 W
for all 17 type-2 AGN identified by Padovani et al. (2004), including the
10 radio starbursts, with a mean difference of ![]() 3.9
3.9 ![]() 1036 W
(much greater than the total uncertainties) for either sub-sample. We
interpret this as confirming that these galaxies must contain AGN,
since the excess X-ray power,
1036 W
(much greater than the total uncertainties) for either sub-sample. We
interpret this as confirming that these galaxies must contain AGN,
since the excess X-ray power, ![]() 1035 W, is very unlikely to be be
explained by any other mechanism. These values also suggest that, on
average,
1035 W, is very unlikely to be be
explained by any other mechanism. These values also suggest that, on
average, ![]() 1/3 of X-ray emission from obscured type-2 AGN is of
starburst origin. All the radio starbursts with type-2 AGN remain
sufficiently X-ray-bright to meet the AGN selection criteria, even
using the lower luminosity limit derived here.
1/3 of X-ray emission from obscured type-2 AGN is of
starburst origin. All the radio starbursts with type-2 AGN remain
sufficiently X-ray-bright to meet the AGN selection criteria, even
using the lower luminosity limit derived here.
![]() is lower, at
is lower, at
![]() 1.6
1.6 ![]() 1036 W and
1036 W and ![]() 2.8
2.8 ![]() 1034 W for all
radio-selected AGN and all starbursts respectively. Starbursts
without type-II AGN show a very large scatter in the difference, about
a mean of
1034 W for all
radio-selected AGN and all starbursts respectively. Starbursts
without type-II AGN show a very large scatter in the difference, about
a mean of ![]() -2.1
-2.1 ![]() 1036 W, showing that any AGN
contribution is negligible in the majority of "pure'' starbursts.
1036 W, showing that any AGN
contribution is negligible in the majority of "pure'' starbursts.
Radio starbursts hosting type-2 AGN dominate the radio detections at high redshift, illustrated in Fig. 2. The 10-arcmin field contains 64 X-ray selected type-II AGN (as defined in Sect. 5.2), plus the candidate type-II AGN J123642+621331 (Sects. 5.3 and 6.1). Eighteen of these have radio-bright counterparts (none are among the additional 7 8.4-GHz selected sources). 18/64 is a similar proportion to the quarter of all X-ray sources in the 10-arcmin field which are type-II AGN candidates. Nine out of the 11 radio-bright X-ray sources at z>1.3 host type-II AGN and this includes 8 out of the 9 radio starbursts in this redshift range.
Figure 4 and Table 1 show that the majority of the X-ray selected type-II AGN with radio counterparts are associated with starbursts (classified using the criteria in Sect. 5.1). The breakdown by radio source type, redshift and luminosity is shown in more detail in Figs. 8 and 9. The 3 radio starbursts (J123635+621424, J123642+621331 and J123642+621545) which also show signs of containing radio AGN (Sect. 5.1) are only shown once, as starbursts. J123635+621424, and probably J123642+621331, are also X-ray selected type-II AGN.
Radio AGN outnumber starbursts 2:1 in the most powerful third
(
![]()
![]() Jy) of all 92 radio-bright sources whilst
starbursts are an even greater majority among the fainter sources.
The radio-selected AGN are on average intrinsically more
radio-luminous than the starbursts. The median redshift of all radio
AGN is higher compared with all starbursts in the HDF(N) and they
appear to be separate populations (Muxlow et al. 2005). The high redshift
radio-selected starbursts associated with obscured X-ray selected AGN
appear to be a third class, distinct from the radio-bright AGN and
from the majority of the starbursts.
Jy) of all 92 radio-bright sources whilst
starbursts are an even greater majority among the fainter sources.
The radio-selected AGN are on average intrinsically more
radio-luminous than the starbursts. The median redshift of all radio
AGN is higher compared with all starbursts in the HDF(N) and they
appear to be separate populations (Muxlow et al. 2005). The high redshift
radio-selected starbursts associated with obscured X-ray selected AGN
appear to be a third class, distinct from the radio-bright AGN and
from the majority of the starbursts.
Figure 10 shows a
remarkable segregation between high-![]() ,
low-z, sources of all
classes but without type-II AGN, and low-
,
low-z, sources of all
classes but without type-II AGN, and low-![]() sources. Of the
latter, the radio starbursts and unclassified sources with type-II AGN
(including the candidate J123642+621331) show a slight correlation
between
sources. Of the
latter, the radio starbursts and unclassified sources with type-II AGN
(including the candidate J123642+621331) show a slight correlation
between ![]() and z, consistent with the change in X-ray spectral
slope expected for highly obscured sources at higher rest-frame
energies (Sect. 5.2). The blue
and z, consistent with the change in X-ray spectral
slope expected for highly obscured sources at higher rest-frame
energies (Sect. 5.2). The blue ![]() line is a very
rough estimate of the change in the observed
line is a very
rough estimate of the change in the observed ![]() with increasing
redshift, for a rest-frame
with increasing
redshift, for a rest-frame ![]() ,
based on the spectral models
shown in Alexander et al. (2005a), their Fig. 7, for sources with
,
based on the spectral models
shown in Alexander et al. (2005a), their Fig. 7, for sources with
![]()
![]() 1027 m-2. All but 3 out of 16 sources with a
1027 m-2. All but 3 out of 16 sources with a ![]() below the estimated
below the estimated ![]() line contain
type-II AGN and the majority are radio starbursts; the only
radio-bright AGN here is not a type-II AGN.
line contain
type-II AGN and the majority are radio starbursts; the only
radio-bright AGN here is not a type-II AGN.
The 4 radio-bright AGN with X-ray type-II AGN all lie above this line, suggesting that they do not reach the highest degrees of obscuration. The segregation is not due to Compton-thick absorption as signs of this are only seen in one source, J123622+621629, a radio starburst hosting a type-II AGN, (Alexander et al. 2003b).
![\begin{figure}
\par\includegraphics[width=8cm,clip]{7598f8.eps} \end{figure}](/articles/aa/full/2007/36/aa7598-07/img145.gif) |
Figure 8: Redshift distribution of radio/X-ray sources according to radio classification and counterparts. In each panel the dashed grey line shows the distribution of sources which have X-ray type-II AGN signatures (including J123642+121331, Sect. 5.3) and the solid line shows their counterparts in the sub-sample. The filled area shows the total number of sources with radio properties which are a) unclassified, b) AGN-like or c) starburst-like; panel d) shows radio sources with SCUBA counterparts. (This figure is available in color in electronic form.) |
| Open with DEXTER | |
![\begin{figure}
\par\includegraphics[width=8cm,clip]{7598f9.eps} \end{figure}](/articles/aa/full/2007/36/aa7598-07/img146.gif) |
Figure 9: Radio luminosity distribution of radio/X-ray sources according to radio classification and counterparts, see Fig. 8 for more details. (This figure is available in color in electronic form.) |
| Open with DEXTER | |
Although all but 2 of the radio AGN with measured redshifts are detected by Chandra, the non-detections are the highest-redshift sources; in contrast, all the starbursts known to have z>1.3 have X-ray counterparts. Figures 8 and 9 (panels a and b) show that the distributions of X-ray selected type-II AGN are biased towards much higher redshifts and luminosities than the distributions of radio-classified AGN or unclassified radio sources. The population of type-II AGN does overlap closely the high redshift/high luminosity end of the distribution of radio-selected starbursts (panel c).
There are strong similarities between the redshift distributions of
the radio SMGs and type-II AGN (Figs. 8
and 9, panel d), especially at
higher z. 20% of all radio-bright galaxies detected by
Chandra are also SCUBA
sources (Sect. 2.4.2) and nearly half of
these contain type-II AGN. We noted a
low correlation between
![]() and
and
![]() for
high-redshift starbursts (Sect. 6.1); a similar large scatter was
seen by Borys et al. (2004) for a SCUBA-selected subsample of 10 sources.
for
high-redshift starbursts (Sect. 6.1); a similar large scatter was
seen by Borys et al. (2004) for a SCUBA-selected subsample of 10 sources.
Alexander et al. (2005a) calculated the radio and X-ray luminosities for
all SMG with spectroscopic redshifts, in the overlap between the
Chandra and VLA fields of view. All except one have X-ray luminosities in excess of the
relationship predicted from star formation, by over an order of
magnitude in the case of the type-II AGN candidates
(as we also found in Sect. 6.2). The X-ray selected
type-II AGN also have an FIR/X-ray luminosity ratio about an order of magnitude greater than the
typical ratio for nearby QSO, showing that at least 90% of the FIR emission is probably of starburst origin, at an SFR of order 1000 ![]() yr-1.
yr-1.
The starburst interpretation of sub-mm emission from SMG which are hard X-ray sources is only questionable if they possess nuclear dust to much greater optical depths than is seen around local AGN (Sect. 1; Alexander et al. 2005a). We summarise the evidence that these objects do contain extended starbursts which are distinct from any AGN cores.
The radio starburst classification is based on distinctive morphology
and spectral index (Sect. 5.1; Muxlow et al. 2005). The
median angular size of radio-bright AGN with X-ray counterparts is
![]() 0
0
![]() 6 whilst for starbursts it is
6 whilst for starbursts it is ![]() 1
1
![]() 4
(Table 1; Fig. 4). SCUBA galaxies which are
most extended in the radio are also more likely to be X-ray bright; of
the 12 SMG radio sources studied by Chapman et al. (2004b), the 6 with the
largest 1.4-GHz angular sizes all had X-ray counterparts but only 2
of the 4 smallest radio sources had X-ray counterparts.
4
(Table 1; Fig. 4). SCUBA galaxies which are
most extended in the radio are also more likely to be X-ray bright; of
the 12 SMG radio sources studied by Chapman et al. (2004b), the 6 with the
largest 1.4-GHz angular sizes all had X-ray counterparts but only 2
of the 4 smallest radio sources had X-ray counterparts.
X-ray emission from many of the the starburst galaxies would,
however, be resolved, if it had a common origin with the radio
emission, which is not seen - all 55 X-ray sources are smaller
than the 1
![]() Chandra FWHM in this region.
Chandra FWHM in this region.
Nine out of the 10 radio-bright X-ray sources which are
also SMG are radio starbursts with
![]() (including 7 with
type-II AGN) and the tenth is unclassified. The
mean radio angular size is 1
(including 7 with
type-II AGN) and the tenth is unclassified. The
mean radio angular size is 1
![]() 3 and only J123635+621424, a
starburst with a radio AGN core, is smaller than 0
3 and only J123635+621424, a
starburst with a radio AGN core, is smaller than 0
![]() 6.
Chapman et al. (2004b) found a similar result, obtaining a typical extent
of 1
6.
Chapman et al. (2004b) found a similar result, obtaining a typical extent
of 1
![]() for the radio counterparts to a sample of dozen SMGs.
Pope et al. (2005) found that the the optical ACS counterparts of
SMG at z<2 in the HDF(N) have radii in the range
for the radio counterparts to a sample of dozen SMGs.
Pope et al. (2005) found that the the optical ACS counterparts of
SMG at z<2 in the HDF(N) have radii in the range ![]() 1
1
![]() -
-![]() 2
2
![]() 5, which is significantly larger than field galaxies at
the same redshift.
Similarly, more distant (
5, which is significantly larger than field galaxies at
the same redshift.
Similarly, more distant (
![]() ), highly reddened galaxies with SEDs
consistent with vigorous star formation are typically over twice the
size of non-starformers in HST NICMOS images of the HDF(S)
(Zirm et al. 2007).
), highly reddened galaxies with SEDs
consistent with vigorous star formation are typically over twice the
size of non-starformers in HST NICMOS images of the HDF(S)
(Zirm et al. 2007).
We conclude that, although present instruments cannot resolve MIR or sub-mm sources on the scale of radio or optical emission with starburst characteristics, the close association supports a common origin. In contrast, X-ray emission from the same sources is consistently more compact than the radio emission and appears to have a distinctly different origin.
![\begin{figure}
\par\includegraphics[angle=-90,width=8.15cm,clip]{7598f10.ps} \end{figure}](/articles/aa/full/2007/36/aa7598-07/img149.gif) |
Figure 10:
X-ray photon index as a function of redshift for radio
starbursts (stars), AGN (squares) and unclassified sources
(circles). All photon indices are fully measured or are
partly measured upper or lower limits (see
Sect. 4.2). X-ray selected type-II AGN are labelled
A. The blue line shows a rough
extrapolation of an observed-frame photon index
|
| Open with DEXTER | |
At high redshifts, the present generation of radio and X-ray surveys
are biased towards extreme objects, as whatever was "normal'' at
![]() is below the threshold for secure detections of individual
sources. In advance of e-MERLIN, the EVLA and XEUS, stacking
is the only method to investigate the radio and X-ray properties of
objects at z > 1 with
is below the threshold for secure detections of individual
sources. In advance of e-MERLIN, the EVLA and XEUS, stacking
is the only method to investigate the radio and X-ray properties of
objects at z > 1 with
![]() W Hz-1 or
W Hz-1 or
![]() W. Muxlow et al. (2005) demonstrated the
existence of such a radio population by finding a statistical excess
of 1-6
W. Muxlow et al. (2005) demonstrated the
existence of such a radio population by finding a statistical excess
of 1-6![]() radio flux on arcsec scales at the positions of ISO sources and of optical (HST WFPC2) galaxies with I
radio flux on arcsec scales at the positions of ISO sources and of optical (HST WFPC2) galaxies with I ![]() 24 mag in the 3-arcmin field. The MERLIN+VLA images are more
than twice as sensitive as the VLA-only data but no new sources were
detected in the 3-arcmin field between 27-40
24 mag in the 3-arcmin field. The MERLIN+VLA images are more
than twice as sensitive as the VLA-only data but no new sources were
detected in the 3-arcmin field between 27-40 ![]() Jy, suggesting that
any objects just below the VLA completeness limit are extended over
Jy, suggesting that
any objects just below the VLA completeness limit are extended over
![]() 2
2
![]() with no hotspots. Garrett et al. (2000) showed that about
10% of radio sources in the HDF(N) are probably resolved out even at
2
with no hotspots. Garrett et al. (2000) showed that about
10% of radio sources in the HDF(N) are probably resolved out even at
2
![]() resolution so even stacking MERLIN+VLA data will not
recover these.
resolution so even stacking MERLIN+VLA data will not
recover these.
We analyse the excess radio flux at the positions of Chandra
sources in the recently-made 8-arcmin radio image convolved with a
restoring beam of 0
![]() 4 (see Sect. 3.2). Muxlow et al. (2006)
and Beswick et al. (2006) present similar analyses at the
positions of ACS and Spitzer sources.
4 (see Sect. 3.2). Muxlow et al. (2006)
and Beswick et al. (2006) present similar analyses at the
positions of ACS and Spitzer sources.
181 X-ray sources from the catalogue of Alexander et al. (2003b) lie within
the 8-arcmin MERLIN+VLA 1.4-GHz image. We used
the matching criteria described in Sect. 2.2 to divide the
X-ray sources into 39 sources with radio counterparts brighter than
40 ![]() Jy ("radio-bright''), and 142 without ("radio-faint''). For
each sample, we stacked the 1.4-GHz radio flux density enclosed by 0
Jy ("radio-bright''), and 142 without ("radio-faint''). For
each sample, we stacked the 1.4-GHz radio flux density enclosed by 0
![]() 25 to
2
25 to
2
![]() radius circles centred on the X-ray source positions. We
constructed control samples by stacking the radio flux at positions
offset by 10
radius circles centred on the X-ray source positions. We
constructed control samples by stacking the radio flux at positions
offset by 10
![]() from each X-ray source (checking that these did
not coincide with known X-ray or radio sources or their sidelobes).
The noise distribution is slightly
non-Gaussian due to confusing sources in the sidelobes of the
heterogeneous primary beams but there are no
artifacts >
from each X-ray source (checking that these did
not coincide with known X-ray or radio sources or their sidelobes).
The noise distribution is slightly
non-Gaussian due to confusing sources in the sidelobes of the
heterogeneous primary beams but there are no
artifacts >![]() (
(![]() 27
27 ![]() Jy per 0
Jy per 0
![]() 2-0
2-0
![]() 5 beam) apart from sidelobes very close to the 3 sources brighter than 1 mJy, J123644+621133, J123714+620823 and J123725+621128
(Muxlow et al. 2005). The average stacked flux density from
the radio-faint sources increased up for radii up to
5 beam) apart from sidelobes very close to the 3 sources brighter than 1 mJy, J123644+621133, J123714+620823 and J123725+621128
(Muxlow et al. 2005). The average stacked flux density from
the radio-faint sources increased up for radii up to ![]() 1
1
![]() and levelled off for higher radii, so we report results for 1
and levelled off for higher radii, so we report results for 1
![]() radii. The variance in each bin is 3-4
radii. The variance in each bin is 3-4 ![]() Jy
(the radio map
Jy
(the radio map ![]() level) and the control samples for the
radio-faint sources are all <
level) and the control samples for the
radio-faint sources are all <![]() .
.
![\begin{figure}
\par\includegraphics[angle=-90,width=8.15cm,clip]{7598f11.ps} \end{figure}](/articles/aa/full/2007/36/aa7598-07/img157.gif) |
Figure 11:
The heavy symbols in the upper and lower panes show the
binned 1.4-GHz flux densities at the positions of radio-faint and
-bright X-ray sources, respectively. This was measured
separately for 4 X-ray bands, see key. The ordinate
axis shows the median X-ray flux in each bin for each
band. The faint hollow symbols show the binned 1.4-GHz flux
densities for
control samples at 10
|
| Open with DEXTER | |
The stacking intervals were sorted by X-ray flux density, photon index and redshift, into bins containing almost equal numbers of measurements. In each of Figs. 11 and 12 the scale on the abscissa shows the median value in each bin.
We present results for stacking sorted by full, soft, hard and very hard (4-8 keV) band flux density. We plot the relationship between the mean stacked radio flux density and the X-ray flux density in each of 5 bins with 28 or 29 (7 or 8) samples in each bin for the radio-faint (-bright) sources. We treated upper limits as values; hence the nominal value for the bottom bin may be greater than the true median X-ray flux but it does not affect the significance of the results. The filled symbols in Fig. 11, upper panel, show the stacked radio flux at the X-ray positions of radio-faint sources (see key) and the hollow symbols show the corresponding control values. This shows that the mean stacked radio flux density is significantly above the control for all bins apart from the faintest very hard band bin. The average radio flux density is similar for any soft-band X-ray flux density, but becomes increasingly correlated with X-ray flux density for the hard and very hard bands. Figure 11, lower panel, shows that there is no correlation with any band for radio-bright sources (the four high values are biased by one very bright radio source), as discussed in Sect. 6.
84 (29) radio-faint (-bright) X-ray sources have at least partly
measured photon indices (![]() )
(i.e. detected in at least one
sub-band as well as full band). We plot the mean stacked radio flux
density against the X-ray photon index in each of 4 bins
evenly spaced in
)
(i.e. detected in at least one
sub-band as well as full band). We plot the mean stacked radio flux
density against the X-ray photon index in each of 4 bins
evenly spaced in ![]() ,
which gives similar source counts in each
bin. Figure 12 shows that radio-faint X-ray
sources (heavy circles) with
,
which gives similar source counts in each
bin. Figure 12 shows that radio-faint X-ray
sources (heavy circles) with
![]() have a mean radio flux
density twice that for
sources with
have a mean radio flux
density twice that for
sources with
![]() .
This is not the case for the radio-bright
sources (heavy triangles).
.
This is not the case for the radio-bright
sources (heavy triangles).
76 (35) radio-faint (-bright) X-ray sources have measured redshifts. In each case we divided them into 4 bins with approximately equal numbers of samples in each bin. There is no obvious correlation for either sample.
![\begin{figure}
\par\includegraphics[angle=-90,width=7.9cm,clip]{7598f12.ps} \end{figure}](/articles/aa/full/2007/36/aa7598-07/img159.gif) |
Figure 12:
The heavy circles and triangles show the
binned 1.4-GHz flux densities at the positions of radio-faint and
-bright X-ray sources, respectively. The ordinate
axis shows the median X-ray photon index in each bin for each
band. The faint hollow symbols show the binned 1.4-GHz flux
densities for
control samples at 10
|
| Open with DEXTER | |
There is a significant excess of radio flux at the positions of Chandra sources without formally identified radio counterparts.
These have typical 1.4-GHz flux densities from ![]() 20-40
20-40 ![]() Jy
per 1
Jy
per 1
![]() -radius circle (
-radius circle (![]() 6-13
6-13 ![]() Jy arcsec-2).
This is the median largest angular size
of radio sources above 40
Jy arcsec-2).
This is the median largest angular size
of radio sources above 40 ![]() Jy (Muxlow et al. 2005) and is three
times the median Chandra position error for the sources within
the 8-arcmin field (Sect. 2.2).
Jy (Muxlow et al. 2005) and is three
times the median Chandra position error for the sources within
the 8-arcmin field (Sect. 2.2).
The most obvious correlations for radio-quiet sources are the
association of a higher average radio flux density with a higher
X-ray flux density in the full or harder bands, and with a lower ![]() .
The average radio flux density approaches 40
.
The average radio flux density approaches 40 ![]() Jy for
radio-quiet X-ray sources with flux densities >10-18 W m-2 Hz-1 or with hard photon indices, suggesting that the majority
of these (probably obscured) X-ray sources have genuine radio
counterparts. We examined the radio-quiet images at the position of
each Chandra source by plotting contours at 3, 4, 5 and 6
Jy for
radio-quiet X-ray sources with flux densities >10-18 W m-2 Hz-1 or with hard photon indices, suggesting that the majority
of these (probably obscured) X-ray sources have genuine radio
counterparts. We examined the radio-quiet images at the position of
each Chandra source by plotting contours at 3, 4, 5 and 6![]()
![]() Eleven sources are >20
Eleven sources are >20 ![]() Jy (5
Jy (5![]() ). Their apparently extended radio flux and the
absence of hotspots brighter than 27
). Their apparently extended radio flux and the
absence of hotspots brighter than 27 ![]() Jy per 0
Jy per 0
![]() 4 beam,
corresponding to maximum brightness temperatures of less than a few
100 K, suggests that these sources are part of the radio starburst
population and do not contain radio-bright AGN. Seven of the
corresponding X-ray objects have a measured photon index of which 5
have
4 beam,
corresponding to maximum brightness temperatures of less than a few
100 K, suggests that these sources are part of the radio starburst
population and do not contain radio-bright AGN. Seven of the
corresponding X-ray objects have a measured photon index of which 5
have ![]() and 4 are listed as type-II AGN by
Padovani et al. (2004). A similar proportion (40%) of all 142 radio-faint Chandra sources have low, measured photon indices characteristic of obscured AGN.
and 4 are listed as type-II AGN by
Padovani et al. (2004). A similar proportion (40%) of all 142 radio-faint Chandra sources have low, measured photon indices characteristic of obscured AGN.
The stacked-average photon index for the whole
Chandra HDF(N) field becomes flatter for lower X-ray count
rates and then slightly steepens again
(Alexander et al. 2003b). The composite X-ray spectra of the most
obscured Chandra sources (
![]()
![]() 1027 m-2) show an upturn at rest frame energies <4 keV, attributed
to star formation (Alexander et al. 2005a). This is independent evidence
for the association between obscured AGN and starburst activity.
1027 m-2) show an upturn at rest frame energies <4 keV, attributed
to star formation (Alexander et al. 2005a). This is independent evidence
for the association between obscured AGN and starburst activity.
X-ray sources associated with individual galaxies in the 8-arcmin
field are smaller than the ![]() 1
1
![]() resolution of
Chandra, and none are among the extended emission sources
identified by
Bauer et al. (2002a). About 20% (29/142) of the radio-faint X-ray
sources have
resolution of
Chandra, and none are among the extended emission sources
identified by
Bauer et al. (2002a). About 20% (29/142) of the radio-faint X-ray
sources have
![]()
![]() 10-18 and
10-18 and
![]() .
Equation (1) predicts a radio flux density >40
.
Equation (1) predicts a radio flux density >40 ![]() Jy from
such sources if the X-ray emission is of starburst origin, so they
would have been detected as radio-bright if the radio and X-ray
emission had a common starburst origin. Instead, it is likely that these
radio-quiet sources contain unobscured X-ray AGN.
Jy from
such sources if the X-ray emission is of starburst origin, so they
would have been detected as radio-bright if the radio and X-ray
emission had a common starburst origin. Instead, it is likely that these
radio-quiet sources contain unobscured X-ray AGN.
Almost all the remaining 40% of the radio-faint sources, with
![]()
![]() 10-18, do not have measured photon
indices
(Bauer et al. 2004). Reddy & Steidel (2004) stacked Chandra soft-band and
VLA-only radio HDF(N) flux densities for (rest-frame) UV-selected
objects at a mean redshift of
10-18, do not have measured photon
indices
(Bauer et al. 2004). Reddy & Steidel (2004) stacked Chandra soft-band and
VLA-only radio HDF(N) flux densities for (rest-frame) UV-selected
objects at a mean redshift of ![]() 2. Their measurements were
consistent with the relationship found by Bauer et al. (2002b), giving an
average SFR of
2. Their measurements were
consistent with the relationship found by Bauer et al. (2002b), giving an
average SFR of ![]()
![]() yr-1. Stacking Chandra
data for Lyman Break galaxies out to z=6, gave similar results. Their
selection criteria (optical detection, soft-band dominated) excluded
objects like the SMGs and the most vigorous radio starbursts
associated with type-II AGN, so these sources are probably analogues
of the local ULIRGs.
yr-1. Stacking Chandra
data for Lyman Break galaxies out to z=6, gave similar results. Their
selection criteria (optical detection, soft-band dominated) excluded
objects like the SMGs and the most vigorous radio starbursts
associated with type-II AGN, so these sources are probably analogues
of the local ULIRGs.
In Sect. 2.5 we used the Kolmogorov-Smirnov test to show that
there seemed to be a change in the relationship between radio and
X-ray sources at redshifts above and below ![]() 1.1. We also found
(Sect. 6.1) a starburst-like relationship between
1.1. We also found
(Sect. 6.1) a starburst-like relationship between
![]() and
and
![]() for most low-redshift sources,
but only very weak relationships at high redshift, most significant
for the radio starbursts hosting type-II AGN. The correlation between
radio-faint radio flux density and harder X-ray emission seen in
Fig. 11 (upper) is consistent with a continuation
of this relationship for the radio-faint sources. The correlation with
harder photon index is also consistent with type-II AGN powering the
the dominant population of distant X-ray sources with radio
counterparts of a few tens of
for most low-redshift sources,
but only very weak relationships at high redshift, most significant
for the radio starbursts hosting type-II AGN. The correlation between
radio-faint radio flux density and harder X-ray emission seen in
Fig. 11 (upper) is consistent with a continuation
of this relationship for the radio-faint sources. The correlation with
harder photon index is also consistent with type-II AGN powering the
the dominant population of distant X-ray sources with radio
counterparts of a few tens of ![]() Jy.
Jy.
In summary, we predict that future instruments will confirm that the
association between the presence of X-ray and radio emission extends
to radio flux densities ![]() 10
10 ![]() Jy arcsec-2. The available
evidence suggests that two fifths of these sources will be found to
be radio starbursts hosting obscured X-ray AGN, probably at high
redshifts, one fifth are radio-quiet, unobscured AGN and the
remainder are probably ULIRGs.
Jy arcsec-2. The available
evidence suggests that two fifths of these sources will be found to
be radio starbursts hosting obscured X-ray AGN, probably at high
redshifts, one fifth are radio-quiet, unobscured AGN and the
remainder are probably ULIRGs.
We have used Virtual Observatory tools and RadioNet software
to compare the radio and X-ray properties of
galaxies at ![]() in the HDF(N). 92 radio-bright objects (
in the HDF(N). 92 radio-bright objects (
![]()
![]() Jy) are resolved by
MERLIN+VLA at 1.4 GHz. 55 of these sources are also securely detected
by Chandra and the majority of these sources have
spectral/photon indices based on measurements at more than one
frequency. Where spectral/photon indices are estimated, we have not used
the values as primary diagnostics.
Jy) are resolved by
MERLIN+VLA at 1.4 GHz. 55 of these sources are also securely detected
by Chandra and the majority of these sources have
spectral/photon indices based on measurements at more than one
frequency. Where spectral/photon indices are estimated, we have not used
the values as primary diagnostics.
The combination of radio morphologies and spectral indices, in some cases supported by rest-frame MIR measurements, provides reliable diagnostics for the origins of the radio emission from most of the sources (Sect. 5; Muxlow et al. 2005). 70% of radio starbursts have X-ray counterparts. Radio starbursts outnumber radio AGN by 3:1 for classified sources in the whole radio-bright sample and the same proportion is seen for the 55 sources with X-ray counterparts. Seven unresolved 8.4-GHz sources which are not radio-bright at 1.4 GHz also have X-ray counterparts are not included in most of this analysis, but they appear to contain a similar majority of starbursts. In contrast, the X-ray emission is of AGN origin in about 80% of all Chandra sources (Bauer et al. 2002b).
Optical spectroscopy finds approximately equal numbers of star formers and AGN (Cowie et al. 2004a) and only 6 optically-classified starbursts in the HDF(N) have X-ray counterparts (along with 29 optical AGN). Similarly, only a few percent of the starbursts found using BzK criteria, (Daddi et al. 2004), have soft-X-ray counterparts (Daddi et al. 2005) (hard-X-ray sources were excluded from their sample). These results imply that many radio starbursts which are too obscured to be identified using optical or even NIR spectroscopy and photometry, are a separate population with a much higher proportion of X-ray counterparts.
There is no discernible relationship between either
the radio and X-ray flux densities or the K-corrected luminosities
for the cross-matched sample as a whole.
The close relationship between
![]() and
and
![]() established by Bauer et al. (2002b) breaks down at
established by Bauer et al. (2002b) breaks down at
![]() ,
even if only radio starbursts are considered
(Sect. 6.1). The X-ray emission predicted from the radio
luminosity of these sources is on average less than 1/3 of the
observed X-ray luminosity and even after subtracting the potential
starburst contribution, the hard-band X-ray luminosity of the type-II AGN
still exceeds 1035 W (Sect. 6.2). At least half of the radio
sources with X-ray counterparts have a largest angular size greater
than the Chandra resolution of
,
even if only radio starbursts are considered
(Sect. 6.1). The X-ray emission predicted from the radio
luminosity of these sources is on average less than 1/3 of the
observed X-ray luminosity and even after subtracting the potential
starburst contribution, the hard-band X-ray luminosity of the type-II AGN
still exceeds 1035 W (Sect. 6.2). At least half of the radio
sources with X-ray counterparts have a largest angular size greater
than the Chandra resolution of ![]() 1
1
![]() but all the X-ray
sources are unresolved.
but all the X-ray
sources are unresolved.
The presence of detectable radio emission is significantly correlated
with the probability of also detecting X-rays, and vice versa (Bauer et al. 2002b)
but our results strongly suggest that the radio
and X-ray emission originates from separate phenomena in most sources at
![]() .
.
The fraction of X-ray sources with radio counterparts increases
significantly at ![]() (Fig. 2).
Section 7 sums up the evidence that high-z radio- or
sub-mm-selected starbursts are a separate population from starforming
galaxies at
(Fig. 2).
Section 7 sums up the evidence that high-z radio- or
sub-mm-selected starbursts are a separate population from starforming
galaxies at ![]() and indeed exceed the activity seen in local
ULIRGs (e.g. Sect. 2.4.2, and references therein.)
and indeed exceed the activity seen in local
ULIRGs (e.g. Sect. 2.4.2, and references therein.)
A hard photon index
![]() (at rest-frame 0.5-8 keV) combined
with
(at rest-frame 0.5-8 keV) combined
with
![]() W shows the presence of an obscured type-II AGN
and 18 such objects identified by Padovani et al. (2004) have radio
counterparts in the HDF(N). Model X-ray spectra extending to high
rest-frame energies (Alexander et al. 2005a) suggest that type-II AGN at
W shows the presence of an obscured type-II AGN
and 18 such objects identified by Padovani et al. (2004) have radio
counterparts in the HDF(N). Model X-ray spectra extending to high
rest-frame energies (Alexander et al. 2005a) suggest that type-II AGN at ![]() could have slightly higher
could have slightly higher ![]() as measured by Chandra.
This is supported by the
as measured by Chandra.
This is supported by the
![]() -
-
![]() relationship and
relationship and ![]() -z distribution of type-II AGN with radio
counterparts (Fig. 10) which leads us to propose that
J123642+621331, at z=4.424 with observed
-z distribution of type-II AGN with radio
counterparts (Fig. 10) which leads us to propose that
J123642+621331, at z=4.424 with observed
![]() ,
also contains a type-II AGN. Twelve of the
type-II AGN (including this source) have radio starburst hosts.
,
also contains a type-II AGN. Twelve of the
type-II AGN (including this source) have radio starburst hosts.
The great majority (22/27) of 15 or 16 ![]() m detections among the
radio+X-ray sources are not type-II AGN hosts. They have a mean
redshift of 1 and a mean photon index of 1.6. They appear more
analogous to local ULIRGS than to the more extreme SMGs. Well-studied
ULIRGs such as Arp 220 or Markarian 231 possess nuclear starbursts
which would be barely resolved at the maximum detectable
m detections among the
radio+X-ray sources are not type-II AGN hosts. They have a mean
redshift of 1 and a mean photon index of 1.6. They appear more
analogous to local ULIRGS than to the more extreme SMGs. Well-studied
ULIRGs such as Arp 220 or Markarian 231 possess nuclear starbursts
which would be barely resolved at the maximum detectable ![]() .
Bauer et al. (2004) noted that the relative number counts of starburst and
AGN X-ray sources changed from a large AGN majority over most of the
flux density range sampled by Chandra to a higher proportion of
starbursts among the faintest sources, likely to correspond to the
less active tail of a relatively nearby population. The faintest
.
Bauer et al. (2004) noted that the relative number counts of starburst and
AGN X-ray sources changed from a large AGN majority over most of the
flux density range sampled by Chandra to a higher proportion of
starbursts among the faintest sources, likely to correspond to the
less active tail of a relatively nearby population. The faintest ![]()
![]() of
X-ray sources which are radio-quiet, but have a significant radio flux
density revealed by stacking, (Sect. 8.2), may also be ULIRGs.
of
X-ray sources which are radio-quiet, but have a significant radio flux
density revealed by stacking, (Sect. 8.2), may also be ULIRGs.
In contrast, the SMG counterparts have a mean redshift of 1.8 and an
average photon index of 0.6, suggesting that type-II AGN contribute
substantially more of the X-ray emission. Alexander et al. (2005b) suggest
that between a third and a half of the entire SCUBA source population
contain AGN. 2/3 of radio-bright sources with X-ray and SCUBA emission
contain type-II AGN. About ![]() of the radio-faint sources found by
stacking are associated with hard X-ray sources are probably also
radio starbursts hosting obscured AGN. The radio starbursts appear to
be extended over 2-10 kpc or more, an order of magnitude larger
than those in the local universe. The SMG (at a median redshift of at
least 2.2) have star formation rates of the order of 1000
of the radio-faint sources found by
stacking are associated with hard X-ray sources are probably also
radio starbursts hosting obscured AGN. The radio starbursts appear to
be extended over 2-10 kpc or more, an order of magnitude larger
than those in the local universe. The SMG (at a median redshift of at
least 2.2) have star formation rates of the order of 1000 ![]() yr-1, also about 10 times higher than that of local ULIRGS.
yr-1, also about 10 times higher than that of local ULIRGS.
Both starburst activity and feeding a black hole probably result from
major mergers, which are increasingly common at z > 1.5 and dominate
galaxy growth at z > 2 (Conselice et al. 2005). The comoving luminosity
densities for AGN and for starbursts increases as
![]() for
for
![]() ,
using optical, IR, X-ray and radio classifications and
luminosities (Barger et al. 2005; Cowie et al. 2004a). Current estimates of the
star formation rate as a function of redshift (Hopkins & Beacom 2006)
suggest that the star formation rate continues to increase out to
redshifts of 3 or more. It is possible that sub-mm galaxies at unknown
redshifts may be even more vigorous starbursts at
,
using optical, IR, X-ray and radio classifications and
luminosities (Barger et al. 2005; Cowie et al. 2004a). Current estimates of the
star formation rate as a function of redshift (Hopkins & Beacom 2006)
suggest that the star formation rate continues to increase out to
redshifts of 3 or more. It is possible that sub-mm galaxies at unknown
redshifts may be even more vigorous starbursts at ![]() (Ivison et al. 2007).
(Ivison et al. 2007).
The one radio-bright object in the HDF(N) with a known redshift greater than 3,
J123642+621331 at z=4.424, appears to contain both a (probably
obscured) AGN and a very productive starburst. Stacking 1.4-GHz
emission from radio-faint sources at the position of objects detected
by Chandra shows a statistically significant excess which rises
with decreasing ![]() and with increasing hard-band X-ray flux
densities (Sect. 8.2). Eleven individual radio-faint
counterparts to X-ray sources are >
and with increasing hard-band X-ray flux
densities (Sect. 8.2). Eleven individual radio-faint
counterparts to X-ray sources are >![]() (>20
(>20 ![]() Jy), all of
which appear extended and lacking radio hotspots, consistent with
these sources being a faint or high-redshift tail of the radio
starbursts associated with type-II AGN.
Jy), all of
which appear extended and lacking radio hotspots, consistent with
these sources being a faint or high-redshift tail of the radio
starbursts associated with type-II AGN.
Within the next 2 years, e-MERLIN+EVLA images should reveal
many more high-redshift ![]() Jy galaxies with optical, Spitzer
or SCUBA(2) counterparts, pushing measurements of the star formation
rate (and redshifts) back to
Jy galaxies with optical, Spitzer
or SCUBA(2) counterparts, pushing measurements of the star formation
rate (and redshifts) back to ![]() ,
whilst the ongoing increase in
capacity of the VLBI correlator at JIVE will enable distant compact
radio AGN cores to be distinguished from even sub-kpc-scale starbursts
(Garrett et al. 2005).
,
whilst the ongoing increase in
capacity of the VLBI correlator at JIVE will enable distant compact
radio AGN cores to be distinguished from even sub-kpc-scale starbursts
(Garrett et al. 2005).
Acknowledgements
This work is based in part on observations made with the Multi Element Radio-Linked Interferometer Network (MERLIN), operated by Manchester University on behalf of PPARC, and with the Very Large Array, a facility of the NSF operated under cooperative agreement by Associated Universities, Inc. This work has benefited from research funding from the EC Framework 6 Programme under RadioNet R113CT 2003 5058187. We employed software provided by the UK AstroGrid Virtual Observatory Project, funded by PPARC and the Framework 6 Programme and we also used the VizieR catalogue access tool and the ADS bibliographic service.
We thank the MERLIN and VLA staff for considerable assistance with observations. A.M.S.R. acknowledges the hospitality provided by CDS, where she was a "professeur invité'' during part of this work. We thank P. Padovani (ESO) for helpful discussions and we are extremely grateful to the anonymous referee for improving the accuracy, clarity and consistency of the paper.