A&A 472, 633-642 (2007)
DOI: 10.1051/0004-6361:20077707
D. Tripathi1 - S. K. Solanki2 - H. E. Mason1 - D. F. Webb3
1 - Department of Applied Mathematics and Theoretical
Physics, Wilberforce Road, Cambridge CB3 0WA, UK
2 - Max-Planck-Institut für Sonnensystemforschung, 37191
Katlenburg-Linda, Germany
3 - Institute for Scientific Research, Boston College, Chestnut
Hill, Massachusetts, USA
Received 24 April 2007 / Accepted 2 July 2007
Abstract
Aims. We study the origin and characteristics of a bright coronal downflow seen after a coronal mass ejection associated with erupting prominences on 5 March 2000.
Methods. This study extends that of Tripathi et al. (2006b, A&A, 449, 369) based on the Extreme-ultraviolet Imaging Telescope (EIT), the Soft X-ray Telescope (SXT) and the Large Angle Spectrometric Coronagraph (LASCO) observations. We combined those results with an analysis of the observations taken by the H![]() and the Mk4 coronagraphs at the Mauna Loa Solar Observatory (MLSO). The combined data-set spans a broad range of temperature as well as continuous observations from the solar surface out to 30
and the Mk4 coronagraphs at the Mauna Loa Solar Observatory (MLSO). The combined data-set spans a broad range of temperature as well as continuous observations from the solar surface out to 30 ![]() .
.
Results. The downflow started at around 1.6 ![]() and contained both hot and cold gas. The downflow was observed in the H
and contained both hot and cold gas. The downflow was observed in the H![]() and the Mk4 coronagraphs as well as the EIT and the SXT and was approximately co-spatial and co-temporal providing evidence of multi-thermal plasma. The H
and the Mk4 coronagraphs as well as the EIT and the SXT and was approximately co-spatial and co-temporal providing evidence of multi-thermal plasma. The H![]() and Mk4 images show cusp-shaped structures close to the location where the downflow started. Mk4 observations reveal that the speed of the downflow in the early phase was substantially higher than the free-fall speed, implying a strong downward acceleration near the height at which the downflow started.
and Mk4 images show cusp-shaped structures close to the location where the downflow started. Mk4 observations reveal that the speed of the downflow in the early phase was substantially higher than the free-fall speed, implying a strong downward acceleration near the height at which the downflow started.
Conclusions. The origin of the downflow was likely to have been magnetic reconnection taking place inside the erupting flux rope that led to its bifurcation.
Key words: Sun: corona - Sun: coronal mass ejections (CMEs) - Sun: prominences - Sun: filaments
Observations of coronal downflows in X-rays (McKenzie 2000; McKenzie & Hudson 1999), EUV radiation (Innes et al. 2003a,b; Asai et al. 2004) and in white-light (Sheeley & Wang 2002; Wang et al. 1999) after Coronal Mass Ejections (CMEs) were first detected based on observations made by the Soft X-ray Telescope (SXT; Tsuneta et al. 1991) aboard Yohkoh, the Transition Region and Coronal Explorer (TRACE; Handy et al. 1999) and the Solar Ultraviolet Measurements of Emitted Radiation (SUMER; Wilhelm et al. 1995) spectrometer and the Large Angle Spectrometer Coronagraph (LASCO; Brueckner et al. 1995) aboard the Solar and Heliospheric Observatory (SoHO; Domingo et al. 1995), respectively. These downflows appeared to be dark and were interpreted as plasma voids with high temperature and low density as a consequence of magnetic reconnection following the CME eruptions.
![\begin{figure}
\par\includegraphics[width=7cm,clip]{7707fig1.eps}
\end{figure}](/articles/aa/full/2007/35/aa7707-07/img4.gif) |
Figure 1:
Running difference images taken by EIT at 195 Å on
5 March 2000 showing the bright coronal downflow. In the top
image it is just visible at the top of the panel at
|
| Open with DEXTER | |
Recently, Tripathi et al. (2006b), referred to as "Paper I'' hereinafter, reported a bright coronal downflow after a CME event, which occurred on 5 March 2000. This was the first bright coronal downflow following a CME eruption observed at EUV wavelengths by the Extreme-ultraviolet Imaging Telescope (EIT; Delaboudiniere et al. 1995; Moses et al. 1997) also aboard the SoHO. Based on EIT 304 Å observations de Groof et al. (2004) presented bright coronal downflows in a coronal loop without any associated eruption. The origin of these downflows was explained by numerical simulations of "catastrophic cooling'' in a coronal loop which is heated predominantly at its footpoints (de Groof et al. 2005).
In contrast to the dark downflows following eruption, the bright
downflow indicates a flow of heated plasma, thus providing more direct
evidence of magnetic reconnection during the eruption of CMEs. The
corresponding CME was associated with three erupting
prominences. Based on the analysis of the images obtained by EIT at
195 Å and by SXT, it was speculated that the downflow could indeed
be a consequence of magnetic reconnection, taking place somewhere
outside the field-of-view (FOV) of EIT, but behind the occulter of the
LASCO/C2. Figure 1 displays the running difference
images of the downflow taken by the EIT at 195 Å. The fact that
the downflow started in the gap between the area covered by two
instruments leads to significant uncertainties in the
interpretation. We have therefore searched other databases with the
aim of finding data covering this uncharted region. This event was
fortuitously also recorded by the H![]() coronagraph, the Mk4
coronameter and the He 10 830 Å telescope at Mauna Loa Solar
Observatory
(MLSO
coronagraph, the Mk4
coronameter and the He 10 830 Å telescope at Mauna Loa Solar
Observatory
(MLSO![]() )
in Hawaii. These telescopes nicely fill the gap between the EIT and
the LASCO C2. While MLSO did not catch the eruption phase, it did
provide observations of the downflow.
)
in Hawaii. These telescopes nicely fill the gap between the EIT and
the LASCO C2. While MLSO did not catch the eruption phase, it did
provide observations of the downflow.
Observations of downflows in the majority of erupting prominences were
reported by Gilbert et al. (2000,2001) based on the data taken with HAO's
(High Altitude Observatory) MLSO instruments. According to
Gilbert et al. (2000,2001), in the process of eruption the prominences
break into two parts involving the formation of an X-type neutral line
and magnetic reconnection. The separation seemed to take place at a
height ranging from 1.20 to 1.35 ![]() .
However, there was no
direct evidence for magnetic reconnection and the formation of
an X-type neutral line. Moreover, no attempts were made to compare the
H
.
However, there was no
direct evidence for magnetic reconnection and the formation of
an X-type neutral line. Moreover, no attempts were made to compare the
H![]() observations with data taken by other instruments such as
SoHO/EIT or Yohkoh/SXT.
observations with data taken by other instruments such as
SoHO/EIT or Yohkoh/SXT.
Based on the observations made by the H![]() coronagraph at MLSO,
Gilbert et al. (2001) discussed that, for the flux-rope type of topology,
reconnection could take place either below or within the flux rope
during the eruption. Generally, in "standard 2D models'' it is
considered that the magnetic field lines overlying the flux-rope
reconnect at the current sheet in the wake of expulsion of the
flux-rope (e.g., Lin & Forbes 2000, and references therein). In this
scenario the total expulsion of the flux rope occurs and the flux rope
propagates into the interplanetary medium along with the corresponding
CME. Note that in this scenario the magnetic field lines forming
the flux rope do not take part in reconnection. On the other hand,
the reconnection could also take place "internally'', i.e., within the
flux rope where field lines forming the flux rope take part in
reconnection (Gibson & Fan 2006b; Manchester et al. 2004; Gibson & Fan 2006a), leading to
the bifurcation of the flux rope during eruption.
coronagraph at MLSO,
Gilbert et al. (2001) discussed that, for the flux-rope type of topology,
reconnection could take place either below or within the flux rope
during the eruption. Generally, in "standard 2D models'' it is
considered that the magnetic field lines overlying the flux-rope
reconnect at the current sheet in the wake of expulsion of the
flux-rope (e.g., Lin & Forbes 2000, and references therein). In this
scenario the total expulsion of the flux rope occurs and the flux rope
propagates into the interplanetary medium along with the corresponding
CME. Note that in this scenario the magnetic field lines forming
the flux rope do not take part in reconnection. On the other hand,
the reconnection could also take place "internally'', i.e., within the
flux rope where field lines forming the flux rope take part in
reconnection (Gibson & Fan 2006b; Manchester et al. 2004; Gibson & Fan 2006a), leading to
the bifurcation of the flux rope during eruption.
![\begin{figure}
\par\includegraphics[width=12cm,clip]{7707fig2.eps}
\end{figure}](/articles/aa/full/2007/35/aa7707-07/img5.gif) |
Figure 2: Absolute intensity images recorded by the EIT in its 171 Å ( top left), 284 Å ( top right), 195 Å ( bottom left) and 304 Å ( bottom right) channels. Note that the images are displayed on a logarithmic scale. |
| Open with DEXTER | |
The observations and hypothesis made by Gilbert et al. (2000,2001) were
later studied by Gibson & Fan (2006b,a) based on a 3D MHD
simulation. In these simulations the complete evolution of a flux rope
was studied from the solar surface out to 6 ![]() .
Based on the
results of their simulation, Gibson & Fan (2006b,a) found
that the emergence of a flux rope with enough twist causes it to erupt
due to loss of equilibrium. The flux rope undergoes a kink
instability which leads to the formation of a vertical current sheet
inside the flux rope. The formation of a current sheet within an
unstable flux rope has also been demonstrated by Birn et al. (2006). After
multiple reconnections occurring inside the flux rope at the current
sheet, formed during the eruption, the flux-rope breaks in two. One
part of the flux rope escapes as the core of a corresponding CME and
the other falls back towards the Sun's surface. However, in the
simulation presented by Gibson & Fan (2006b,a), a special
kind of magnetic field geometry was used - a Bald Patch
Separatrix Surface (BPSS) - where the flux-rope intersects the photosphere and thus there is no X-point below the flux-rope.
.
Based on the
results of their simulation, Gibson & Fan (2006b,a) found
that the emergence of a flux rope with enough twist causes it to erupt
due to loss of equilibrium. The flux rope undergoes a kink
instability which leads to the formation of a vertical current sheet
inside the flux rope. The formation of a current sheet within an
unstable flux rope has also been demonstrated by Birn et al. (2006). After
multiple reconnections occurring inside the flux rope at the current
sheet, formed during the eruption, the flux-rope breaks in two. One
part of the flux rope escapes as the core of a corresponding CME and
the other falls back towards the Sun's surface. However, in the
simulation presented by Gibson & Fan (2006b,a), a special
kind of magnetic field geometry was used - a Bald Patch
Separatrix Surface (BPSS) - where the flux-rope intersects the photosphere and thus there is no X-point below the flux-rope.
In this paper we present observations of a bright coronal downflow
which may be an example of such a bifurcating flux rope in the course
of a CME eruption. Here we investigate the observation of the downflow
taken in multiple wavelengths, such as H![]() ,
white-light
K-corona (Mk4), and EUV. In the next section, we present the
observations we used, followed by their analysis and results in
Sect. 3. In Sect. 4, we provide measurements performed on the
data. We provide a summary of the results and discussion in Sect. 5.
,
white-light
K-corona (Mk4), and EUV. In the next section, we present the
observations we used, followed by their analysis and results in
Sect. 3. In Sect. 4, we provide measurements performed on the
data. We provide a summary of the results and discussion in Sect. 5.
![\begin{figure}
\par\includegraphics[width=12cm,clip]{7707fig3.eps}\end{figure}](/articles/aa/full/2007/35/aa7707-07/img6.gif) |
Figure 3:
Sequence of images taken by the H |
| Open with DEXTER | |
![\begin{figure}
\par\includegraphics[width=6.7cm,clip]{7707fig4.eps}\end{figure}](/articles/aa/full/2007/35/aa7707-07/img7.gif) |
Figure 4:
Co-aligned over-plotted EIT (running difference; in black &
white) and H |
| Open with DEXTER | |
Three erupting prominences (two large and one small - barely discernible) followed by a coronal downflow were observed on 5 March 2000 by the EIT. The EIT provides observations of the Sun at 195 Å with a regular cadence of about 12 min and one image every 6 h at 171 Å, 284 Å and 304 Å. The 195 Å passband of EIT is dominated by an Fe XII line formed at 1.5 MK, but also contains an Fe XXIV line at 192 Å formed at around 20 MK, which is usually much weaker in the quiet Sun region but highly significant in flaring regions (Tripathi et al. 2006a). The images obtained by the EIT at 171 Å, 284 Å and 304 Å wavelengths are dominated by lines Fe IX/x (1.0 MK), Fe XV (1.8 MK) and He II (0.05 MK) respectively.
Fortuitously this downflow was also observed by the Advanced Corona
Observing System
(ACOS)![]() composed of the Polarimeter for Inner Coronal Studies (PICS)
H
composed of the Polarimeter for Inner Coronal Studies (PICS)
H![]() (6563 Å) coronagraph, the Mk4 K-coronameter, which
observes the white-light K-corona, and the Chromospheric Helium I
Imaging Photometer (CHIP) He I (10 830 Å) instrument. In
this paper we concentrate on observations taken by the H
(6563 Å) coronagraph, the Mk4 K-coronameter, which
observes the white-light K-corona, and the Chromospheric Helium I
Imaging Photometer (CHIP) He I (10 830 Å) instrument. In
this paper we concentrate on observations taken by the H![]() coronagraph and the Mk4 coronameter. Since the downflow was not
clearly seen in the CHIP data, we decided not to use it.
coronagraph and the Mk4 coronameter. Since the downflow was not
clearly seen in the CHIP data, we decided not to use it.
![\begin{figure}
\par {\hspace*{7.5mm}\includegraphics[width=6.5cm,clip]{7707fg5a....
...7.5mm}}\vspace*{3mm}
\includegraphics[width=8cm,clip]{7707fg5b.eps}
\end{figure}](/articles/aa/full/2007/35/aa7707-07/img8.gif) |
Figure 5:
Top panel: masked H |
| Open with DEXTER | |
The ACOS instruments are operated at MLSO in Hawaii by the HAO. They
operate every day from about 17:00 until 22:00 UT (weather permitting)
producing about 100 images for each instrument with a cadence of about
3 min. The field of view (FOV) ranges from 1.01 to 1.83 ![]() from the solar center for the H
from the solar center for the H![]() coronagraph and from 1.12 to
2.79
coronagraph and from 1.12 to
2.79 ![]() for Mk4. The pixel size of the images taken by the
H
for Mk4. The pixel size of the images taken by the
H![]() coronagraph and Mk4 coronameter is about 2.9 arcsec. For
white-light observations of the corona, the Mk4 coronameter records
the polarization brightness data as well as white-light vignetted
data, where a hypothetical density function is subtracted from the
actual data in order to enhance the contrast in the images. Since we
are interested in a morphological study, we consider the Mk4
white-light vignetted data in this paper. The Mk4 data provided in the
archive are essentially fully processed. For technical details
concerning data processing and the instruments see Elmore et al. (2003).
coronagraph and Mk4 coronameter is about 2.9 arcsec. For
white-light observations of the corona, the Mk4 coronameter records
the polarization brightness data as well as white-light vignetted
data, where a hypothetical density function is subtracted from the
actual data in order to enhance the contrast in the images. Since we
are interested in a morphological study, we consider the Mk4
white-light vignetted data in this paper. The Mk4 data provided in the
archive are essentially fully processed. For technical details
concerning data processing and the instruments see Elmore et al. (2003).
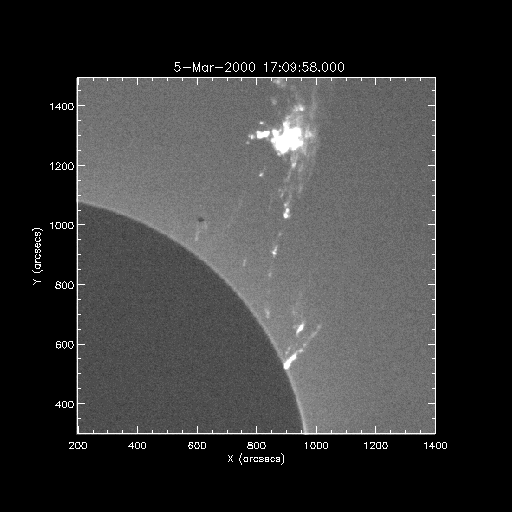
Figure 3 displays a sequence of images taken by the
H![]() coronagraph. The first image was taken at 17:09
UT. Although the ACOS instruments recorded the very early phase (start
phase) of the downflow, they unfortunately missed the eruption
phase. The FOV of the H
coronagraph. The first image was taken at 17:09
UT. Although the ACOS instruments recorded the very early phase (start
phase) of the downflow, they unfortunately missed the eruption
phase. The FOV of the H![]() observation is ideal for an
investigation of the origin and evolution of this downflow. Although,
the H
observation is ideal for an
investigation of the origin and evolution of this downflow. Although,
the H![]() coronagraph provides data with a regular cadence of
about three minutes, we only show some selected images in
Fig. 3. For the complete sequence in animation format see
movie "halpha.mov''
coronagraph provides data with a regular cadence of
about three minutes, we only show some selected images in
Fig. 3. For the complete sequence in animation format see
movie "halpha.mov''![]() . At
17:09 UT (top left frame in Fig. 3) a lot of material is
piled high up in the corona with some bright threads still connected
to the Sun's surface. As time passes, some of the material seems to
move away and might have escaped along with the CME. In addition some
material moves downward.
. At
17:09 UT (top left frame in Fig. 3) a lot of material is
piled high up in the corona with some bright threads still connected
to the Sun's surface. As time passes, some of the material seems to
move away and might have escaped along with the CME. In addition some
material moves downward.
After a while (at 17:48 UT) multiple bright localized structures
(cusp-shaped features) can be seen at the location (950, 1200; in
arcsec). These localized features are marked as "S1'', "S2'' and
"S3''. The feature on the right, namely "S1'', is brightest. These three
features exist until 17:54 UT. After that only one, very bright
(brighter than the earlier three) cusp-shaped feature remains, which
then propagates downward. The two branches in the downflow, marked
"B1'' and "B3'', emanate from this cusp and material flows down along
these two branches before the right branch "B1'' bifurcates into
another branch namely "B2'' at 18:07 UT. Interestingly this location
and time corresponds to the kink in the right branch seen in the EUV
images (see Fig. 1). The two branches "B1'' and "B3''
of the downflow are also evident in the EUV observations, though the
left "B3'' branch is not as clearly discernible as in H![]() observations. The third branch of the downflow "B2'', which is bright
and strong in H
observations. The third branch of the downflow "B2'', which is bright
and strong in H![]() images, is not evident in the EUV images,
most likely because the plasma flowing along the third branch does not
radiate in the narrow temperature range to which the EIT 195 Å channel
is sensitive. The left branch ("B3'') had almost disappeared by
18:37 UT and the middle branch ("B2'') disappears at 18:28 UT. However,
the kink in the right branch - where the middle branch emanates -
remains clearly visible. Most of the material seems to flow down along
the right branch of the downflow feature, which is the brightest and
longest lasting.
images, is not evident in the EUV images,
most likely because the plasma flowing along the third branch does not
radiate in the narrow temperature range to which the EIT 195 Å channel
is sensitive. The left branch ("B3'') had almost disappeared by
18:37 UT and the middle branch ("B2'') disappears at 18:28 UT. However,
the kink in the right branch - where the middle branch emanates -
remains clearly visible. Most of the material seems to flow down along
the right branch of the downflow feature, which is the brightest and
longest lasting.
In order to compare our EIT observations with those made in
H![]() ,
we display in Fig. 4 three EIT images
co-aligned with H
,
we display in Fig. 4 three EIT images
co-aligned with H![]() images recorded very close in time (top
panel: EIT-17:10:48 UT, H
images recorded very close in time (top
panel: EIT-17:10:48 UT, H![]() -17:09:58 UT; middle panel:
EIT-17:58:50 UT, H
-17:09:58 UT; middle panel:
EIT-17:58:50 UT, H![]() -17:57:09 UT; bottom panel:
EIT-18:23:03 UT, H
-17:57:09 UT; bottom panel:
EIT-18:23:03 UT, H![]() -18:23:06 UT). Since the H
-18:23:06 UT). Since the H![]() coronagraph does not provide full disk observations like EIT, it is
not straightforward to co-align these images. For the co-alignment, we
co-registered the EIT images to the near-simultaneous H
coronagraph does not provide full disk observations like EIT, it is
not straightforward to co-align these images. For the co-alignment, we
co-registered the EIT images to the near-simultaneous H![]() images using the routine coreg_map.pro provided in the SSW
tree
images using the routine coreg_map.pro provided in the SSW
tree![]() . This
routine is a wrapper around another routine called drot_map.pro
which differentially rotates one map at the time of the other map,
while taking into account the roll angle. Also, in order to have same
pixel size in two maps, images with a smaller pixel size are rebinned
to a high number of pixels. The co-registration provides the EIT
images with the same pixel size (2.9 arcsec) as that of H
. This
routine is a wrapper around another routine called drot_map.pro
which differentially rotates one map at the time of the other map,
while taking into account the roll angle. Also, in order to have same
pixel size in two maps, images with a smaller pixel size are rebinned
to a high number of pixels. The co-registration provides the EIT
images with the same pixel size (2.9 arcsec) as that of H![]() images. The H
images. The H![]() contours representing the right branch of the
downflow (right panel of Fig. 4) were seen to be
spatially and temporally correlated with those of EIT. In the left
branch the H
contours representing the right branch of the
downflow (right panel of Fig. 4) were seen to be
spatially and temporally correlated with those of EIT. In the left
branch the H![]() brightenings appear to be far more localized
and point-like than the more thread-like structures seen in EIT. These
bright H
brightenings appear to be far more localized
and point-like than the more thread-like structures seen in EIT. These
bright H![]() points do, however, correspond to EIT
brightenings. It seems plausible and reasonable to conclude that the
features observed in EIT and those in H
points do, however, correspond to EIT
brightenings. It seems plausible and reasonable to conclude that the
features observed in EIT and those in H![]() are closely
connected, although due to different temperature sensitivity of the 2
data sets it is likely that the plasma is composed of multi-thermal
unresolved magnetic strands. The cusp-shaped feature seen in
H
are closely
connected, although due to different temperature sensitivity of the 2
data sets it is likely that the plasma is composed of multi-thermal
unresolved magnetic strands. The cusp-shaped feature seen in
H![]() is located outside the FOV of EIT. Moreover, downflow
branches in the EIT and the apex location where the two branches
emanate in EUV images seem to be wider than that in H
is located outside the FOV of EIT. Moreover, downflow
branches in the EIT and the apex location where the two branches
emanate in EUV images seem to be wider than that in H![]() .
.
![\begin{figure}
\par\includegraphics[width=12cm,clip]{7707fig6.eps}
\end{figure}](/articles/aa/full/2007/35/aa7707-07/img9.gif) |
Figure 6: Absolute intensity images taken by Mk4 white-light coronagraph. The arrows in the middle panel mark the shrinking loops. |
| Open with DEXTER | |
The top panel of Fig. 5 displays an H![]() map with a
masked region. We selected this region in order to compute the
variation of the total amount of material during the sequence of the
downflow which is shown in the bottom panel. It is evident from the
plot (see bottom panel of Fig. 5) that the total intensity of
the masked region increases over most of the time that the downflow
was seen. This could either be due to the increase in the amount of
the downflowing plasma, to an enhancement of the density, or cooling
of hot material to chromospheric temperatures. Further the total
intensity starts to decrease when most of the material has drained down
on to the Sun's surface.
map with a
masked region. We selected this region in order to compute the
variation of the total amount of material during the sequence of the
downflow which is shown in the bottom panel. It is evident from the
plot (see bottom panel of Fig. 5) that the total intensity of
the masked region increases over most of the time that the downflow
was seen. This could either be due to the increase in the amount of
the downflowing plasma, to an enhancement of the density, or cooling
of hot material to chromospheric temperatures. Further the total
intensity starts to decrease when most of the material has drained down
on to the Sun's surface.
![\begin{figure}
\par\includegraphics[width=6cm,clip]{7707fig7.eps}
\end{figure}](/articles/aa/full/2007/35/aa7707-07/img10.gif) |
Figure 7: Images recorded by the Mk4 which was used as an base image in creating Fig. 8. |
| Open with DEXTER | |
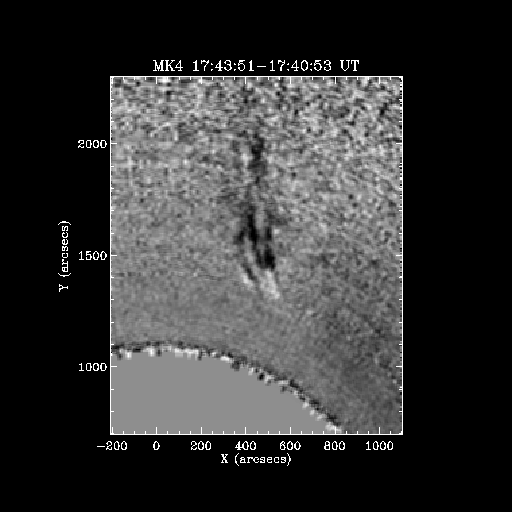
The downflow was also recorded in white-light observations taken by
the Mk4 coronameter of the ACOS at MLSO. The advantage of Mk4 is the
larger FOV. Combining the EIT, the H![]() and the Mk4
observations provides an opportunity to study the solar corona out to
2.79
and the Mk4
observations provides an opportunity to study the solar corona out to
2.79 ![]() .
Since white-light images can be directly interpreted
in terms of the distribution of electron density along the line of
sight, they potentially contain information on the dynamics of the
magnetic field. Figure 6 displays absolute intensity images
taken by the Mk4 coronagraph. Three bright streak like structures are
evident and are marked in the middle panel with arrows. These
structures appear quite discrete in the left panel. With time, these
streaks diffuse and most probably move down. Figure 8 displays
the sequence of base difference images taken by the Mk4
coronameter. Base difference images provide information about the
dynamics of features with respect to a fixed image frame. In this case
the image recorded at 17:37:55 UT (see Fig. 7) was taken as
the base image. We chose this particular image as a base since the
leading edge of the downflow started to be clearly discernible at this
time. Although Mk4 provides observations with a cadence of about 3
minutes, we only show some selected images in this figure. For the
complete sequence see the movie "mk4.mov''
.
Since white-light images can be directly interpreted
in terms of the distribution of electron density along the line of
sight, they potentially contain information on the dynamics of the
magnetic field. Figure 6 displays absolute intensity images
taken by the Mk4 coronagraph. Three bright streak like structures are
evident and are marked in the middle panel with arrows. These
structures appear quite discrete in the left panel. With time, these
streaks diffuse and most probably move down. Figure 8 displays
the sequence of base difference images taken by the Mk4
coronameter. Base difference images provide information about the
dynamics of features with respect to a fixed image frame. In this case
the image recorded at 17:37:55 UT (see Fig. 7) was taken as
the base image. We chose this particular image as a base since the
leading edge of the downflow started to be clearly discernible at this
time. Although Mk4 provides observations with a cadence of about 3
minutes, we only show some selected images in this figure. For the
complete sequence see the movie "mk4.mov''![]() . Three distinct features can be seen in the top left
images in Fig. 8. As time passes it appears that the complete
structure is breaking into two parts. One moving outwards (see bright
feature at 500, 1900 arcsec location in the top right image
taken at 17:46 UT) and the other moving downwards (see bright feature
at 500, 1400 arcsec in the top right image). The downward moving
feature appears initially to be blob-like and starts to bifurcate at
17:52:44 UT (more clearly at 17:55:41 UT and afterwards) at a point
which corresponds to branches "B1'' and "B3'' seen in H
. Three distinct features can be seen in the top left
images in Fig. 8. As time passes it appears that the complete
structure is breaking into two parts. One moving outwards (see bright
feature at 500, 1900 arcsec location in the top right image
taken at 17:46 UT) and the other moving downwards (see bright feature
at 500, 1400 arcsec in the top right image). The downward moving
feature appears initially to be blob-like and starts to bifurcate at
17:52:44 UT (more clearly at 17:55:41 UT and afterwards) at a point
which corresponds to branches "B1'' and "B3'' seen in H![]() (see
Fig. 3). The branching of the downflow was apparent in
H
(see
Fig. 3). The branching of the downflow was apparent in
H![]() at 17:54:04 UT becoming more clear at 17:57:09 UT. The
bifurcation of the right branch could not be recorded by Mk4 because
of the occulting disk. The large dark area, or dimming, that slowly
builds up in the center of the image during the sequence is due to a
general decrease in the brightness there as the body of the CME and
embedded prominence moves. As can be deduced from Fig. 8 and
more clearly from the movie "mk4.mov'', the dimming area increases in
all four directions, but predominantly in the direction of the outflow
and downflow. The increase in the dimming area can be interpreted in
terms of reconnection as proposed by Shiota et al. (2005) based on MHD
modelling.
at 17:54:04 UT becoming more clear at 17:57:09 UT. The
bifurcation of the right branch could not be recorded by Mk4 because
of the occulting disk. The large dark area, or dimming, that slowly
builds up in the center of the image during the sequence is due to a
general decrease in the brightness there as the body of the CME and
embedded prominence moves. As can be deduced from Fig. 8 and
more clearly from the movie "mk4.mov'', the dimming area increases in
all four directions, but predominantly in the direction of the outflow
and downflow. The increase in the dimming area can be interpreted in
terms of reconnection as proposed by Shiota et al. (2005) based on MHD
modelling.
![\begin{figure}
\par\includegraphics[width=12cm,clip]{7707fig8.eps}
\end{figure}](/articles/aa/full/2007/35/aa7707-07/img11.gif) |
Figure 8: Base difference images taken by the Mk4 coronameter of the Advanced Coronal Observing System at Mauna Loa Solar Observatory. The arrow in the top right panel locates the outward propagating reconnetion jet. Note that only few images are shown here. For the complete sequence see the movie "mk4.mov'' (online only). |
| Open with DEXTER | |
Figure 9 displays the height-time plot for the right branch
"B1'' of the downflow as measured from the observations recorded by the
H![]() coronagraph (asterisks), Mk4 coronameter (triangles) and
EIT 195 Å (diamonds). Note that the data points from Mk4 are
obtained from the base difference images (since in the original
images the features are rather diffuse and it is easier to follow the
dynamics of features using base difference images) and those for EIT
are taken from Paper I. These data points refer to the leading edge of
the features. We did not attempt to compare the height-time diagram
for other branches as they were not observed with all instruments
simultaneously. The height-time diagram for the right branch matches
very well for all three instruments except the very first point of
EIT. This could be due to an error in the position of obtaining the
first EIT data point as it was quite weak and lay right at the edge of
the image frame. In general the gas falls more rapidly in the early
phases and more slowly in the later phases.
coronagraph (asterisks), Mk4 coronameter (triangles) and
EIT 195 Å (diamonds). Note that the data points from Mk4 are
obtained from the base difference images (since in the original
images the features are rather diffuse and it is easier to follow the
dynamics of features using base difference images) and those for EIT
are taken from Paper I. These data points refer to the leading edge of
the features. We did not attempt to compare the height-time diagram
for other branches as they were not observed with all instruments
simultaneously. The height-time diagram for the right branch matches
very well for all three instruments except the very first point of
EIT. This could be due to an error in the position of obtaining the
first EIT data point as it was quite weak and lay right at the edge of
the image frame. In general the gas falls more rapidly in the early
phases and more slowly in the later phases.
![\begin{figure}
\par\includegraphics[width=7.2cm,clip]{7707fig9.eps}
\end{figure}](/articles/aa/full/2007/35/aa7707-07/img12.gif) |
Figure 9:
Height-time plot of the right branch (B1) of the downflow
based on observations recorded by the H |
| Open with DEXTER | |
Figure 10 displays the speed-height profiles of the
right branch (B1, panel a), middle branch (B2, panel b) and left
branch (B3, panel c) as obtained from the H![]() observations. The dashed line represents the downward component of the
speed and the dotted line indicates the absolute projected speed for
the downflows. In order to avoid excessive fluctuations in the speed
we have applied a smoothing (running mean) to the data points as we
are mainly interested in the general trend of speeds rather than their
local fluctuations. Note that all the measured speeds represent a
lower limit on the real speed, since the direction of motion may lie
outside the plane of the sky. The solid lines represent the
speed-height profile of a ballistic body falling from a height of 1.6
observations. The dashed line represents the downward component of the
speed and the dotted line indicates the absolute projected speed for
the downflows. In order to avoid excessive fluctuations in the speed
we have applied a smoothing (running mean) to the data points as we
are mainly interested in the general trend of speeds rather than their
local fluctuations. Note that all the measured speeds represent a
lower limit on the real speed, since the direction of motion may lie
outside the plane of the sky. The solid lines represent the
speed-height profile of a ballistic body falling from a height of 1.6 ![]() ,
taking only solar gravitation into account. The free fall
height was chosen to be 1.6
,
taking only solar gravitation into account. The free fall
height was chosen to be 1.6 ![]() as the movie "mk4.mov'' reveals
that the bifurcation would have happened at around this height. It is
evident from Fig. 10 that the right and the left
branches of the downflow seen in H
as the movie "mk4.mov'' reveals
that the bifurcation would have happened at around this height. It is
evident from Fig. 10 that the right and the left
branches of the downflow seen in H![]() (panels a and c) started
with almost the free-fall speed and were strongly
decelerated. However, the middle branch downflow (panel b) had a speed
well below free fall. This is clearly due to the fact that this branch
bifurcated from the right branch at a time when the latter was already
highly decelerated.
(panels a and c) started
with almost the free-fall speed and were strongly
decelerated. However, the middle branch downflow (panel b) had a speed
well below free fall. This is clearly due to the fact that this branch
bifurcated from the right branch at a time when the latter was already
highly decelerated.
![\begin{figure}
\par\includegraphics[width=13.3cm,clip]{7707fg10.eps}
\end{figure}](/articles/aa/full/2007/35/aa7707-07/img13.gif) |
Figure 10:
Speed-height plots for the downflow (B1, right branch: panel
a); B2, left branch: panel b); B3, left branch: panel c) based on the
H |
| Open with DEXTER | |
![\begin{figure}
\includegraphics[width=12cm,clip]{7707fg11.eps}
\end{figure}](/articles/aa/full/2007/35/aa7707-07/img14.gif) |
Figure 11:
Speed-height plots for the downflow (B1, right branch: panel
a); B3, left branch: panel b) based on the Mk4 coronagraph
observations. Dotted lines represent the absolute projected speed and
dashed lines represent the downward component of the speed. The solid
lines represent the free-fall speed profile of a ballistic body
starting at 1.6 |
| Open with DEXTER | |
Figure 11 displays the speed-height profile for the right
branch (B1, panel a) and that of the left branch (B3, panel b) from
Mk4. The different lines have the same meaning as in
Fig. 10. Recall that the data points for Mk4 were
obtained from the base difference images. There are no measurements
for the middle branch as it was below the occulting disk of Mk4. The
initial speeds measured from the base difference Mk4 images are much
higher than those obtained from the H![]() absolute intensity
images. The downflow started with a much higher speed (
absolute intensity
images. The downflow started with a much higher speed (![]() 380 km s-1) than free fall, but then rapidly decelerated to values
well below free-fall. These later speeds are in reasonable agreement
with those found from H
380 km s-1) than free fall, but then rapidly decelerated to values
well below free-fall. These later speeds are in reasonable agreement
with those found from H![]() .
The right and left branches show
similar speed profiles, although the speed of the left branch downflow
is lower than that of the right branch.
.
The right and left branches show
similar speed profiles, although the speed of the left branch downflow
is lower than that of the right branch.
Based on the MHD treatment of magnetic reconnection
(i.e. Sweet-Parker and Petschek type reconnection), the reconnection
outflow speed appears to be roughly equivalent to Alfvén speed. If
the total magnetic energy stored at the reconnection location converts
into the bulk kinetic energy of the plasma, the outflow speed become
equal to the Alfvén speed (Yokoyama et al. 2001). Considering the magnetic
field in prominences to be about 20 G (see e.g., Casini et al. 2003) and
the density as 1010 cm-3 (see e.g., Chang & Deming 1998), the
Alfvén speed is then about ![]() 440 km s-1. This is larger
than the measured initial speed of the downflow. Taking into account
that some of the energy converts into the thermal energy heating the
plasma, the initial speed of the downflow appears to be consistent
with a reconnection outflow.
440 km s-1. This is larger
than the measured initial speed of the downflow. Taking into account
that some of the energy converts into the thermal energy heating the
plasma, the initial speed of the downflow appears to be consistent
with a reconnection outflow.
We have investigated the multi-wavelength observation taken by
SoHO/EIT at 195 Å, and the ACOS instruments namely, the PICS H![]() coronagraph and the Mk4 white-light K-coronameter in order to study the
origin, evolution and characteristics of a bright coronal
downflow. The downflow was observed after three prominences
simultaneously erupted as part of a CME on 5 March 2000. Although
there were three prominence eruptions (two large (P1 and P2) and one
small (P3); see Fig. 1 in Paper I), only one CME was detected by
LASCO/C2 coronagraph. The two large prominences (P1 and P2) were
identified in LASCO/C2 images as the core of the CME (see Fig. 2 in
Paper I).
coronagraph and the Mk4 white-light K-coronameter in order to study the
origin, evolution and characteristics of a bright coronal
downflow. The downflow was observed after three prominences
simultaneously erupted as part of a CME on 5 March 2000. Although
there were three prominence eruptions (two large (P1 and P2) and one
small (P3); see Fig. 1 in Paper I), only one CME was detected by
LASCO/C2 coronagraph. The two large prominences (P1 and P2) were
identified in LASCO/C2 images as the core of the CME (see Fig. 2 in
Paper I).
Let us consider possible explanations for the origin of the downflow
and its characteristics. One possibility is that the downflow is
composed of material that could not reach the escape speed and
overcome the solar gravitational field. Under this scenario the speed
of the downflowing plasma should not exceed that of free fall. It can
be lower, since lower lying, possibly still upward moving, plasma
would slow down the downflowing plasma. The speed obtained from the
H![]() observations is comparable to that of free-fall or lies
below it. However, the initial downflow speed obtained from the Mk4
recording lies far in excess of the free-fall speed. Note that the
speeds are measured in the plane of the sky so that they are lower
limits. Furthermore, the speeds derived from the Mk4 observations have
the advantage over those from the H
observations is comparable to that of free-fall or lies
below it. However, the initial downflow speed obtained from the Mk4
recording lies far in excess of the free-fall speed. Note that the
speeds are measured in the plane of the sky so that they are lower
limits. Furthermore, the speeds derived from the Mk4 observations have
the advantage over those from the H![]() or the EIT observations
because the Mk4 observations are not temperature sensitive. Therefore
the derived data points based on the Mk4 observations are not
temperature biased. There may, however, be an enhanced uncertainty due
to the fact that we are analyzing base difference images of Mk4
data. We note that, the downflow was observed in EIT (1.5 MK) and SXT
(2-5 MK) images (see Paper I). This is suggestive of plasma heating
which is highly unlikely if the downflow is simply due to
deceleration/acceleration by the solar gravitational field.
or the EIT observations
because the Mk4 observations are not temperature sensitive. Therefore
the derived data points based on the Mk4 observations are not
temperature biased. There may, however, be an enhanced uncertainty due
to the fact that we are analyzing base difference images of Mk4
data. We note that, the downflow was observed in EIT (1.5 MK) and SXT
(2-5 MK) images (see Paper I). This is suggestive of plasma heating
which is highly unlikely if the downflow is simply due to
deceleration/acceleration by the solar gravitational field.
Another interpretation is that while erupting the prominences pass
through a kink instability. The development of a kink in prominences
during the eruption phase has been observed
(e.g., Williams et al. 2005; Rust & LaBonte 2005) and theoretically modelled
(e.g., Török & Kliem 2005; Fan 2005). The kink instability in the
prominence during eruption can explain the cusp-shaped structure
formation which is seen in the images taken by the H![]() and
the Mk4 coronagraphs as well as the EIT. Furthermore, during the
eruption the helical field lines, originally holding the prominence at
the bottom, get stretched and the material sitting at the bottom of
the flux rope drains down along the legs of the flux rope. This
interpretation poses similar problems to the earlier one, such as the
plasma heating and the high speed of the downflow with respect to
free-fall.
and
the Mk4 coronagraphs as well as the EIT. Furthermore, during the
eruption the helical field lines, originally holding the prominence at
the bottom, get stretched and the material sitting at the bottom of
the flux rope drains down along the legs of the flux rope. This
interpretation poses similar problems to the earlier one, such as the
plasma heating and the high speed of the downflow with respect to
free-fall.
Let us now consider the interpretation put forward by Gilbert et al. (2000,2001) and later Gibson & Fan (2006b, based on 3D MHD simulations,a). These authors proposed that during the eruption of a pre-existing flux rope, reconnection takes place internally and the flux rope breaks into two. The outer part propagates along with the CME and the lower part falls back to the Sun's surface. The basic observables predicted on the basis of the above model would be the simultaneous presence of an X-type structure in the corona, a three part structured CME and the downflowing plasma (Tripathi et al. 2007). One of the most important and plausible signatures of the reconnection would be heating of plasma emanating from the reconnection locations (X-type location) as well as reconnection jets. This implies that the speed of plasma emanating from the reconnection location and flowing towards the Sun's surface would be significantly higher than the free fall speed especially at high temperature. This speed would either grow or decrease depending on the amount of material below the location of reconnection.
Based on the LASCO/C2 and C3 observations we confirmed that the
associated CME was comprised of a bright front, dark cavity and a
bright core - representing the prominence material (see Paper
I). Also, the downflowing plasma in the EIT and the SXT was bright,
implying that the temperature of at least a part of the downflowing
plasma can be as high as 4-5 MK or even 20 MK (Tripathi et al. 2006a),
providing strong evidence of plasma heating (see Paper I). However,
due to the restricted FOV of the EIT and the SXT and lack of
observations from 1.5-2.5 ![]() ,
we were not able to locate the
precise reconnection point, reconnection jet and estimate the speed of
the downflowing plasma in the early phase. The Mk4 and the H
,
we were not able to locate the
precise reconnection point, reconnection jet and estimate the speed of
the downflowing plasma in the early phase. The Mk4 and the H![]() data helped us to find the location of reconnection because of the
larger FOV of these instruments. Based on the Mk4 observations we have
a more complete picture of the reconnection such that the reconnection
jet propagates outwards (see movie `mk4.mov') and the initial
speed of the downflowing plasma is substantially higher than that of
free-fall (see Figs. 8, 11). Furthermore, the
white-light base difference images show that the dimming area
increases at the location where the downflow seems to start. The
increase in the dimming area provides further strong evidence of
reconnection as described by Shiota et al. (2005).
data helped us to find the location of reconnection because of the
larger FOV of these instruments. Based on the Mk4 observations we have
a more complete picture of the reconnection such that the reconnection
jet propagates outwards (see movie `mk4.mov') and the initial
speed of the downflowing plasma is substantially higher than that of
free-fall (see Figs. 8, 11). Furthermore, the
white-light base difference images show that the dimming area
increases at the location where the downflow seems to start. The
increase in the dimming area provides further strong evidence of
reconnection as described by Shiota et al. (2005).
Although this interpretation explains most of the characteristics of
the observed downflow, it still poses a problem concerning the reason
for approximately co-spatial and co-temporal observation of
multi-thermal plasma such as in the H![]() (cool material) and
EIT (all four channels) and SXT (hot material). There could be
different possibilities. First, this could be due to the fact that
cooler plasma (lower part of the prominence) seen in the H
(cool material) and
EIT (all four channels) and SXT (hot material). There could be
different possibilities. First, this could be due to the fact that
cooler plasma (lower part of the prominence) seen in the H![]() is
still rising when reconnection occurs further up. Because of the
reconnection, the plasma is stopped and slowly starts to fall down. In
this scenario material would not be heated to the temperatures needed
to make it visible in the EIT and the SXT. Another possible
explanation is that the EIT and the H
is
still rising when reconnection occurs further up. Because of the
reconnection, the plasma is stopped and slowly starts to fall down. In
this scenario material would not be heated to the temperatures needed
to make it visible in the EIT and the SXT. Another possible
explanation is that the EIT and the H![]() observations indicate
a dense flux tube-like structure. The highly dense plasma in the inner
part of the flux tube is either cold to start with, or cools down
faster than the outer part, as the radiative cooling time is
proportional to
observations indicate
a dense flux tube-like structure. The highly dense plasma in the inner
part of the flux tube is either cold to start with, or cools down
faster than the outer part, as the radiative cooling time is
proportional to
![]() 2. This interpretation also explains the
fact the H
2. This interpretation also explains the
fact the H![]() downflow in the left branch is highly localised
and seen at locations where the EIT downflow is brightest. Moreover,
the H
downflow in the left branch is highly localised
and seen at locations where the EIT downflow is brightest. Moreover,
the H![]() downflows are thinner than those in EIT. On the other
hand, it may well be that the downflow is comprised of multi-thermal
unresolved magnetic strands. The above two interpretations are also
supported by the fact that the total intensity of the masked region
increases over most of the time when the downflow is seen (see
Fig. 5). This increase is basically due to the enhancement of
the downflowing material, which means that the plasma that was at
higher temperature cools down to temperatures sensitive to the
H
downflows are thinner than those in EIT. On the other
hand, it may well be that the downflow is comprised of multi-thermal
unresolved magnetic strands. The above two interpretations are also
supported by the fact that the total intensity of the masked region
increases over most of the time when the downflow is seen (see
Fig. 5). This increase is basically due to the enhancement of
the downflowing material, which means that the plasma that was at
higher temperature cools down to temperatures sensitive to the
H![]() observations. Later on the total intensity starts to
decrease when most of the cool material is drained down on to the
Sun's surface and there are no hot material left to cool down.
observations. Later on the total intensity starts to
decrease when most of the cool material is drained down on to the
Sun's surface and there are no hot material left to cool down.
Despite the fact that we can explain the origin and characteristics of
the observed downflow described in this paper and Paper I, the
question remains as to why such downflows are rare event?. We also
looked at five more H![]() observations from MLSO. Draining of
the plasma along the legs of erupting prominences was a common
phenomenon in the H
observations from MLSO. Draining of
the plasma along the legs of erupting prominences was a common
phenomenon in the H![]() observations for all those five
events. These downflows were also seen in the Mk4
observations. However, there were no corresponding signatures in the
EIT observations. Also there was no evidence of formation of an X-type
structure such as a cusp in the corona. This suggest that reconnection
associated with the heating of the prominence gas to coronal
temperatures is not an entirely common occurrence.
observations for all those five
events. These downflows were also seen in the Mk4
observations. However, there were no corresponding signatures in the
EIT observations. Also there was no evidence of formation of an X-type
structure such as a cusp in the corona. This suggest that reconnection
associated with the heating of the prominence gas to coronal
temperatures is not an entirely common occurrence.
We note that this is the first observation of its kind and demands further study and a deeper understanding. In order to carry out this kind of study we would require a wide temperature coverage with very high time resolution data over a large field of view. In the future, observations from the Hinode satellite combined with those from the Solar Terrestrial Relation Observatory (STEREO) and later the Solar Dynamics observatory (SDO) may provide a unique opportunity to study these phenomena in more detail.
Acknowledgements
We acknowledge an anonymous referee for comments which certainly improved the quality of the manuscript. DT and HEM acknowledge support from STFC. DW was supported by Air Force Research Lab Contract FA8718-06-C-0015. DT would like to thank Sarah Gibson for many useful discussions and comments. We thank the SoHO-EIT and HAO teams for providing the data and also Joan Burkepile for her help in explaining the instruments. SoHO is a mission of international collaboration between ESA and NASA.
halpha.mov
halpha.gif
halpha.avi