A&A 472, 435-442 (2007)
DOI: 10.1051/0004-6361:20077353
Redshifted formaldehyde from the gravitational lens B0218+357
N. Jethava1 -
C. Henkel1 -
K. M. Menten1 -
C. L. Carilli2 -
M. J. Reid3
1 - Max-Planck-Institut für Radioastronomie, Auf dem Hügel 69, 53121 Bonn, Germany
2 -
National Radio Astronomy Observatory, Socorro, New Mexico, 87801, USA
3 -
Harvard-Smithsonian Center for Astrophysics, 60 Garden St., MS 42, Cambridge, MA 02138, USA
Received 26 February 2007 / Accepted 8 June 2007
Abstract
Context. Little is known about individual molecular clouds at high redshifts. The gravitational lens toward B0218+357 offers the unique possibility to study cool moderately dense gas with high sensitivity and angular resolution in a cloud that existed half a Hubble time ago.
Aims. This non-CO molecular multi-level study of a significantly redshifted cloud aims at a better definition of the physical properties of molecular gas in a kind of interstellar environment that is rarely studied in the Galaxy or in the nearby extragalactic space.
Methods. Observations of the radio continuum and six formaldehyde (H2CO) lines were carried out with the VLA, the Plateau de Bure interferometer and the Effelsberg 100-m telescope.
Results. Three radio continuum maps indicate a flux density ratio between the two main images, A and B, of 
 .
Within the errors the ratio is the same at 8.6, 14.1, and 43 GHz. The 1
01-000 line of para-H2CO is shown to absorb the continuum of image A. Large Velocity Gradient radiative transfer calculations are performed to reproduce the optical depths of the observed two cm-wave "K-doublet'' and four mm-wave rotational lines. These calculations also account for a likely frequency-dependent continuum cloud coverage. Confirming the diffuse nature of the cloud, an n(H2) density of <1000 cm-3 is derived, with the best fit suggesting n(H2) 200 cm-3. The H2CO column density of the main velocity component is
.
Within the errors the ratio is the same at 8.6, 14.1, and 43 GHz. The 1
01-000 line of para-H2CO is shown to absorb the continuum of image A. Large Velocity Gradient radiative transfer calculations are performed to reproduce the optical depths of the observed two cm-wave "K-doublet'' and four mm-wave rotational lines. These calculations also account for a likely frequency-dependent continuum cloud coverage. Confirming the diffuse nature of the cloud, an n(H2) density of <1000 cm-3 is derived, with the best fit suggesting n(H2) 200 cm-3. The H2CO column density of the main velocity component is
 cm-2, to which about
 cm-2 has to be added to also account for a weaker feature on the blue side, 13 km s-1 apart. N(H2CO)/N(NH3) 0.6, which is four times less than the average ratio obtained from a small number of local diffuse (galactic) clouds seen in absorption. The ortho-to-para H2CO abundance ratio is 2.0-3.0, which is consistent with the kinetic temperature of the molecular gas associated with the lens of B0218+357. With the gas kinetic temperature and density known, it is found that optically thin transitions of CS, HCN, HNC, HCO+, and N2H+ (but not CO) will provide excellent probes of the cosmic microwave background at redshift z=0.68.
Key words: Galaxy: abundances - ISM: abundances - galaxies: ISM - galaxies: individual: PKS B0218+357 - radio lines: galaxies - gravitational lensing
B0218+357 is one of the most interesting gravitational lens systems studied to date. The background source showing a red
featureless optical spectrum (Stickel & Kühr 1993) is believed to be a BL Lac object. The prominent radio source has a
redshift of
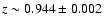 (Cohen et al. 2003) and is lensed by an intervening almost face-on spiral (for an image,
see York et al. 2005) into two compact images, A and B, and a faint Einstein ring (e.g., O'Dea et al. 1992; Patnaik et al.
1993). The flux density of source A is about three times higher than that of source B; their separation as well as the angular
diameter of the ring are with 0
(Cohen et al. 2003) and is lensed by an intervening almost face-on spiral (for an image,
see York et al. 2005) into two compact images, A and B, and a faint Einstein ring (e.g., O'Dea et al. 1992; Patnaik et al.
1993). The flux density of source A is about three times higher than that of source B; their separation as well as the angular
diameter of the ring are with 0
 3 exceptionally small.
Browne et al. (1993) reported optical detections of narrow atomic absorption and emission lines from the lens at redshift
z=0.6847. H I absorption was observed by Carilli et al. (1993) and Kanekar et al. (2003). The first
molecular absorption lines from the intervening system were detected by Wiklind & Combes (1995). Identified molecular
species are CO, HCN, and HCO+ (Wiklind & Combes 1995), H2CO (Menten & Reid 1996), H2O (Combes &
Wiklind 1997), CS (Combes et al. 1997), OH (Kanekar et al. 2003), NH3 (Henkel et al. 2005)
and tentatively also LiH (Combes & Wiklind 1998). These absorption lines originate from a diffuse molecular cloud of kinetic
temperature
 K (Henkel et al. 2005) that is located along the line-of-sight to component A (Menten & Reid
1996). The cloud parameters appear to be quite peculiar when compared with the properties of clouds in the Galaxy or in nearby
extragalactic systems (Henkel et al. 2005).
K (Henkel et al. 2005) that is located along the line-of-sight to component A (Menten & Reid
1996). The cloud parameters appear to be quite peculiar when compared with the properties of clouds in the Galaxy or in nearby
extragalactic systems (Henkel et al. 2005).
The gravitational lens of the B0218+357 system provides a unique laboratory for detailed molecular cloud research at intermediate redshifts.
From the standard model ( -cosmology with H0=71 km s-1 Mpc-1,
 and
and
 ;
Spergel et al. 2003) we obtain a light travel time of 6.2 Gyr, a luminosity distance of 4.1 Gpc, a comoving radial distance of 2.5 Gpc
and an angular size distance of 1.5 Gpc, resulting in a linear scale of 7.1 pc mas-1.
;
Spergel et al. 2003) we obtain a light travel time of 6.2 Gyr, a luminosity distance of 4.1 Gpc, a comoving radial distance of 2.5 Gpc
and an angular size distance of 1.5 Gpc, resulting in a linear scale of 7.1 pc mas-1.
In the following we present three radio continuum maps of B0218+357 as well as the first non-CO molecular multilevel study of a significantly
redshifted cloud. The species of choice is formaldehyde (H2CO). With the detection of five H2CO transitions complemented by an additional
H2CO spectrum from Menten & Reid (1996), we have a total of six lines (see also Darling & Wiklind 2005). These and
the continuum data can be used to further elucidate the highly peculiar physical cloud parameters (Henkel et al. 2005), to constrain
the continuum morphology and to estimate an ortho- to para-H2CO abundance ratio that has the potential to provide clues to the history and
chemistry of the cloud.
Table 1:
Summary of spectroscopic observationsa.
Table 1 and Fig. 1 summarize the observational parameters of the H2CO line measurements, including the 211-212
line reported by Menten & Reid (1996). Observations were carried out with the Very Large Array (VLA) of the National Radio Astronomy
Observatory (NRAO![[*]](/icons/foot_motif.gif) ), the Plateau de Bure Interferometer (PdBI) of the Institute de Radioastronomie Millimétrique (IRAM) and the 100-m Effelsberg telescope of the Max-Planck-Institut für
Radioastronomie (MPIfR).
), the Plateau de Bure Interferometer (PdBI) of the Institute de Radioastronomie Millimétrique (IRAM) and the 100-m Effelsberg telescope of the Max-Planck-Institut für
Radioastronomie (MPIfR).
The VLA observations were carried out in the A-configuration at 8.6 and 14.1 GHz (X- and U-band; see Menten & Reid 1996) and at
43.2 GHz (Q-band; projects AM0494 and AM0545), employing 25, 25, and 13 25-m antennas, respectively. Measurements at the two lower frequencies,
already presented by Menten & Reid (1996), were re-reduced (note the slight difference in angular resolution of the X-band data between
those given in our Table 1 and that of Menten & Reid 1996). In the X- and U-band, the total bandwidth of 6.25 MHz was split
into 64 channels. In the Q-band, the bandwidth was 12.5 MHz, consisting of 32 channels. The phase center was located at
 = 02
= 02 21
21 05
05
 4733 and
 = +35
= +35 56
56 13
791. Phase and bandpass calibration were
achieved by observations toward the standard VLA calibrator 3C 84. Absolute flux calibration was obtained by measuring 3C 286, for which
flux densities of 5.11, 3.54 and 1.46 Jy were adopted at 8.6, 14.1 and 43.2 GHz, respectively (Ott et al. 1994).
13
791. Phase and bandpass calibration were
achieved by observations toward the standard VLA calibrator 3C 84. Absolute flux calibration was obtained by measuring 3C 286, for which
flux densities of 5.11, 3.54 and 1.46 Jy were adopted at 8.6, 14.1 and 43.2 GHz, respectively (Ott et al. 1994).
The data were calibrated and reduced according to the standard NRAO Astronomical Image Processing system (AIPS). Using the AIPS task UVLIN, we
removed the contribution of the continuum in the uv-plane to obtain the spectral line data that were imaged and CLEANed. The B0218+357
continuum source is strong (see Sect. 3.1) so that several iterations of self calibration could be performed to improve the image quality and
to determine the phase and amplitude corrections which were applied to each spectral line channel. The data were converted into CLASS format
to perform the final analysis.
![\begin{figure}
\par\includegraphics[width=6.5cm,clip]{7353fig1.eps}
\end{figure}](/articles/aa/full/2007/35/aa7353-07/Timg23.gif) |
Figure 1:
H2CO energy level diagram up to 40 K above the ground state. Note the
"K-doublets'' in the
 ladder, that are the result
of the slight asymmetry of the molecule. For the six observed transitions that are marked by arrows (two J=2-1 ortho-H2CO rotational transitions,
one J=1-0 and one J=2-1 para-H2CO rotational transition and the J=1 and 2 K-doublet ortho-H2CO transitions), rest frequencies are given.
ladder, that are the result
of the slight asymmetry of the molecule. For the six observed transitions that are marked by arrows (two J=2-1 ortho-H2CO rotational transitions,
one J=1-0 and one J=2-1 para-H2CO rotational transition and the J=1 and 2 K-doublet ortho-H2CO transitions), rest frequencies are given. |
| Open with DEXTER |
The PdBI observations were carried out in the 5C2-array configuration (project G048) at frequencies of 83.601, 86.429 and 89.335 GHz (see
Table 1). The array was equipped with five 15-m antennas. At 83 GHz, amplitude calibration was obtained using the standard PdBI
calibrators 0415+379 and 0234+285 and adopting flux densities of 6.28 and 1.36 Jy. At 86 GHz, 3C 454.4, 3C 84 and 0415+379 with fluxes
of 6.14, 5.38, and 4.1 Jy were used. Amplitude calibration at 89 GHz was obtained measuring 2230+114 and 3C 84 and adopting fluxes of
7.97 and 4.64 Jy, respectively. For the phases, the standard PdBI calibrator 3C 84 was observed. The data were reduced using "Continuum
and Line Interferometer Calibration'' (CLIC) standard procedures. The calibration tables were fed into MAPPING to subtract the continuum
levels and to convert the data into CLASS format. Since B0218+357 is a strong continuum source (Sects. 1 and 3.1), we could perform self-calibration,
which significantly reduced formal phase and amplitude uncertainties.
Observations with the 100-m telescope at Effelsberg were carried out in September 1997 using a dual channel 9 cm wavelength HEMT receiver.
These measurements were done in a position switching mode with a three level autocorrelation spectrometer containing
 channels with a
bandwidth of 6.25 MHz. Pointing corrections could be determined toward B0218+357 itself and were found to be smaller than 10
channels with a
bandwidth of 6.25 MHz. Pointing corrections could be determined toward B0218+357 itself and were found to be smaller than 10
 .
Calibration was obtained from continuum cross-scans toward 3C 286.
.
Calibration was obtained from continuum cross-scans toward 3C 286.
Menten & Reid (1996) presented VLA A-array continuum maps of B0218+357 at 8.6 and 14.1 GHz. We have re-reduced their data along with
new A-array observations at 43.2 GHz. Figure 2 presents the three continuum images. The upper panel displays the 43.2 GHz map with the two
main radio continuum components A and B being well separated. The two components and traces of the ring (e.g. Mittal et al. 2006) are
seen in the central panel. These main features are less well separated in the lower panel, where the angular resolution is not quite as good.
Total flux densities including the Effelsberg and PdBI data as well as the VLA A-array flux density ratios between images A and B are given in
Table 2.
![\begin{figure}
\par\includegraphics[width=6.5cm,clip]{7353fig2.eps}
\end{figure}](/articles/aa/full/2007/35/aa7353-07/Timg26.gif) |
Figure 2:
VLA A-array continuum images of B0218+357 taken at Q-,
U-, and X-band ( top to bottom). In each image, the lowest contour line represents
four times the rms noise level, which is
 ,
2.1, and 0.5 mJy beam-1 for the Q-, U-, and X-band images, respectively. Contour levels
increase by a factor of 4 for the Q-band image and by a factor of 2 for the U- and the X-band images. Peak flux densities are 0.267, 0.99,
and 1.0 Jy beam-1. The full width to half maximum dimensions of the restoring beam are shown in the lower left corner of each panel.
The origin of each image is the phase center position given in Sect. 2.1. ,
2.1, and 0.5 mJy beam-1 for the Q-, U-, and X-band images, respectively. Contour levels
increase by a factor of 4 for the Q-band image and by a factor of 2 for the U- and the X-band images. Peak flux densities are 0.267, 0.99,
and 1.0 Jy beam-1. The full width to half maximum dimensions of the restoring beam are shown in the lower left corner of each panel.
The origin of each image is the phase center position given in Sect. 2.1. |
| Open with DEXTER |
All five formaldehyde lines we searched for are detected. Including the re-reduced
211-212 line reported by Menten & Reid (1996),
Fig. 3 shows all H2CO lines measured to date toward B0218+357. The upper two panels show "K-doublet'' lines. Rotational lines are shown
in the lower four panels. In order to minimize systematic calibration errors and to focus on physical parameters, line-to-continuum ratios are given
that provide a direct estimate of optical depths. Such ratios should also be free of problems related to variability of the calibrator, to variability
of B0218+357 itself (e.g., Biggs et al. 2001a,b) or to elevation dependent gain variations of the respective telescope(s).
Two of the measured H2CO transitions belong to the para and four to the ortho species (Fig. 3). Systematic differences between para
and ortho-H2CO lines are not apparent. Instead, there are obvious differences between the two K-doublet profiles measured at cm-wavelengths
and the four rotational transitions observed at mm-wavelengths. The former show line-to-continuum ratios that are far below unity, while the latter are
characterized by much higher line-to-continuum ratios. And while the former only show one velocity component, centered at about +6 km s-1,
the latter show a second component at about -7 km s-1. It is not clear whether this difference is intrinsic to the source or whether
it is merely an effect of limited signal-to-noise ratios in the K-doublet lines. Line parameters obtained by Gaussian fits are given in Table 3.
Menten & Reid (1996) found that absorption in the 2
11-212 line of ortho-H2CO is confined to source A. The 1
01-000
para-H2CO transition, that was measured with even higher angular resolution (see Table 1), yields the same result. There is no hint of
line absorption toward source B with a 3.1 km s-1 channel 3 upper limit to the line-to-continuum ratio of 0.39 (see also
Muller et al. 2007).
upper limit to the line-to-continuum ratio of 0.39 (see also
Muller et al. 2007).
Table 2:
Continuum flux densitiesa.
![\begin{figure}
\par\includegraphics[width=6.8cm,clip]{7353fig3.eps}
\end{figure}](/articles/aa/full/2007/35/aa7353-07/Timg37.gif) |
Figure 3:
H2CO lines observed toward B0218+357 and Gaussian fits. Given are line-to-continuum ratios (the entire continuum flux of B0218+357
was taken) as a function of heliocentric velocity adopting a redshift of z=0.68466. The labels in the lower left corner of each spectrum show
transition and rest frequency. O and P refer to ortho- and para-H2CO, respectively. |
| Open with DEXTER |
Table 2 indicates that the flux density of B0218+357 reaches a peak near 10 GHz. However, B0218+357 is a variable source (e.g.,
Biggs et al. 2001b) and our data were taken during a time interval of two years. In order to obtain a reliable radio continuum
spectrum, quasi-simultaneous observations at a number of frequencies are mandatory. Mittal et al. (2006) presented such observations
at five frequencies ranging from 1.65 to 15.35 GHz. The combined flux density of sources A and B (excluding the Einstein ring) reaches indeed
a peak near 10 GHz (0.8-0.9 Jy; Mittal et al. 2007). Our total fluxes (Table 2) include the ring and are thus higher.
The frequency range covered here by the continuum maps is larger than that of Mittal et al. (2006). Expecting systematically decreasing
flux densities beyond 15 GHz, our 85 GHz fluxes are consistent with the corresponding part of the continuum spectrum shown by Combes
& Wiklind (1997) and Combes et al. (1997) that suggest a spectral index of
 (
(
 ). The minimum in our "spectrum'' at 43.2 GHz (Table 2) may be caused by time variability or by a substantial amount
of missing flux. Among the data presented here, the 43.2 GHz Q-band map (Fig. 2) has the highest angular resolution so that all spatial
components except images A and B are resolved out.
). The minimum in our "spectrum'' at 43.2 GHz (Table 2) may be caused by time variability or by a substantial amount
of missing flux. Among the data presented here, the 43.2 GHz Q-band map (Fig. 2) has the highest angular resolution so that all spatial
components except images A and B are resolved out.
This might also affect our measured A/B flux density ratios. While A is located near the center of the Einstein ring, B is placed near its
northeastern edge. Thus estimated flux densities for B may be contaminated by Einstein ring emission at 8.6 and 14.1 GHz, but not at 43.2 GHz.
This would be consistent with lower ratios at the two lower frequencies. Nevertheless, our A/B flux density ratios, 3.3 (at 8.6 and 14.1 GHz)
and 3.5 (at 43.2 GHz) are, within the formal errors (see Table 2), consistent with a single value. Furthermore, they also lie
within the range of values obtained by Mittal et al. (2006; their Table 3 and Fig. 5b) for frequencies 8.4-15.4 GHz. Thus we confirm
that there is no evidence for a significant amount of free-free absorption between 8.6 and 43.2 GHz (see Mittal et al. 2007, for a model
of such an ionized absorbing layer).
Table 3 gives integrated (Col. 4) and peak (Col. 7) line-to-continuum ratios of the six lines shown in Fig. 3 as well
as the fractions of the total continuum flux originating from image A (Col. 8) and the resulting peak apparent optical depths (Col. 9). Assuming
that only image A is absorbed by a foreground molecular cloud (see Sects. 1 and 3.1, and Mittal et al. 2007) and that the coverage is
uniform, the rotational H2CO transitions have optical depths
 ,
while the K-doublet opacities are at least an order of
magnitude lower.
,
while the K-doublet opacities are at least an order of
magnitude lower.
Henkel et al. (2005) interpreted the trend of increasing optical depth of molecular lines with rising frequency in terms of a uniform
molecular absorber located toward the line-of-sight to the peak of a radio continuum source. In this scenario, the size of the continuum source
decreases with increasing frequency. In view of the trend in apparent optical depth that is obvious when comparing lines at dm-, cm- and
mm-wavelengths (e.g., Carilli et al. 1993; Menten & Reid 1996; Wiklind & Combes 1995) it may seem to be
surprising that the J=2-1 para-H2CO line, observed at a similar frequency as the corresponding ortho-lines is less optically thick
(Table 3). The difference may be caused by a high ortho- to para-H2CO abundance ratio or by a low excitation of the absorbing
molecular gas (see Combes et al. 1997 for CS excitation and Combes & Wiklind 1997 and Gerin et al. 1997 for
limits to the H2O and 13CO excitation). For ortho-H2CO, the J=2-1 lines are the lowest rotational transitions. Para-H2CO, however,
also has a J=1-0 line. Thus the J=2-1 para-H2CO line is not the lowest rotational line in its respective  ladder
(Fig. 1) and Table 3 shows indeed that the J=1-0 line has an optical depth that is similar to that of the J=2-1
line, in spite of the lower statistical weights of its two rotational states. However, it has to be emphasized that the assumption of a uniform
molecular cloud is highly unrealistic. The use of this assumption is only justified by the limited spatial resolution available when studying the
molecular content of a galaxy at redshift z=0.68.
ladder
(Fig. 1) and Table 3 shows indeed that the J=1-0 line has an optical depth that is similar to that of the J=2-1
line, in spite of the lower statistical weights of its two rotational states. However, it has to be emphasized that the assumption of a uniform
molecular cloud is highly unrealistic. The use of this assumption is only justified by the limited spatial resolution available when studying the
molecular content of a galaxy at redshift z=0.68.
Table 3:
H2CO line parametersa.
Sensitive high resolution continuum maps of image A at 8.4 GHz show a source of size
 mas2 that is edge-brightened on its
south-western side (Fig. 2 of Biggs et al. 2003). Tangential stretching by a factor of 3-4 along position angle PA -30
almost matches the elongation caused by a jet at PA +60.
At low frequencies (<8 GHz), the morphology of component A may be
affected by free-free absorption (Mittal et al. 2007). At higher frequencies, VLBI continuum measurements of B0218+357 have been made up
to 22 and 43 GHz (Porcas & Patnaik 1996; Porcas 2004), but sensitivities are not high enough to reveal additional spatial fine
structure. It would not be a surprise if the jet contribution would fade at higher frequencies leaving the tangentially stretched core that may coincide
in position with a spiral arm of the lensing galaxy (see Fig. 3 of York et al. 2005). Assuming that the core shows a brightness temperature
and flux density not drastically varying with frequency in the 10-100 GHz frequency range (e.g., Blandford & Königl 1979), its
solid angle would vary as
mas2 that is edge-brightened on its
south-western side (Fig. 2 of Biggs et al. 2003). Tangential stretching by a factor of 3-4 along position angle PA -30
almost matches the elongation caused by a jet at PA +60.
At low frequencies (<8 GHz), the morphology of component A may be
affected by free-free absorption (Mittal et al. 2007). At higher frequencies, VLBI continuum measurements of B0218+357 have been made up
to 22 and 43 GHz (Porcas & Patnaik 1996; Porcas 2004), but sensitivities are not high enough to reveal additional spatial fine
structure. It would not be a surprise if the jet contribution would fade at higher frequencies leaving the tangentially stretched core that may coincide
in position with a spiral arm of the lensing galaxy (see Fig. 3 of York et al. 2005). Assuming that the core shows a brightness temperature
and flux density not drastically varying with frequency in the 10-100 GHz frequency range (e.g., Blandford & Königl 1979), its
solid angle would vary as 

 (see also Lobanov 1998) between cm and mm-wavelengths. With a spectral
index of
(see also Lobanov 1998) between cm and mm-wavelengths. With a spectral
index of  -0.25 (Sect. 4.1) the mm-wave flux of B0218+357 is about half of that at cm-wavelengths, which is compatible with a fading
jet and a flat spectrum core.
-0.25 (Sect. 4.1) the mm-wave flux of B0218+357 is about half of that at cm-wavelengths, which is compatible with a fading
jet and a flat spectrum core.
To test the qualitative scenario outlined in Sect. 4.2.1 and to account for the background continuum morphology sketched in Sect. 4.2.2, we use Large
Velocity Gradient (LVG) models for para- and ortho-H2CO, accounting for the 41 and 40 lowest energy levels of each species up to 300 cm-1
above the ground state. We adopt collision rates from Green (1991) and assume a spherical cloud geometry. The choice of a particular cloud
geometry can affect the resulting densities up to half an order of magnitude, but only if the lines are optically thick. Applying a plane-parallel
instead of a spherical cloud geometry, resulting particle densities could be lower by up to this amount.
Since line shapes are identical within the limits of noise, we can try to reproduce the various peak optical depths of the main velocity component
displayed in Table 3. As we shell see, main constraints are obtained with the four ortho-H2CO transitions, while the para-H2CO lines serve as
a measure of ortho-to-para abundance ratios.
The simplest case, ignoring collisions:
As a first approach, we neglect collisional excitation as well as frequency dependent variations of the underlying continuum morphology (Sect. 4.2.2).
Since the data do not significantly constrain the temperature of the cosmic microwave background (CMB), we adopt
 = 2.73
  (1+z) K = 4.60 K =
 (
:
excitation temperature). Table 4 displays the resulting optical depths (Model I) with minimized reduced
(
:
excitation temperature). Table 4 displays the resulting optical depths (Model I) with minimized reduced  values of 7.1 for the four ortho- and 1.7 for the two para-H2CO transitions (/(N-P), N: number of lines, P: number
of free parameters;
values of 7.1 for the four ortho- and 1.7 for the two para-H2CO transitions (/(N-P), N: number of lines, P: number
of free parameters;
 = 2 (density and column density),
 (column density)). The total column density is N(H2CO)
 cm-2 and the ortho to para abundance ratio becomes 2.2. Modeled optical depths of the two para-H2CO transitions
are well within the 2
limits of the observational errors. For the two cm-wave K-doublet ortho-lines (see Fig. 1), however, modeled
opacities appear to be too high, while for the mm-wave J=2-1 lines modeled optical depths tend to be too low. Therefore the calculated ortho-values raise
some doubts about the quality of the fit.
cm-2 and the ortho to para abundance ratio becomes 2.2. Modeled optical depths of the two para-H2CO transitions
are well within the 2
limits of the observational errors. For the two cm-wave K-doublet ortho-lines (see Fig. 1), however, modeled
opacities appear to be too high, while for the mm-wave J=2-1 lines modeled optical depths tend to be too low. Therefore the calculated ortho-values raise
some doubts about the quality of the fit.
Table 4:
Optical depthsa.
Introducing collisional processes:
Toward B0218+357, neglecting collisions is a potentially realistic assumption, when analyzing diatomic or linear molecules with a CO-like energy level
scheme (see Combes & Wiklind 1997; Gerin et al. 1997; and Henkel et al. 2005), H2CO, however, critically responds to
collisional excitation even at very low densities. This is a consequence of the collisional cooling of the K-doublet lines (see e.g., Garrison et al.
1975) that sets in at densities as low as n(H2) 100 cm-3, while collisional heating of the rotational transitions is still far
from being significant. Collisional cooling of the 1
10-111 and 2
11-212 lines is rather independent of the chosen kinetic temperature as long
as
 K. Here we adopt
 K (Henkel et al. 2005). Reduced
values cause increased optical
depths in the K-doublet lines. As a consequence, the optical depths of the 1
10-111 K-doublet and the rotational ortho-H2CO lines become even more
similar than in model I and a reasonable fit cannot be obtained. This is exemplified for a density of n(H2) = 500 cm-3 in Model II of Table 4,
which is characterized by a reduced
value of 18.9 for the ortho-transitions. Higher densities, i.e. 500 cm-3 < n(H2) < 105 cm-3,
pose similar problems, while densities
K (Henkel et al. 2005). Reduced
values cause increased optical
depths in the K-doublet lines. As a consequence, the optical depths of the 1
10-111 K-doublet and the rotational ortho-H2CO lines become even more
similar than in model I and a reasonable fit cannot be obtained. This is exemplified for a density of n(H2) = 500 cm-3 in Model II of Table 4,
which is characterized by a reduced
value of 18.9 for the ortho-transitions. Higher densities, i.e. 500 cm-3 < n(H2) < 105 cm-3,
pose similar problems, while densities  105 cm-3 severely contradict additional constraints that have been discussed by Combes et al.
(1997), Gerin et al. (1997), and Henkel et al. (2005).
105 cm-3 severely contradict additional constraints that have been discussed by Combes et al.
(1997), Gerin et al. (1997), and Henkel et al. (2005).
A frequency dependent radio continuum morphology:
In view of the problems outlined above, the best way to reconcile observational and model data is to account for the frequency dependence of the continuum
morphology (Sect. 4.2.2). A background continuum source covering factor  ,
increasing with frequency, would (1) reduce the differences in optical depths
between the 1
10-111 K-doublet and J=2-1 rotational lines and would (2) raise the optical depth ratio of the K-doublet lines. At 137 GHz,
,
increasing with frequency, would (1) reduce the differences in optical depths
between the 1
10-111 K-doublet and J=2-1 rotational lines and would (2) raise the optical depth ratio of the K-doublet lines. At 137 GHz,
 for image A (Wiklind & Combes 1995). At 0.85 GHz, we get from the redshifted 1.7 GHz OH absorption lines and the continuum flux of the entire source
(Kanekar et al. 2003) a peak apparent optical depth of 0.01, implying that the covering factor
is 0.01. Assuming that
for image A (Wiklind & Combes 1995). At 0.85 GHz, we get from the redshifted 1.7 GHz OH absorption lines and the continuum flux of the entire source
(Kanekar et al. 2003) a peak apparent optical depth of 0.01, implying that the covering factor
is 0.01. Assuming that
 is reached at exactly 100 GHz, this corresponds to
 (choosing instead 70 or 130 GHz would yield similar exponents, i.e. 1.04
or 0.91). The lower
limit at 0.85 GHz is, however, too small. Firstly, the 1.667 and 1.665 GHz OH lines show the intensity ratio expected in the
optically thin limit at local thermodynamic equilibrium conditions (1.8:1). Therefore, unlike for CO, the OH optical depths are well below unity (
(choosing instead 70 or 130 GHz would yield similar exponents, i.e. 1.04
or 0.91). The lower
limit at 0.85 GHz is, however, too small. Firstly, the 1.667 and 1.665 GHz OH lines show the intensity ratio expected in the
optically thin limit at local thermodynamic equilibrium conditions (1.8:1). Therefore, unlike for CO, the OH optical depths are well below unity (
 ).
This increases the attainable line-to-continuum ratio in the optically thick case (i.e. the source covering factor) at 0.85 GHz by at least a factor of two and
yields
).
This increases the attainable line-to-continuum ratio in the optically thick case (i.e. the source covering factor) at 0.85 GHz by at least a factor of two and
yields
 .
Secondly, we also have to account for the fact that at low frequencies the Einstein ring becomes
prominent and that image A is not dominating the total flux density (for free-free absorption of image A, see Mittal et al. 2006). Only taking the
continuum flux from image A thus further raises the 0.85 GHz line to continuum ratio and
.
Secondly, we also have to account for the fact that at low frequencies the Einstein ring becomes
prominent and that image A is not dominating the total flux density (for free-free absorption of image A, see Mittal et al. 2006). Only taking the
continuum flux from image A thus further raises the 0.85 GHz line to continuum ratio and
 becomes a more realistic
estimate. This is a weaker frequency dependence than the hypothesized one for ,
the continuum solid angle (Sect. 4.2.2), but agrees with the observed
overall spectral index of the continuum radiation.
becomes a more realistic
estimate. This is a weaker frequency dependence than the hypothesized one for ,
the continuum solid angle (Sect. 4.2.2), but agrees with the observed
overall spectral index of the continuum radiation.
Table 5:
Optical depths accounting for source coveragea.
In order to study the case with an exponent for
of 0.5 that differs most from a scenario with a frequency independent
value,
Table 5 displays the -corrected observed optical depths as well as LVG model results for densities n(H2) = 0, 200, and 500 cm-3.
Excluding collisions (Model III), the two K-doublet lines show optical depths that are too similar for a good fit. Minimized reduced
values are 4.9 and 5.3 for the ortho and para-H2CO lines, respectively. A density of 200 cm-3 (Model IV) reproduces much better the K-doublet lines and
shows with reduced
values of 3.5 and 5.4 the highest probablity. Total H2CO column densities and ortho-to-para abundance ratios become
 13 cm-2 and 2.8. At higher densities we get the same effect as in the case of a frequency independent
value. Opacities of K-doublet and
rotational ortho-H2CO transitions slowly converge and
values gradually increase with rising density. Model V shows this for n(H2) = 500 cm-3,
while for n(H2) = 1000 and 3000 cm-3, reduced
values for the ortho-H2CO lines become 6.0 and 8.8, respectively. The significant difference
in the measured optical depths of the two J=2-1 lines of ortho-H2CO is not reproduced in any model and deserves observational confirmation.
13 cm-2 and 2.8. At higher densities we get the same effect as in the case of a frequency independent
value. Opacities of K-doublet and
rotational ortho-H2CO transitions slowly converge and
values gradually increase with rising density. Model V shows this for n(H2) = 500 cm-3,
while for n(H2) = 1000 and 3000 cm-3, reduced
values for the ortho-H2CO lines become 6.0 and 8.8, respectively. The significant difference
in the measured optical depths of the two J=2-1 lines of ortho-H2CO is not reproduced in any model and deserves observational confirmation.
From Table 5 it is apparent that the fits to the para-H2CO lines are almost independent of density, because rotational excitation is minimal at
the densities considered here. The LVG simulations of the para-H2CO lines in Models III, IV, and V are not as good as in Models I and II. While obviously not
being suitable for a reliable
determination, calculated opacities are still within
the 1 and 3
limits of the observed values for the
2
02-101 and 1
01-000 lines, respectively.
To summarize, the successful models (I, III, V, and particularly IV) agree well with each other, both with respect to column density and ortho-to-para abundance
ratio. The density of the gas is n(H2) < 103 cm-3, most likely 200 cm-3, supporting the view that the cloud is diffuse and has
peculiar physical parameters rarely found in the nearby universe (cf., Henkel et al. 2005). For the best scenario,
K (from NH3)
and n(H2) = 200 cm-3 (from H2CO), we have calculated excitation temperatures, assuming a cosmic background radiation of 4.6 K. In the optically thin case,
excitation temperatures of the three ground rotational transitions of CS, HCN, HNC, HCO+, and N2H+ are within 1% of the assumed CMB background temperature
and should thus be extremely useful for future measurements aiming at
as a function of redshift. Rare CO isotopomers, however, are not as useful.
There is a second velocity component, at -7 km s-1 (see Fig. 3 and Table 3), that is also apparent (mostly in the form of
skewed profiles) in transitions of other molecules (Wiklind & Combes 1995; Combes et al. 1997; Combes & Wiklind 1998; Kanekar
et al. 2003). The broad component seen in ammonia (NH3) at a heliocentric velocity of 0 km s-1 (Henkel et al. 2005 use Local
Standard of Rest (LSR) velocities, while here heliocentric velocities are given) is a superposition of hyperfine satellites of the +6 km s-1 and the
entire -7 km s-1 line and may thus serve as a rough measure of the relative importance of the two kinematic NH3 features. As is the case for
ammonia, the -7 km s-1 component of formaldehyde is too weak for detailed modeling but adds 15% to the resulting column densities given
in Tables 4 and 5.
The ortho-H2CO abundance appears to be slightly larger than that estimated by Menten & Reid (1996). Having carried out multiline studies
of ammonia (NH3) and formaldehyde toward B0218+357, we can now compare their abundances. For the total column densities (because of hyperfine splitting,
the components are not well separated in NH3) we find
N(H2CO) 0.6 N(NH3) (for NH3, Henkel et al. 2005). The
N(H2CO)/N(NH3) abundance ratio is four times smaller than the average ratio estimated for local diffuse clouds observed in absorption
(Liszt et al. 2006). In view of a possible overabundance of the more "primary'' 12C and 16O nuclei relative to the mainly "secondary''
14N nucleus in spiral galaxies of the distant past (see e.g., Wheeler et al. 1989 for a review on metallicity dependent CNO abundances)
this may seem to be surprising. However, the galactic H2CO abundances are based on two H2CO transitions (versus six here), while NH3 data are from
measurements of two spectral lines only (versus four in the case of B0218+357). For only a few diffuse clouds galactic NH3 absorption profiles have been
measured. Therefore the "local'' average ratio (see also Nash 1990) may be less certain than the ratio presented here for a single distant gravitational
lens alone. While our H2CO column density is 2.5 times higher than the highest column density among the sources summarized by Liszt et al. (2006),
our absorption profile is wider by at least this amount, thus yielding a similar column density
per km s-1 velocity interval. If H2CO is preferentially
formed on dust grains while NH3 is arising in the gas phase from either N+ or N (e.g., Liszt et al. 2006), a good correlation between the
abundances of the two molecules may not be expected.
An ortho-to-para abundance ratio of almost three and a kinetic temperature of 55 K (Henkel et al. 2005) are consistent with the correlation
between kinetic temperature and ortho-to-para abundance ratio shown in Fig. 10 of Kahane et al. (1984). Whether this indicates gas phase H2CO
formation in a warm medium or whether adsorption and desorption on grain surfaces can lead to efficient thermalization (Mangum & Wootten 1993)
remains to be seen.
The detection of six H2CO absorption lines toward the gravitational lens B0218+357 reveals surprisingly detailed information on molecular gas at redshift
z=0.68. Our analysis leads to the following main results:
- The continuum flux density ratio of component A to B is 3.4 between 8.6 and 43 GHz, does not vary significantly, and is thus not severely
affected by selective free-free absorption in this frequency range.
- The 1
01-000 line of para-H2CO is mainly absorbing the radio continuum from image A, consistent with previously published results from
the 2
11-212 line of ortho-H2CO.
- The H2CO column density of the main spectral feature is
 13 cm-2. The mm-wave lines show a second, blue-shifted
velocity component that is displaced by about 13 km s-1 from the main component. It contributes another 15% to the total column density.
13 cm-2. The mm-wave lines show a second, blue-shifted
velocity component that is displaced by about 13 km s-1 from the main component. It contributes another 15% to the total column density.
- The best fits to the ortho-H2CO molecular lines involve the assumption of a continuum cloud coverage that, between 0.85 and 100 GHz, is
likely frequency dependent (
 ).
).
- The gas density is n(H2) < 1000 cm-3, most likely 200 cm-3, confirming the view that the absorption is arising from
a diffuse molecular environment.
- With
 and n(H2) known, optically thin lines of the three ground rotational transitions of CS, HCN, HNC, HCO+, and N2H+(not CO) will be ideal measures of the cosmic microwave background at z=0.68.
- The total H2CO column density is about 60% of that obtained for NH3. This is four times below the average ratio deduced from local
galactic diffuse gas seen in absorption.
- The ortho-to-para H2CO abundance ratio is large (2.0-3.0), reflecting the kinetic temperature of the cloud. Whether this is caused by cloud
formation in a warm medium or whether this is due to efficient thermalization on dust grain mantles remains open.
Acknowledgements
We wish to thank C.M. Walmsley and an unknown referee for useful comments. N. Jethava was supported for this research through a stipend from the International Max Planck Research School (IMPRS) for Radio and Infrared Astronomy at the Universities of Bonn and Cologne. This research has made use of NASA's Astrophysical Data System.
- Biggs, A. D.,
Browne, I. W. A., Muxlow, T. W. B., & Wilkinson, P. N. 2001a,
MNRAS, 322, 821 [NASA ADS] (In the text)
- Biggs, A. D.,
Browne, I. W. A., & Wilkinson, P. N. 2001b, MNRAS, 323,
995 [NASA ADS] (In the text)
- Biggs, A. D.,
Wucknitz, O., Porcas, R. W., et al. 2003, MNRAS, 338, 599 [NASA ADS] (In the text)
- Blandford, R.
D., & Königl, A. 1979, ApJ, 232, 34 [NASA ADS] [CrossRef] (In the text)
- Browne, I. W. A.,
Patnaik, A. R., Walsh, D., & Wilkinson, P. N. 1993, MNRAS, 263,
L32 [NASA ADS] (In the text)
- Carilli, C. L.,
Rupen, M. P., & Yanny, B. 1993, ApJ, 412, L59 [NASA ADS] [CrossRef] (In the text)
- Cohen, J. G.,
Lawrence, C. R., & Blandford, R. D. 2003, ApJ, 583, 67 [NASA ADS] [CrossRef] (In the text)
- Combes, F., &
Wiklind, T. 1997, ApJ, 486, L79 [NASA ADS] [CrossRef] (In the text)
- Combes, F., &
Wiklind, T. 1998, A&A, 334, L81 [NASA ADS] (In the text)
- Combes, F.,
Wiklind, T., & Nakai, N. 1997, A&A, 327, L17 [NASA ADS] (In the text)
- Darling, J.,
& Wiklind, T. 2005, BAAS, 37, 1501 [NASA ADS] (In the text)
- Garrison, B.
J., Lester, W. A., Miller, W. H., & Green, S. 1975, ApJ, 200,
L75 [CrossRef] (In the text)
- Gerin, M., Phillips,
T. G., Benford, D. J., et al. 1997, ApJ, 488, L31 [NASA ADS] [CrossRef] (In the text)
- Green, S. 1991, ApJS,
76, 979 [NASA ADS] [CrossRef] (In the text)
- Henkel, C.,
Jethava, N., Kraus, A., et al. 2005, A&A, 440, 893 [NASA ADS] [CrossRef] [EDP Sciences] (In the text)
- Kahane, C., Lucas,
R., Frerking, M. A., Langer, W. D., & Encrenaz, P. 1984,
A&A, 137, 211 [NASA ADS] (In the text)
- Kanekar, N.,
Chengalur, J. N., de Bruyn, A. G., & Narasimha, D. 2003, MNRAS,
345, L7 [NASA ADS] (In the text)
- Liszt, H. S., Lucas,
R., & Pety, J. 2006, A&A, 448, 253 [NASA ADS] [CrossRef] [EDP Sciences] (In the text)
- Lobanov, A. P.
1998, A&A, 330, 79 [NASA ADS] (In the text)
- Mangum, J. G.,
& Wootten, A. 1993, ApJS, 89, 123 [NASA ADS] [CrossRef] (In the text)
- Menten, K. M.,
& Reid, M. J. 1996, ApJ, 465, L99 [NASA ADS] [CrossRef] (In the text)
- Mittal, R., Porcas,
R. W., Wucknitz, O., Biggs, A., & Browne, I. W. A. 2006,
A&A, 447, 515 [NASA ADS] [CrossRef] [EDP Sciences] (In the text)
- Mittal, R., Porcas,
R. W., & Wucknitz, O. 2007, A&A, 465, 405 [NASA ADS] [CrossRef] [EDP Sciences] (In the text)
- Muller, S.,
Guélin, M., Combes, F., & Wiklind, T. 2007, A&A, 468,
L53 [NASA ADS] [CrossRef] [EDP Sciences] (In the text)
- Nash, A. G. 1990, ApJS,
72, 303 [NASA ADS] [CrossRef] (In the text)
- O'Dea, C. P., Baum, S.
A., Stanghellini, C., et al. 1992, AJ, 104, 1320 [NASA ADS] [CrossRef] (In the text)
- Ott, M., Witzel, A.,
Quirrenbach, A., et al. 1994, A&A, 284, 331 [NASA ADS] (In the text)
- Patnaik, A. R.,
Browne, I. W. A., King, L. J., et al. 1993, MNRAS, 261, 435 [NASA ADS] (In the text)
- Porcas, R. W. 2004,
in The Role of VLBI in Astrophysics, Astrometry and Geodesy, ed. F.
Mantovani, & A. Kus (Kluwer Academic Publishers, The
Netherlands), 219
(In the text)
- Porcas, R. W.,
& Patnaik, A. R. 1996, in Extragalactic Radio Sources, ed. R.
Ekers, et al., IAU Symp., 175, 115
(In the text)
- Spergel, D. N.,
Verde, L., Peiris, H. V., et al. 2003, ApJS, 148, 175 [NASA ADS] [CrossRef]
- Stickel, M.,
& Kühr, H. 1993, A&AS, 101, 521 [NASA ADS] (In the text)
- Wheeler, J. C.,
Sneden, C., & Truran, J. W. 1989, ARA&A, 27, 279 [NASA ADS] (In the text)
- Wiklind, T.,
& Combes, F. 1995, A&A, 299, 382 [NASA ADS] (In the text)
- York, T., Jackson, N.,
Browne, I. W. A., Wucknitz, O., & Skelton, J. E. 2005, MNRAS,
357, 124 [NASA ADS] (In the text)
Copyright ESO 2007
![\begin{figure}
\par\includegraphics[width=6.5cm,clip]{7353fig1.eps}
\end{figure}](/articles/aa/full/2007/35/aa7353-07/img23.gif)
![\begin{figure}
\par\includegraphics[width=6.5cm,clip]{7353fig2.eps}
\end{figure}](/articles/aa/full/2007/35/aa7353-07/img26.gif)
![\begin{figure}
\par\includegraphics[width=6.8cm,clip]{7353fig3.eps}
\end{figure}](/articles/aa/full/2007/35/aa7353-07/img37.gif)