A&A 471, 941-949 (2007)
DOI: 10.1051/0004-6361:20077700
H. Lehmann1 - A. Tkachenko2 - L. Fraga1,3 - V. Tsymbal2,4 - D. E. Mkrtichian5,6
1 - Thüringer Landessternwarte Tautenburg, 07778 Tautenburg, Germany
2 - Tavrian National University, Dep. Astronomy, Simferopol, Ukraine
3 - Departamento de Física UFSC, CP 476, 88040-900
Florianópolis, SC, Brazil
4 - Institut für Astronomie, Unversität Wien, Türkenschanzstr. 17, 1180 Wien, Austria
5 - Astrophysical Research Center for the Structure and Evolution of the Cosmos,
Sejong University, Seoul 143-747, Korea
6 - Astronomical Observatory, Odessa National University, Shevchenko Park, Odessa 65014, Ukraine
Received 23 April 2007 / Accepted 7 June 2007
Abstract
Aims. We investigate the abundance distributions of silicon and iron on the surface of HR 7224 and check for the presence of magnetic fields. We try further to find an explanation for the observed Balmer line variations, alternative to that by surface temperature gradients given in a previous article.
Methods. Based on time series of more than 570 high-resolution spectra we investigate the abundance distribution of silicon and iron using the Doppler Imaging technique applying two independent program codes and using single and multiple components atmosphere models. We further calculate the combined effect of abundance changes of Si, Fe, and He on the H![]() line profile and compare it with the observations. The mean longitudinal magnetic field strength of HR 7224 is measured spectropolarimetrically.
line profile and compare it with the observations. The mean longitudinal magnetic field strength of HR 7224 is measured spectropolarimetrically.
Results. The Doppler Imaging analysis of HR 7224 shows the presence of large silicon and iron spots on the star's surface, large gradients of the abundances of these elements, and hints to enhanced line strengths near the visible pole of the star. The explanation of the observed Balmer line variations by inhomogeneous abundance distributions alone requires unrealistic large gradients of the helium abundance. Magnetic field measurements gave no definite results, a field strength of the order of +400 G is likely.
Conclusions. We can exclude the hypothesis that the hydrogen line profile variations of HR 7224 are caused by inhomogeneous abundance distributions of Fe, Si, and He alone or by pressure gradients like in the case of Ap stars. Still the observed variations can be described only by the combined effect of abundance and temperature gradients. In this case, the derived Doppler imaging maps will reflect also the temperature gradients and the surface will be cooler in regions of enhanced line strength like at the visible pole. At present state, the physical origin of possible surface temperature gradients remains unknown.
Key words: stars: chemically peculiar - stars: variables: general - stars: atmospheres - stars: abundances
HR 7224 (HD 177410, HIP 93187, EE Dra) is a rapidly rotating CP Si star. It was classified by Crawford (1963) and Cowley et al. (1969) as Ap0 star. The photometric variability of HR 7224 is known since a long time (Winzer 1974). The light curve shows a double wave (Adelman 1997) over the rotation period. A more detailed description of the history of HR 7224 observations is given in Lehmann et al. (2006, Paper I).
In Paper I we investigated the star spectroscopically. The work presented in Paper I was
stimulated by an article by Adelman (2004) where he supposed a drastic increase of the rotation period from 1 d to 100 d and of the photometric amplitude by a factor of six in the period
between 1996 and 2003. From our high-resolution spectra taken in 2005 we deduced a rotation
period of 1.12324 d. We found that HR 7224 has enhanced Si and Fe abundances whereas He is strongly
depleted. The double-wave shaped radial velocity (RV) and line profile variations (LPV) indicate
the presence of two large spots on opposite sides of the star. An unusual observation was that all
metal lines as well as the Balmer lines vary in strength. We compared the spectra from the rotation
phases where the star shows maximum line strength with those from the phases of minimum line
strength and tried to fit the observed Balmer and metal lines by synthetic spectra calculated from
adapted model atmospheres. We derived ![]() = 4.18 and
= 4.18 and ![]() = 100 km s-1. Results showed,
however, that it was not possible to fit the profiles of the Balmer lines in both phases by varying
the abundances of single chemical elements. Only if we assume different temperatures for the two
phases - 15 500 K for the phase of minimum and 14 500 K for the phase of maximum line
strength - were we able to fit the observations. From our atmosphere models we could confirm the
high photometric amplitude reported by Adelman (2004) for the star in 2003.
= 100 km s-1. Results showed,
however, that it was not possible to fit the profiles of the Balmer lines in both phases by varying
the abundances of single chemical elements. Only if we assume different temperatures for the two
phases - 15 500 K for the phase of minimum and 14 500 K for the phase of maximum line
strength - were we able to fit the observations. From our atmosphere models we could confirm the
high photometric amplitude reported by Adelman (2004) for the star in 2003.
Surface temperature inhomogeneities had been reported for only very few other stars in this
spectral range like for the fast rotating Ap star CU Vir (Kroll 1989) and for
![]() CVn (Böhm-Vitense & Van Dyk 1987). Authors found that
CVn (Böhm-Vitense & Van Dyk 1987). Authors found that ![]() CVn is cooler by 1000 K at the magnetic poles than at the equator and explain the observed photometric changes by a
non-spherically symmetric oblique rotator model. These results could not be confirmed by other
authors, however (Kuschnig et al. 1999; Kochukhov et al. 2002; see also Sect. 6). We have no physically convincing explanation for the existence of the temperature gradients on HR 7224 so far. Although we
showed in Paper I that the observed variations are compatible with the assumption that HR 7224 has
cool polar caps that are slightly inclined to the rotation axis, there is no direct analogy to the
scenario described by Böhm-Vitense & Van Dyk since the magnetic field is missing. There was
only one attempt to measure the magnetic field of HR 7224 by Bohlender et al. (1993) but without any findings. We used the possibility to get additional magnetic field measurements within a short run at the new spectropolarimeter at the BOES spectrograph (see Sect. 2).
CVn is cooler by 1000 K at the magnetic poles than at the equator and explain the observed photometric changes by a
non-spherically symmetric oblique rotator model. These results could not be confirmed by other
authors, however (Kuschnig et al. 1999; Kochukhov et al. 2002; see also Sect. 6). We have no physically convincing explanation for the existence of the temperature gradients on HR 7224 so far. Although we
showed in Paper I that the observed variations are compatible with the assumption that HR 7224 has
cool polar caps that are slightly inclined to the rotation axis, there is no direct analogy to the
scenario described by Böhm-Vitense & Van Dyk since the magnetic field is missing. There was
only one attempt to measure the magnetic field of HR 7224 by Bohlender et al. (1993) but without any findings. We used the possibility to get additional magnetic field measurements within a short run at the new spectropolarimeter at the BOES spectrograph (see Sect. 2).
The large amplitude of the rotational RV variation of ![]() 6 km s-1 makes the star an ideal
candidate for Doppler Imaging (DI) analysis. The spectrum of HR 7224 is dominated by the Si II
and Fe II lines. We apply the DI technique to HR 7224 to get a more detailed picture of the
surface abundance distributions of the corresponding chemical elements. In particular we want to
confirm the presence of the two large spots on opposite sides of the star and the possible
existence of polar caps as suspected from the RV and equivalent width (EW) analysis in Paper I. We try further to establish an atmospheric model that explains the observed LPV of the Balmer lines in an alternative way without assuming large temperature gradients on the stellar surface.
6 km s-1 makes the star an ideal
candidate for Doppler Imaging (DI) analysis. The spectrum of HR 7224 is dominated by the Si II
and Fe II lines. We apply the DI technique to HR 7224 to get a more detailed picture of the
surface abundance distributions of the corresponding chemical elements. In particular we want to
confirm the presence of the two large spots on opposite sides of the star and the possible
existence of polar caps as suspected from the RV and equivalent width (EW) analysis in Paper I. We try further to establish an atmospheric model that explains the observed LPV of the Balmer lines in an alternative way without assuming large temperature gradients on the stellar surface.
Line profile analysis. For Doppler Imaging (DI) and Balmer lines analysis we used 577 high-resolution spectra of HR 7224 obtained with the coudé-echelle-spectrograph at the 2-m telescope at the Thüringer Landessternwarte in 2005 and a few spectra taken with the fiber-fed Bohyunsan Observatory Echelle Spectrograph (BOES, Kim et al. 2002, 2007) at the 1.8-m telescope at the Bohyunsan Optical Astronomy Observatory (BOAO). Tautenburg spectra have a spectral resolution of 63 000 and cover a wavelength range from 4760 Å to 7400 Å whereas the BOES spectra have a resolution of 45 000 and range from 3600 Å to 10 500 Å. A detailed description of observations and data reduction can be found in Paper I.
Magnetic field measurement.
High resolution (R = 60 000) circular polarization spectra have been obtained on February 28 in
2007 with the new spectropolarimetric device at the BOES. Each observation consists of a pair of
two consecutive exposures at two orthogonal orientations (![]()
![]() of the quarter-wave
plate. We obtained two observations (four spectra) of HR 7224 and two observations (four spectra) of
the magnetic field standard star
of the quarter-wave
plate. We obtained two observations (four spectra) of HR 7224 and two observations (four spectra) of
the magnetic field standard star ![]() CVn for comparison. The reduction of the BOES spectra was done
with the BOES automatic image processing package.
CVn for comparison. The reduction of the BOES spectra was done
with the BOES automatic image processing package.
For the measurement of the mean longitudinal magnetic field
![]() we used 23 metal lines in the
4100-8870 Å range having depths stronger than 0.1 of the continuum level. The magnetic
field strength was determined from the displacement of the centers of gravity of the Zeeman-shifted
lines measured from the spectra of opposite circular polarization (e.g. Landstreet 1980; Monin 2002). It is
we used 23 metal lines in the
4100-8870 Å range having depths stronger than 0.1 of the continuum level. The magnetic
field strength was determined from the displacement of the centers of gravity of the Zeeman-shifted
lines measured from the spectra of opposite circular polarization (e.g. Landstreet 1980; Monin 2002). It is
 |
(1) |
The rapid rotation of the star (![]() = 100 km s-1) and the small number of spectra and measurable
lines (due to blending and the low SN of weak lines) do not permit to measure the magnetic field
of HR 7224 with high accuracy. From the two observations we obtain 500
= 100 km s-1) and the small number of spectra and measurable
lines (due to blending and the low SN of weak lines) do not permit to measure the magnetic field
of HR 7224 with high accuracy. From the two observations we obtain 500 ![]() 590 G and 350
590 G and 350 ![]() 680 G. The weighted mean longitudinal magnetic field from both measurements is 430
680 G. The weighted mean longitudinal magnetic field from both measurements is 430 ![]() 450 G and
corresponds to a rotation phase of
450 G and
corresponds to a rotation phase of ![]() = 0.529 according to the epoch of maximum RV of
2 453 520.51
= 0.529 according to the epoch of maximum RV of
2 453 520.51 ![]() 1.123248 E as derived in Paper I.
1.123248 E as derived in Paper I.
For ![]() CVn we obtained two measurements of 840
CVn we obtained two measurements of 840 ![]() 110 G and 1090
110 G and 1090 ![]() 50 G at the mean epoch HJD 2 454 160.1133 corresponding to phase
50 G at the mean epoch HJD 2 454 160.1133 corresponding to phase ![]() = 0.5096 of the ephemeris given by Farnsworth (1932). These measurements are in good agreement with the value of +900 G expected for the iron lines (Fig. 5 in Wade et al. 2002) and confirm the absence of larger systematic instrumental effects. More detailed results on the quality of the new instrument will be based on more extended measurements of the magnetic field of
= 0.5096 of the ephemeris given by Farnsworth (1932). These measurements are in good agreement with the value of +900 G expected for the iron lines (Fig. 5 in Wade et al. 2002) and confirm the absence of larger systematic instrumental effects. More detailed results on the quality of the new instrument will be based on more extended measurements of the magnetic field of ![]() CVn and will be published in a forthcoming paper.
CVn and will be published in a forthcoming paper.
If a star rotates rapidly enough so that the shape of its line profiles is dominated by rotational
Doppler broadening, a high degree of correlation exists between the position of any distortion
within a line profile and the position of the corresponding local deviation from the mean on the
stellar surface (Vogt et al. 1987). DI tries to reconstruct the two-dimensional stellar surface structure from a set of one-dimensional images delivered by a time series of spectra. This is possible in principle if the rotation rate and the inclination of the star are within certain
limits. The star has to rotate fast enough so that the profile is dominated by Doppler broadening
(the number of resolvable elements on the surface increases with increasing ![]() )
but it must not be
rotating so fast so that lines free of blends cannot be found in its spectrum. Both limits depend on spectral type. HR 7224, where
)
but it must not be
rotating so fast so that lines free of blends cannot be found in its spectrum. Both limits depend on spectral type. HR 7224, where ![]() is in the order of 100 km s-1, is close to the upper end of
this velocity scale. The second criterion is that the inclination of the rotation axis of the
star is not too large. For
is in the order of 100 km s-1, is close to the upper end of
this velocity scale. The second criterion is that the inclination of the rotation axis of the
star is not too large. For
![]() the north-south ambiguity as to which hemisphere a surface
feature is on is large and results in Doppler images that have mirror-image symmetry about the
stellar equator (Vogt et al. 1987).
the north-south ambiguity as to which hemisphere a surface
feature is on is large and results in Doppler images that have mirror-image symmetry about the
stellar equator (Vogt et al. 1987).
DI inversion is a so-called ill-posed problem that possesses an infinite number of solutions. To find a unique solution, the inverse problem must be regularized (Piskunov & Kochukhov 2002). For the DI analysis, we used two different programs, MAXENT (Vogt et al. 1987; Hatzes et al. 1989) and INVERS8 (Piskunov & Rice 1993). The application of MAXENT was our first attempt to get a more detailed picture of the surface structure of HR 7224. It uses the maximum entropy method (MEM) and ends up with a surface map in terms of equivalent widths (EWs) that shows a minimum correlation between the surface elements (Piskunov et al. 1990). Since the obtained EW distribution cannot be directly translated into an abundance distribution MAXENT is not as well suited for our purposes as the INVERS8 code and its results are superseded by the results of the more modern code. Nevertheless we present the basic MAXENT results for comparison, mainly to show the influence of the regularization parameter on the results.
INVERS8 uses Tikhonov regularization that delivers results in the sense of the smoothest map in terms of stellar surface abundances that is possible to fit the observations at a certain level. Both programs use pre-calculated spectra of synthetic intrinsic (rotational un-broadened) lines based on atmosphere models (Fig. 1). We used LLmodels by Shulyak et al. (2004) for the computation of atmosphere models and SynthV by Tsymbal (1996) for the computation of synthetic line spectra. Both programs allow to use individual abundance patterns.
MAXENT and INVERS8 were applied to the same data set. To reduce the influence of blends (due to
the large ![]() of HR 7224 almost all lines are blended with Fe II lines) we decided to use only
the strongest Si II lines where blends with other metal lines can be neglected. The data set
was built by averaging the 577 line profiles of the Si II lines at 5041, 5056, 6347, and
6371 Å into 25 equally spaced rotation phase bins each. For one single spectrum the typical
continuum SN ratio is 140, for one phase binned spectrum we can estimate it is about 5 times higher.
Additionally, we investigated the Fe II 5316 Å line with INVERS8.
of HR 7224 almost all lines are blended with Fe II lines) we decided to use only
the strongest Si II lines where blends with other metal lines can be neglected. The data set
was built by averaging the 577 line profiles of the Si II lines at 5041, 5056, 6347, and
6371 Å into 25 equally spaced rotation phase bins each. For one single spectrum the typical
continuum SN ratio is 140, for one phase binned spectrum we can estimate it is about 5 times higher.
Additionally, we investigated the Fe II 5316 Å line with INVERS8.
![\begin{figure}
\par\includegraphics[height=4.6cm,width=6.1cm,clip]{7700f01a.eps}...
...*{3mm}
\includegraphics[height=4.6cm,width=6.1cm,clip]{7700f01b.eps}\end{figure}](/articles/aa/full/2007/33/aa7700-07/img26.gif) |
Figure 1:
Intrinsic line profiles calculated with LLmodels and SynthV for
|
| Open with DEXTER | |
The number of stellar surface resolution elements that can be handled by the DI programs is
limited only by the amount of computing time that we will allow for. The real resolution that can
be obtained is given by stellar properties. To first order, the number of resolution elements
across the visible disk will be
 |
(2) |
MAXENT uses MEM to derive the optimum DI solution. A detailed description can be found in Vogt et al. (1987) and in Hatzes et al. (1989). The program maps the line strengths in terms of relative EWs on the stellar surface. Free parameters are the inclination of the rotation
axis and the equatorial rotation velocity. In the following, abundance values are given as
![]() (element) =
(element) =
![]() .
.
In the version of the program used, we require intrinsic line profiles that are symmetric about the line centers. This was the reason that we did not apply MAXENT to the iron line (see Fig. 1). Synthetic intrinsic line profiles were generated
for each of the silicon lines using LLmodels and SynthV with the model atmosphere parameters
![]() = 14 500 K,
= 14 500 K, ![]() = 4.18,
= 4.18,
![]() = -3.0,
= -3.0,
![]() = -3.5. In the case of the silicon lines the weak blended iron lines were deleted and replaced by a smooth
line through the blank space. Then the line was folded about the line center and an average profile,
symmetric about the line center was drawn. DI maps
were computed for a grid of values of
= -3.5. In the case of the silicon lines the weak blended iron lines were deleted and replaced by a smooth
line through the blank space. Then the line was folded about the line center and an average profile,
symmetric about the line center was drawn. DI maps
were computed for a grid of values of ![]() and inclination angles i. The criterion of the
goodness of the fit was the mean rms of the O-C values for all 25 profiles. The minimum was found
for
and inclination angles i. The criterion of the
goodness of the fit was the mean rms of the O-C values for all 25 profiles. The minimum was found
for ![]() = 100
= 100 ![]() 3 km s-1 and i = 65
3 km s-1 and i = 65![]()
![]() 5
5![]() .
.
The finally derived EW map for the Si II 6347 Å line is shown in Fig. 2. The local EW scale ![]() is in relative units calculated from
is in relative units calculated from
 |
(3) |
The derived map is very detailed, much more detailed than we would expect from our estimations in
Sect. 4.1 based on Eq. (2) and the given ![]() and the FWHM of the intrinsic line profiles
(Fig. 1). The program ends up with such a detailed map because it tries to best fit the observed
line profiles within a limit given by the observed signal-to-noise. Besides
the alternating regions of high and low line strength in the equator region, MAXENT calculates
enhanced line strengths at the pole that directs to the observer. The reason is that the deep cores
of the observed line profiles can be fitted only by assuming an elemental
concentration at the pole where the variation due to rotation is lowest (see next section).
and the FWHM of the intrinsic line profiles
(Fig. 1). The program ends up with such a detailed map because it tries to best fit the observed
line profiles within a limit given by the observed signal-to-noise. Besides
the alternating regions of high and low line strength in the equator region, MAXENT calculates
enhanced line strengths at the pole that directs to the observer. The reason is that the deep cores
of the observed line profiles can be fitted only by assuming an elemental
concentration at the pole where the variation due to rotation is lowest (see next section).
![\begin{figure}
\par\includegraphics[height=8.4cm,width=4.7cm,angle=-90,clip]{7700f02.eps}\end{figure}](/articles/aa/full/2007/33/aa7700-07/img36.gif) |
Figure 2: Surface map (Mercator projection) of the Si II 6347 Å line strengths in terms of relative EWs derived with MAXENT. The relative EW scale (see text) spans -0.15 (white) to +0.30 (black). |
| Open with DEXTER | |
![\begin{figure}
\par\includegraphics[height=8.3cm,width=4cm,angle=90,clip]{7700f0...
...ncludegraphics[height=8.5cm,width=4.5cm,angle=90,clip]{7700f04f.eps}\end{figure}](/articles/aa/full/2007/33/aa7700-07/img37.gif) |
Figure 3:
Stellar surface abundance maps in Mercator projection obtained with INVERS8 from the
single atmosphere model with different regularization parameters and
|
| Open with DEXTER | |
![\begin{figure}
\includegraphics[angle=90,width=8.3cm,clip]{7700f05a.eps}\hspace*{4mm}
\includegraphics[angle=90,width=8.3cm,clip]{7700f05b.eps}\end{figure}](/articles/aa/full/2007/33/aa7700-07/img38.gif) |
Figure 4:
Stellar surface abundance maps in spherical projection for Si II
and Fe II using the same atmospheric parameters as in Fig. 3 and |
| Open with DEXTER | |
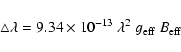
INVERS8 uses a computational algorithm that inverts the time-series of spectral line profiles into
surface maps of chemical abundances. It minimizes the expression
 |
(4) |
 |
(5) |
INVERS8 uses pre-calculated local intrinsic line profiles, calculated for set of abundances and a
given atmosphere model. Input parameters are
![]() ,
,
![]() ,
abundance
,
abundance ![]() ,
equatorial
velocity v, inclination of the rotation axis i, and
,
equatorial
velocity v, inclination of the rotation axis i, and ![]() .
Most parameters were determined
in Paper I;
.
Most parameters were determined
in Paper I;
![]() and
and ![]() from the hydrogen line profiles,
from the hydrogen line profiles, ![]() and mean values of the metal
abundances from the metal lines. For the determination of the helium abundance we used the BOES
spectra that cover a larger wavelength range towards the blue spectral region. We computed a set of
atmosphere models with the parameters
and mean values of the metal
abundances from the metal lines. For the determination of the helium abundance we used the BOES
spectra that cover a larger wavelength range towards the blue spectral region. We computed a set of
atmosphere models with the parameters
![]() = 14 000 K, 14 500 K, 15 500 K,
= 14 000 K, 14 500 K, 15 500 K, ![]() = 4.2,
= 4.2,
![]() = 100 km s-1. From these model we calculated the local line profiles for a set of different Si
and Fe abundances. Using the INVERS8 code we then computed the maps of iron and silicon abundance
distributions on the stellar surface. The best solution was found for the
model with the parameters
= 100 km s-1. From these model we calculated the local line profiles for a set of different Si
and Fe abundances. Using the INVERS8 code we then computed the maps of iron and silicon abundance
distributions on the stellar surface. The best solution was found for the
model with the parameters
![]() = 14 500 K, i = 65
= 14 500 K, i = 65![]() ,
,
![]() = -3.5,
= -3.5,
![]() = -3.5,
= -3.5,
![]() = -4.0.
= -4.0.
Figure 3 shows Si and Fe abundance maps for different values of the regularization
parameter ![]() .
It should be chosen so that the minimization does not overfit the data, i.e. so that the discrepancy between the observed and the predicted data is of the same order as the errors of measurement. For silicon, the upper, low-resolution map (
.
It should be chosen so that the minimization does not overfit the data, i.e. so that the discrepancy between the observed and the predicted data is of the same order as the errors of measurement. For silicon, the upper, low-resolution map (![]() = 0.01) is in good agreement with the surface structure that was roughly estimated in Paper I. The stellar surface is dominated by two large, abundance enriched spots on opposite sides and at nearly the same latitude of about +20
= 0.01) is in good agreement with the surface structure that was roughly estimated in Paper I. The stellar surface is dominated by two large, abundance enriched spots on opposite sides and at nearly the same latitude of about +20![]() .
It is the simplest solution that can explain the basic shape of the observed
double-wave in the RV and EW variations of HR 7224. Figure 5 shows the line profiles calculated for
.
It is the simplest solution that can explain the basic shape of the observed
double-wave in the RV and EW variations of HR 7224. Figure 5 shows the line profiles calculated for
![]() = 0.01. It shows that the calculated profiles are not deep enough to fit the cores of the
observed profiles. We think that this is due to the low resolution of the resulting DI map. The line cores are filled up only for smaller
= 0.01. It shows that the calculated profiles are not deep enough to fit the cores of the
observed profiles. We think that this is due to the low resolution of the resulting DI map. The line cores are filled up only for smaller ![]() where also structures in the polar region of the star can be resolved.
where also structures in the polar region of the star can be resolved.
Our estimation of the possible resolution of about ![]() in longitude for the Si II lines would correspond to a surface map having a resolution more to the middle (
in longitude for the Si II lines would correspond to a surface map having a resolution more to the middle (![]() = 0.001) than to the lower (
= 0.001) than to the lower (![]() = 0.0001) panel of Fig. 3. Since the lower panel shows a resolution similar to that obtained with MAXENT we will consider this as the final one, although the results may be slightly over-fitted. As in case of the MAXENT results, the line centers are filled up here by the almost non-varying local contributions from the region around the visible pole.
= 0.0001) panel of Fig. 3. Since the lower panel shows a resolution similar to that obtained with MAXENT we will consider this as the final one, although the results may be slightly over-fitted. As in case of the MAXENT results, the line centers are filled up here by the almost non-varying local contributions from the region around the visible pole.
Figure 4 shows the abundance distributions for Si and Fe in
spherical projection. For silicon, the surface is characterized by two broad regions of lower
abundance that divide the equatorial region into four broad regions of alternating lower and higher
abundance and give the regions of higher abundance an U-shaped form lying across the upper pole.
The abundance is at maximum in the polar region itself. Because of the inclination of the rotation
axis of ![]() we can gather no information on the abundance distribution in the region around the other pole.
we can gather no information on the abundance distribution in the region around the other pole.
The derived iron abundance distribution roughly resembles this picture although the obtained structures are not as well defined. The maximum differences in abundance with 1.13 dex for Si and 1.32 dex for Fe are comparable.
![\begin{figure}
\par\includegraphics[height=2.5cm,width=9.35cm,angle=90,clip]{770...
...cludegraphics[height=2.5cm,width=9.35cm,angle=90,clip]{7700f03c.eps}\end{figure}](/articles/aa/full/2007/33/aa7700-07/img46.gif) |
Figure 5:
Comparison between observed (solid) and
computed (dash-dotted) line profiles derived with INVERS8 and |
| Open with DEXTER | |
![\begin{figure}
\par\includegraphics[width=7.55cm,clip]{7700f06.eps}\end{figure}](/articles/aa/full/2007/33/aa7700-07/img47.gif) |
Figure 6:
Change of the stellar structure due to different abundances. Temperature versus Rosseland
opacity calculated for
|
| Open with DEXTER | |
![\begin{figure}
\par\includegraphics[angle=90,width=8.15cm,clip]{7700f07a.eps}\par\includegraphics[angle=90,width=8.15cm,clip]{7700f07b.eps}\end{figure}](/articles/aa/full/2007/33/aa7700-07/img48.gif) |
Figure 7: Maps showing the difference of elemental abundances: multiple minus single components atmosphere model. |
| Open with DEXTER | |
The DI mapping of HR 7224 shows large abundance gradients for all silicon lines and the one iron line
used. These gradients change the stellar atmosphere structure in the line formation regions. In
Fig. 6 we calculated the temperature in the stellar atmosphere for different Si and
Fe abundances. Compared to the
![]() = -3.5,
= -3.5,
![]() = -3.5 abundances (solid curve) the temperature increases with increasing silicon abundance (dotted curve) and shows slightly more complex deviations if we change the iron abundance (dashed curve). The change of the stellar atmosphere structure can influence the DI results and we have to consider this influence when we calculate the tables of local line profiles.
= -3.5 abundances (solid curve) the temperature increases with increasing silicon abundance (dotted curve) and shows slightly more complex deviations if we change the iron abundance (dashed curve). The change of the stellar atmosphere structure can influence the DI results and we have to consider this influence when we calculate the tables of local line profiles.
As stated above, INVERS8 uses pre-calculated tables of local line profiles, calculated for a set of
abundances and a given atmosphere model. We have modified this part of the program by including
a multiple-component atmosphere model. In case of HR 7224 we included atmospheres with
![]() = 14 500 K,
= 14 500 K, ![]() = 4.2,
= 4.2,
![]() = -3.5, -3.0, -2.5 and
= -3.5, -3.0, -2.5 and
![]() = -4.0, -3.5, -3.25. Starting with a single atmosphere model, we calculated a first abundance map. Then we recalculated the tables of local line profiles by using different atmosphere models for the different abundances obtained from the first DI map. Then the DI procedure was repeated.
= -4.0, -3.5, -3.25. Starting with a single atmosphere model, we calculated a first abundance map. Then we recalculated the tables of local line profiles by using different atmosphere models for the different abundances obtained from the first DI map. Then the DI procedure was repeated.
The resulting abundance distribution maps can be hardly distinguished by eye from the corresponding single component maps. We therefore only show, in Fig. 7, the differences between the distributions. The difference in silicon abundance is very small and of only 0.04 in maximum. The difference in iron abundance reaches a total amplitude of 0.1. Thus the application of the multiple components atmosphere model does not change in principle the surface abundance distributions obtained with the single components model.
In Paper I we reported that HR 7224 shows a variability of the hydrogen line profiles during
different rotation phases. This variability could not be explained by any spot-like abundance
distribution of single elements. It could be shown, however, that the observed variability is in
agreement with the assumption of different values of the effective temperature in different
rotation phases (
![]() = 15 500 K for the phase of minimum and
= 15 500 K for the phase of minimum and
![]() = 14 500 K for the phase of
maximum line strength).
= 14 500 K for the phase of
maximum line strength).
This explanation is non-convincing, in so far as no physical reason for such an inhomogeneous
surface temperature distribution is known for this type of star. The most likely reason could be
magnetic fields, although in this case we would expect rather a variation of ![]() than of
than of
![]() like in case of the Ap stars. As an additional test for the existence of Lorentz forces due to
magnetic fields, we computed the standard deviation
like in case of the Ap stars. As an additional test for the existence of Lorentz forces due to
magnetic fields, we computed the standard deviation ![]() of the H
of the H![]() line profiles compared to the mean profile from all rotation phases. If the stellar structure is disturbed due to the
presence of non force-free magnetic fields,
line profiles compared to the mean profile from all rotation phases. If the stellar structure is disturbed due to the
presence of non force-free magnetic fields, ![]() should reveal the characteristic fingerprint
as the impact of the Lorentz force: the amplitude rises in the wings and drops to the line center
(Kroll 1989; Valyavin et al. 2004, 2005; Shulyak et al. 2007). From Fig. 8 we see that
HR 7224 does not show the characteristic dip in the line center. Thus we can be relatively sure that
HR 7224 shows no changes of
should reveal the characteristic fingerprint
as the impact of the Lorentz force: the amplitude rises in the wings and drops to the line center
(Kroll 1989; Valyavin et al. 2004, 2005; Shulyak et al. 2007). From Fig. 8 we see that
HR 7224 does not show the characteristic dip in the line center. Thus we can be relatively sure that
HR 7224 shows no changes of ![]() from the magnetic pole to the equator caused by Lorentz forces.
from the magnetic pole to the equator caused by Lorentz forces.
![\begin{figure}
\par\includegraphics[width=6.15cm,clip]{7700f08.eps}\end{figure}](/articles/aa/full/2007/33/aa7700-07/img50.gif) |
Figure 8:
Standard deviation of the H |
| Open with DEXTER | |
![\begin{figure}
\includegraphics[width=6.35cm,clip]{7700f09a.eps}\vspace*{-2mm}
\...
...eps}\vspace*{-2mm}
\includegraphics[width=6.35cm,clip]{7700f09d.eps}\end{figure}](/articles/aa/full/2007/33/aa7700-07/img51.gif) |
Figure 9:
Solid curves: difference between the H |
| Open with DEXTER | |
In Fig. 9 we compare the observed difference of the H![]() line profiles between
the phases of maximum and minimum line strength with the difference computed from several model
atmospheres. Table 1 lists the parameters of the models used. Model I assumes that the
temperature is the only parameter that changes. Figure 9 (top) shows that the observed
difference in line profiles cannot be explained by temperature effects alone. It can work only in
combination with elemental abundance changes.
line profiles between
the phases of maximum and minimum line strength with the difference computed from several model
atmospheres. Table 1 lists the parameters of the models used. Model I assumes that the
temperature is the only parameter that changes. Figure 9 (top) shows that the observed
difference in line profiles cannot be explained by temperature effects alone. It can work only in
combination with elemental abundance changes.
In the following, we will try to find out if abundance changes alone can explain the Balmer line
variations. In model II to IV we fixed
![]() to 14 500 K. Model II assumes that the silicon and
iron abundances vary in a maximum range that is compatible to the results of DI mapping. The
helium abundance is fixed to the very low value as derived in Paper I. The resulting curve
(Fig. 9, second panel) shows the right shape but does not reach the necessary
amplitude. This result is in agreement with the results obtained in Paper I.
to 14 500 K. Model II assumes that the silicon and
iron abundances vary in a maximum range that is compatible to the results of DI mapping. The
helium abundance is fixed to the very low value as derived in Paper I. The resulting curve
(Fig. 9, second panel) shows the right shape but does not reach the necessary
amplitude. This result is in agreement with the results obtained in Paper I.
Table 1:
Parameters of the four different models for fitting the H![]() line at phases of minimum and maximum line strength (
line at phases of minimum and maximum line strength (![]() = 4.2).
= 4.2).
The helium lines of HR 7224 are very faint and do not allow for a direct investigation of their variations. Despite this faintness, we cannot exclude that there exist helium-enriched spots on the star since they must not give rise to much stronger lines if observed in disk-integrated light. In model III we vary only the helium abundance, between the mean observed value of 0.001 and solar abundance of 0.07834. From Fig. 9, third panel, we can see that the computed variation shows the right shape and reaches almost the necessary amplitude. In our last model IV we vary the abundances of silicon and iron in the maximum range that is compatible with the results if DI mapping and the helium abundance from the observed one to solar abundance. Results show (Fig. 9, bottom panel) that it is possible to fit the observations in this way. The necessary amplitude of the He abundance variation is very large, however.
The observed LPV of the silicon and iron lines has been used to produce surface abundance maps of HR 7224 at different resolutions. In the simplest case, obtained at the lowest resolution, the maps are in good agreement with those expected in Paper I from the double-wave shaped RV and EW variations with rotation. The line cores of the Si II lines are not fitted, however. At higher resolution the line cores are filled up with enhanced contributions from the polar region of the star.
The belts of lower abundance at about ![]() latitude are present only in the MAXENT map and cannot be found in the INVERS8 map. There are
several possible explanations. The relatively large inclination of the rotation axis of the star of
latitude are present only in the MAXENT map and cannot be found in the INVERS8 map. There are
several possible explanations. The relatively large inclination of the rotation axis of the star of
![]() is close to the estimated limit where the north-south ambiguity is
too large to give reasonable results (see Sect. 4.1). This could effect the results obtained
with MAXENT because the
is close to the estimated limit where the north-south ambiguity is
too large to give reasonable results (see Sect. 4.1). This could effect the results obtained
with MAXENT because the ![]() latitude where the additional belts occur corresponds to the
center latitude of the observed disk.
Also an over-fitting of the line profiles or the removing of the weak line blends and the
symmetrization of the synthetic intrinsic line profiles (Sect. 4.2) may result in such spurious structures that normally
should be washed out according to the estimated possible resolution (Sect. 4.1).
latitude where the additional belts occur corresponds to the
center latitude of the observed disk.
Also an over-fitting of the line profiles or the removing of the weak line blends and the
symmetrization of the synthetic intrinsic line profiles (Sect. 4.2) may result in such spurious structures that normally
should be washed out according to the estimated possible resolution (Sect. 4.1).
From the DI maps obtained with INVERS8 (Fig. 3) we
can see how the surface structure changes from the simplest one - only two nearly identical spots
on opposite sides of the star, line cores are not fitted - to more detailed structures.
Since the rms of the line profile residuals did not change much between ![]() = 0.001 and
= 0.001 and
![]() = 0.0001 we assume that the optimum case is in between. In both cases the principle surface abundance structure is as described in Sect. 4.3.
= 0.0001 we assume that the optimum case is in between. In both cases the principle surface abundance structure is as described in Sect. 4.3.
The calculated temperature changes in the atmospheric layers due to different abundances of silicon and iron are relatively small (Fig. 6). Nevertheless, we checked for the influence on the computed surface abundance maps by using a multiple-component atmosphere model. The differences between the results of the single and the multiple-component atmosphere models are small as well (Fig. 7).
The second panel in Fig. 9 shows that the observed differences in silicon and iron abundances as derived in Paper I give rise to differences in the Balmer line profiles of the right shape compared to the observed ones but not of the sufficient amplitude. The derived metal abundances are precise enough to be sure that the observed Balmer line changes cannot be explained by the abundance changes of silicon and iron alone. Not so for the very weak helium lines that are difficult to measure. This was the reason for us to investigate the additional effect of helium abundance changes. As shown in the bottom panel of Fig. 9, the combined effect of Si, Fe, and He abundance changes can explain the observed Balmer line variability. The He abundance gradient has to be very large in this case: He abundance must differ from the observed one up to solar. Such a large gradient is not compatible to the observations since the observed helium line strengths are constant within the errors of measurement in all rotation phases.
The assumption of large temperature gradients on the surface of HR 7224 has the
consequence that we cannot interpret the derived DI maps only in terms of abundance distributions,
the maps will represent both abundance and temperature variations. This is of interest in
particular with respect to the polar region of enhanced silicon line strength: from the curve of
growth in the given temperature range we know that enhanced line strength means lower temperature.
Thus we possibly observe an analogy to the cool polar caps reported by Böhm-Vitense & Van Dyk
(1987) for the Ap star ![]() CVn.
CVn.
There are two main objections against the use of ![]() CVn or CU Vir (Kroll 1987) as
reference stars for HR 7224, however. First, Böhm-Vitense & Van Dyk derived for
CVn or CU Vir (Kroll 1987) as
reference stars for HR 7224, however. First, Böhm-Vitense & Van Dyk derived for ![]() CVn from
light-curve analysis an axial ratio of the star of 0.92. Such an oblateness due to rotation has the
opposite effect, the star should be cooler at the equator than at the poles. Authors cannot give
a definite explanation of which mechanism keeps the (magnetic) poles cool. They only
speculate that the gas pressure at the poles may be lower due to a pressure stratification by
magnetic forces.
CVn from
light-curve analysis an axial ratio of the star of 0.92. Such an oblateness due to rotation has the
opposite effect, the star should be cooler at the equator than at the poles. Authors cannot give
a definite explanation of which mechanism keeps the (magnetic) poles cool. They only
speculate that the gas pressure at the poles may be lower due to a pressure stratification by
magnetic forces.
And second, from the observational point of
view, the findings by Böhm-Vitense & Van Dyk for ![]() CVn and by Kroll (1987), who reported surface
temperature variations for the fast rotating Ap star CU Vir, are more or less singular.
Kochukhov et al. (2002) investigated the hydrogen line profiles of
CVn and by Kroll (1987), who reported surface
temperature variations for the fast rotating Ap star CU Vir, are more or less singular.
Kochukhov et al. (2002) investigated the hydrogen line profiles of ![]() CVn obtained at different
rotation phases and did not find any larger variation of the atmospheric parameters (the shape of
the Balmer lines was constant within the noise level of data). And Kuschnig et al. (1999) showed that the variability of the H
CVn obtained at different
rotation phases and did not find any larger variation of the atmospheric parameters (the shape of
the Balmer lines was constant within the noise level of data). And Kuschnig et al. (1999) showed that the variability of the H![]() line in CU Vir can be explained by surface pressure (
line in CU Vir can be explained by surface pressure (![]() )
gradients, while
)
gradients, while
![]() is more or less constant.
is more or less constant.
Thus the LPV of H![]() in CU Vir is caused by a
mechanism that is well known for the Ap stars: strong non force-free magnetic fields disturb the outer layers
of the star and produce
in CU Vir is caused by a
mechanism that is well known for the Ap stars: strong non force-free magnetic fields disturb the outer layers
of the star and produce ![]() gradients on its surface. No such mechanism is known for the
generation of inhomogeneous surface temperature distributions. And no hint to
gradients on its surface. No such mechanism is known for the
generation of inhomogeneous surface temperature distributions. And no hint to ![]() variations in
HR 7224 could be found, neither from the abundance analysis (Paper I) nor from the shape of the standard variation of the H
variations in
HR 7224 could be found, neither from the abundance analysis (Paper I) nor from the shape of the standard variation of the H![]() profiles (Sect. 5).
profiles (Sect. 5).
We could not confirm the existence of stronger magnetic fields of HR 7224 directly by measurement. The
two obtained values are very close to each other and indicate a mean longitudinal magnetic field
strength in the order of +400 G. The zero field strength is within the ![]() limit of errors,
however. From the errors of measurement we can estimate an upper limit of
limit of errors,
however. From the errors of measurement we can estimate an upper limit of
![]() at the date of
observation of about +900 G. Considering only the result of the direct magnetic field measurement
we cannot exclude the presence of much stronger magnetic fields for two reasons. First, the date
of observation corresponds to a rotation phase of 0.53 where the strength of silicon lines is close
to minimum (see Fig. 10 in Paper I). This rotation phase could correspond to the cross-over phase
of the magnetic field. And second, without any knowledge on the timely variations of the magnetic
field observed during rotation we cannot exclude magnetic field configurations where the local
magnetic field strength is much stronger than observed in the mean longitudinal case. Our check
for the presence of Lorentz forces by means of the standard deviation of the H
at the date of
observation of about +900 G. Considering only the result of the direct magnetic field measurement
we cannot exclude the presence of much stronger magnetic fields for two reasons. First, the date
of observation corresponds to a rotation phase of 0.53 where the strength of silicon lines is close
to minimum (see Fig. 10 in Paper I). This rotation phase could correspond to the cross-over phase
of the magnetic field. And second, without any knowledge on the timely variations of the magnetic
field observed during rotation we cannot exclude magnetic field configurations where the local
magnetic field strength is much stronger than observed in the mean longitudinal case. Our check
for the presence of Lorentz forces by means of the standard deviation of the H![]() line
profiles, on the other hand, makes it unlikely that stronger magnetic fields on HR 7224 exist.
line
profiles, on the other hand, makes it unlikely that stronger magnetic fields on HR 7224 exist.
The use of two different methods of Doppler Imaging, MAXENT (MEM) and INVERS8 (Tikhonov regularization), gave comparable results for the basic structure of the silicon abundance distribution. In both final maps the equatorial region is divided into four large regions of alternating lower and higher abundance (line strength). And in both maps the upper pole that directs towards the observer shows enhanced silicon abundance. Neglecting the existence of temperature variations, the observed abundance gradients of Si and Fe are large, larger than 1 dex for both elements.
We could show that it is not possible to explain the observed variability of the Balmer lines by
surface abundance gradients alone or by pressure or ![]() gradients. At present state, the LPV
of Balmer and metal lines can be explained only if we also assume that surface temperature
gradients exist. The order of the assumed amplitude of the temperature variation of 1000 K is also in agreement with the amplitude of the observed photometric variations as we could show in Paper I.
In consequence the obtained DI maps represent also a temperature distribution and
the star is cooler at the visible pole.
gradients. At present state, the LPV
of Balmer and metal lines can be explained only if we also assume that surface temperature
gradients exist. The order of the assumed amplitude of the temperature variation of 1000 K is also in agreement with the amplitude of the observed photometric variations as we could show in Paper I.
In consequence the obtained DI maps represent also a temperature distribution and
the star is cooler at the visible pole.
The question if HR 7224 possesses stronger magnetic fields remains open. The results of our attempt to measure the field strength do not exclude such a possibility, but further magnetic field measurements that cover the full rotation cycle of HR 7224 are urgently needed.
At present state the physical reason for the existence of the assumed surface temperature gradients remains unknown.
Acknowledgements
Authors would like to thank A. Hatzes for his assistance in applying the MAXENT program code, N. Piskunov for providing us with the INVERS8 code, D. Shulyak for the calculation of the atmosphere models, and G. Valyavin for providing the software for magnetic field measurements. L.F. acknowledges the support of his work by the Brazilian agency CNPq through the grants Nos. 290086/2004-3 and 154566/2006-3. V.T. is thankful to Austrian Science Fund (FWF) P17890. D.M. acknowledges his work as part of the research activity of the Astrophysical Center for the Structure and Evolution of the Cosmos (ARCSEC) which is supported by the Korean Science and Engineering Foundation.