A&A 470, 515-522 (2007)
DOI: 10.1051/0004-6361:20077157
Selection effects shaping the gamma ray burst redshift distributions
F. Fiore -
D. Guetta -
S. Piranomonte -
V. D'Elia -
L. A. Antonelli
INAF - Osservatorio Astronomico di Roma, via Frascati 33, 00040
Monteporzio Catone (Roma), Italy
Received 24 January 2007 / Accepted 13 April 2007
Abstract
Aims. Long gamma ray bursts (GRBs) are associated to the death of massive stars and have been discovered, so far, up to z=6.29. Therefore, they hold the promise of probing star-formation and metal enrichment up to very high redshifts. However, the present GRB samples with redshift determinations are largely incomplete, and therefore a careful analysis of selection effects plaguing these samples is mandatory before any conclusion can be drawn from the observed GRB redshift distribution.
Methods. To this purpose we study and compare three well-defined samples of long GRBs detected by Swift, HETE2, and BeppoSAX.
Results. We find that Swift GRBs are, on average, slighly fainter and harder than BeppoSAX and HETE2 GRBs, as expected due to the higher energy range (15-150 keV) in which Swift GRBs are detected and localized, compared to BeppoSAX and HETE2 ( 2-20 keV).
Gas and dust obscuration plays a role in shaping both the GRB samples and, most interestingly, the present samples of GRBs with redshift determination. In particular, we argue that the majority of the bright Swift GRBs without redshift might actually be  events and, therefore, that the present Swift GRB sample with redshift is biased against low-z GRBs. On the other hand, the detection of bright UV rest-frame afterglows from high-z GRBs, and even from those with large X-ray obscuration, implies a lower dust amount than in nearby GRBs and/or a different dust composition. If this is the case, the Swift sample of GRBs with redshifts is probably a fair sample of the real high-z GRB population. The absence of high-z GRBs in the BeppoSAX and HETE2 samples of GRBs with redshifts is probably due to how, at the time of BeppoSAX and HETE2 follow-up, faint afterglows of high-redshift GRBs will have weakened below the spectroscopic capabilities of even 10m-class telescopes.
The redshift distribution of a subsample of Swift GRBs with distributions of peak fluxes, X-ray obscuration and optical magnitude at a fixed observing time similar to those of the BeppoSAX and HETE2 samples, is roughly consistent with the real BeppoSAX+HETE2 redshift distribution.
Key words: cosmology: observations - gamma rays: observations - gamma rays: bursts
Gamma ray bursts (GRBs) are one of the great wonders of Universe. They
combine several of the hottest topics of 21 century
astrophysics. On one hand, they are privileged laboratories for
fundamental physics, including relativistic physics, acceleration
processes, and radiation mechanisms. On the other, with some GRBs
associated to the death of massive stars (MacFadyden & Woosley 1999), it was soon
realized, after the discovery of their cosmologic origin, that they
could be used as a cosmological tool for investigating star formation
and metal enrichment at the epochs of galaxy birth, formation, and growth
(e.g. Wijers et al. 1998; Porciani & Madau 2001; Fynbo et al. 2007).
century
astrophysics. On one hand, they are privileged laboratories for
fundamental physics, including relativistic physics, acceleration
processes, and radiation mechanisms. On the other, with some GRBs
associated to the death of massive stars (MacFadyden & Woosley 1999), it was soon
realized, after the discovery of their cosmologic origin, that they
could be used as a cosmological tool for investigating star formation
and metal enrichment at the epochs of galaxy birth, formation, and growth
(e.g. Wijers et al. 1998; Porciani & Madau 2001; Fynbo et al. 2007).
![\begin{figure}
\par\includegraphics[width=7.2cm,clip]{7157fig1.eps}\hspace*{4mm}
\includegraphics[width=7cm,clip]{7157fig2.eps}
\end{figure}](/articles/aa/full/2007/29/aa7157-07/Timg9.gif) |
Figure 1:
Redshift distribution ( left panel) and cumulative redshift
distributions of Swift (solid line) and BeppoSAX+HETE2 (dashed line)
GRBs. |
| Open with DEXTER |
In this respect, two main research areas have developed. The first
one uses GRBs as background beacons for the spectroscopy of UV lines to
characterize the physical and chemical state of the matter along the
line of sight (Savaglio 2006, and references therein). The second
includes statistical studies of the GRB redshift distributions
(Guetta et al. 2005; Natarajan et al 2005; Jakobsson et al. 2006; Daigne et al. 2006).
Even though the techniques adopted, therefore the reference
communities, are somewhat different, these research areas are
interconnected. As an example, UV lines can be used to determine the
metal content of the absorption systems (D'Elia et al. 2006,
2007; Prochaska et al. 2006; Savaglio 2006). On the other hand,
it is well known that galaxy-scale properties like metallicity,
star-formation rate, and mass are correlated. Then, metallicity
determinations obtained through GRB spectroscopy can, at least in
principle, be plugged into the GRB population studies, to obtain a
better constraint on the models. In this paper we concentrate on
population studies and, in particular, on the importance of selection
effects in shaping GRB redshift distributions.
Population studies are very powerful tools. For example, galaxy and
AGN counts and luminosity functions have been used to successfully
measure the evolution of the star-formation rate, as well as galaxy
densities, and black-hole densities up to  .
Similarily, GRBs
can be used to probe the histories of the GRB- and star- formation
rates and of the metal enrichment in the Universe
(e.g. Porciani & Madau 2001). Indeed, thanks to BeppoSAX, first, and then to
HETE2 and Swift we have begun to have sizable samples of GRBs with
reliable redshifts (about 80 up to now). This number should grow up to
150-200 within the Swift lifetime. This opens up the possibility of
computing fairly well-constrained GRB luminosity functions in a few
redshift bins and, therefore, of measuring the cosmic evolution of the
GRB rate. The fraction of Swift GRBs with a reliable redshift is today
about one third of the total. It might be expected that this fraction
will improve in future, but it will hardly approach the majority of
the GRBs. This means that the biggest problem we have to face in
exploiting GRBs as cosmological tools is to understand and account for
large selection effects. Their role in shaping the population of GRBs
with a measured redshift is evident when comparing the redshift
distribution of Swift GRBs with that of BeppoSAX and HETE2 GRBs
(Fig. 1). The median redshifts of the two distributions are 2.6 and 1.5, respectively. This discrepancy cannot be explained
simply as due to the different detector sensitivity (e.g. Guetta &
Piran 2007).
.
Similarily, GRBs
can be used to probe the histories of the GRB- and star- formation
rates and of the metal enrichment in the Universe
(e.g. Porciani & Madau 2001). Indeed, thanks to BeppoSAX, first, and then to
HETE2 and Swift we have begun to have sizable samples of GRBs with
reliable redshifts (about 80 up to now). This number should grow up to
150-200 within the Swift lifetime. This opens up the possibility of
computing fairly well-constrained GRB luminosity functions in a few
redshift bins and, therefore, of measuring the cosmic evolution of the
GRB rate. The fraction of Swift GRBs with a reliable redshift is today
about one third of the total. It might be expected that this fraction
will improve in future, but it will hardly approach the majority of
the GRBs. This means that the biggest problem we have to face in
exploiting GRBs as cosmological tools is to understand and account for
large selection effects. Their role in shaping the population of GRBs
with a measured redshift is evident when comparing the redshift
distribution of Swift GRBs with that of BeppoSAX and HETE2 GRBs
(Fig. 1). The median redshifts of the two distributions are 2.6 and 1.5, respectively. This discrepancy cannot be explained
simply as due to the different detector sensitivity (e.g. Guetta &
Piran 2007).
In the next sections we give a detailed description of what the
possible selection effects are that plague the GRB redshift
determination.
To gain more quantitavive information on the issue of GRB selection
effects, we studied three well-defined samples of GRBs detected by
Swift, HETE2, and BeppoSAX. We selected long GRBs (T90>3 s)
outside the Galactic plane to limit Galactic extinction along their
line of sight and to avoid crowded fields, which can complicate the
discovery of optical/NIR afterglows and thus hamper redshift
determinations. To this purpose we limited our study to regions with
Galactic column density along the line of sight smaller than
 cm-2 (corresponding to
  ). We also
selected GRBs with good (arcmin) localization. For BeppoSAX and HETE2
GRBs, we required the
). We also
selected GRBs with good (arcmin) localization. For BeppoSAX and HETE2
GRBs, we required the  -ray burst to be detected by the
high-energy GRBM and FREGATE instruments and be localized by the WFC,
WXC, or SXC instruments. For Swift we considered all long GRBs
detected before September 10, 2006, while for HETE2 we considered all
long GRBs detected up to December 31, 2003. For BeppoSAX we
considered all GRBs detected during the entire mission. We excluded
from the sample GRB 060218 and GRB980425, which are probably
associated to a different class of events, orders of magnitude fainter
than the rest of the sample (e.g. Guetta & Della Valle 2007). We
considered only reliable spectroscopic redshifts. Table 1 gives more
information on the selected samples. Swift BAT peak fluxes and
spectral parameters were taken from the Swift GRB Information
page
-ray burst to be detected by the
high-energy GRBM and FREGATE instruments and be localized by the WFC,
WXC, or SXC instruments. For Swift we considered all long GRBs
detected before September 10, 2006, while for HETE2 we considered all
long GRBs detected up to December 31, 2003. For BeppoSAX we
considered all GRBs detected during the entire mission. We excluded
from the sample GRB 060218 and GRB980425, which are probably
associated to a different class of events, orders of magnitude fainter
than the rest of the sample (e.g. Guetta & Della Valle 2007). We
considered only reliable spectroscopic redshifts. Table 1 gives more
information on the selected samples. Swift BAT peak fluxes and
spectral parameters were taken from the Swift GRB Information
page![[*]](/icons/foot_motif.gif) .
.
Table 1:
GRB samples.
![\begin{figure}
\par\includegraphics[width=7cm,clip]{7157fig3.eps}\hspace*{3mm}
\includegraphics[width=7.2cm,clip]{7157fig4.eps}
\end{figure}](/articles/aa/full/2007/29/aa7157-07/Timg13.gif) |
Figure 2:
peak flux cumulative distributions of the Swift (solid line) and
BeppoSAX+HETE2 (dashed line) GRBs. a),
left panel, 15-150 keV band; b),
right panel, 2-26 keV band. |
| Open with DEXTER |
Equivalent hydrogen column densities ( )
were computed from X-ray
afterglow spectra assuming solar abundances. Swift column densities
were taken from (Campana et al. 2006) in 17 cases, from our own analysis
in 12 cases, and from the Swift GRB Information page in the rest
of the cases. BeppoSAX peak fluxes and spectral parameters, including
hydrogen-equivalent column densities, were taken from Stratta et al. (2004), Piro et al. (2005), and De Pasquale et al. (2006). For
both samples the minimum column density is set to the Galactic value
along the line of sight (Dickey & Lockman 1990). HETE2 peak fluxes
and spectral parameters were taken from Sakamoto et al. (2005).
)
were computed from X-ray
afterglow spectra assuming solar abundances. Swift column densities
were taken from (Campana et al. 2006) in 17 cases, from our own analysis
in 12 cases, and from the Swift GRB Information page in the rest
of the cases. BeppoSAX peak fluxes and spectral parameters, including
hydrogen-equivalent column densities, were taken from Stratta et al. (2004), Piro et al. (2005), and De Pasquale et al. (2006). For
both samples the minimum column density is set to the Galactic value
along the line of sight (Dickey & Lockman 1990). HETE2 peak fluxes
and spectral parameters were taken from Sakamoto et al. (2005).
Swift optical afterglow parameters were taken from the GCN through the
Gamma Ray Burst
database. BeppoSAX
and HETE2 optical afterglow parameters were taken from the Gamma
Ray Burst database, from Zeh et al. (2006) and from De Pasquale et al. (2006). Table 1 gives the number of optical afterglow detections
and the number of cases in which multiple observations allowed us to
estimate the optical afterglow decay index. Wherever possible, we used
R band magnitudes. For 17 Swift GRBs and 1 BeppoSAX GRB, we have only
V band magnitudes, for 2 Swift GRBs only a white filter magnitude and
for 8 BeppoSAX GRBs only g-band magnitudes. We converted the observed
magnitude into the R band using standard afterglow colors for all
these GRBs. The Lyman- forest starts to enter the R band at
z=3.9. Therefore, R band magnitudes for the GRBs at z=4-5 should be
considered lower limits. For GRB050904 at z=6.29, we used TAROT I band
equivalent magnitudes (Boer et al. 2006).
forest starts to enter the R band at
z=3.9. Therefore, R band magnitudes for the GRBs at z=4-5 should be
considered lower limits. For GRB050904 at z=6.29, we used TAROT I band
equivalent magnitudes (Boer et al. 2006).
Table 1 also gives the number of reliable spectroscopic redshift
obtained for the three samples. In most of the cases the redshift was
obtained through absorption lines overimposed on the afterglow
spectrum. In a minority of cases (6, 3, and 2 for the Swift, BeppoSAX,
and HETE2 samples, respectively), the redshift was obtained
uniquely through spectroscopy of the host galaxy, where the optical
afterglow was undetected or too faint to search for absorption
features. In a few other cases, the redshift was obtained thanks to
both absorption lines in the optical afterglow emission
and host galaxy emission lines.
There are at least two large groups of selection effects that must be
considered: (1) GRB detection and localization and (2)
redshift determination through spectroscopy of the optical/NIR
afterglow or of the GRB host galaxy. We discuss these two issues in
the next sections.
The sensitivity of BeppoSAX, HETE2 and Swift instruments as a function
of the GRB spectral shape has been studied in detail by Band (2003,
2006). Band (2006) also studied the sensitivity of the BAT instrument
as a function of the combined GRB temporal and spectral properties. We
refer the reader to these papers for more details on these topics.
Figure 2 compares the peak flux cumulative distributions of
the Swift GRBs with that of BeppoSAX and HETE2. The comparison is made
in two energy bands: 15-150 keV, which is the band where BAT detects
and localizes GRBs, and 2-26 keV, which is the band where the BeppoSAX
WFC and the HETE2 WXC and SXC localize GRBs. To produce Fig. 2a, BeppoSAX GRBM and HETE2 Fregate peak fluxes were
converted to the 15-150 keV BAT band by using a power-law model with an
(average) energy index of 0.5 for the BeppoSAX burts and the best-fit
model in Sakamoto et al. (2005) for the HETE2 bursts. To produce
Fig. 2b we used WFC and WXC peak fluxes and converted
BAT 15-150 keV peak fluxes in the 2-26 keV band by using the best-fit
models and parameters and the best-fit observed column densities along
the line of sight to the GRBs. To assess the robustness of our
analysis we produced peak flux cumulative distributions using
different, but reasonable, values of the spectral parameters adopted
for the conversion from one band to the other. We always found
qualitatively similar results to those in Fig. 2.
Figure 2a shows that Swift finds, on average,
slightly fainter GRBs than BeppoSAX and HETE2 in the 15-150 keV band. The
BeppoSAX and HETE2 samples contain a higher fraction of bright
GRBs. The median log(peak flux) and its interquartile range are -6.93,
0.33 for the Swift sample and -6.88, 0.42 for the joined
BeppoSAX+HETE2 sample. This is expected because of the higher
sensitivity of the BAT instrument with respect to the BeppoSAX GRBM
and HETE2 Fregate instruments (Band 2003).
The median 2-26 keV log(peak flux) is -7.22, 0.32 for the Swift sample
and -7.06, 0.38 for the joined BeppoSAX+HETE2 sample. The two 2-26 keV
peak flux distributions differ from each other more than the 15-150 keV distributions. This is probably due to the fact that Swift GRBs
are localized at energies higher than 10-15 keV, while BeppoSAX and
HETE2 GRBs are localized at energies  10 keV. This implies that
Swift localizes, on average, harder GRBs than BeppoSAX and
HETE2. In particular, Swift GRBs are revealed in a spectral range in
which absorption has little, if any, effect.
A column density of
10 keV. This implies that
Swift localizes, on average, harder GRBs than BeppoSAX and
HETE2. In particular, Swift GRBs are revealed in a spectral range in
which absorption has little, if any, effect.
A column density of
 cm-2at z=1 would reduce the observed 2-10 keV flux by 12-15% (depending
on the spectral index), thus reducing the probability of detecting
such highly obscured GRBs with BeppoSAX WFC and HETE2 WXC. Conversely,
these GRBs would certainly be present in the Swift sample.
cm-2at z=1 would reduce the observed 2-10 keV flux by 12-15% (depending
on the spectral index), thus reducing the probability of detecting
such highly obscured GRBs with BeppoSAX WFC and HETE2 WXC. Conversely,
these GRBs would certainly be present in the Swift sample.
![\begin{figure}
\par\includegraphics[width=7.3cm,clip]{7157fig5.eps}\hspace*{3mm}
\includegraphics[width=7cm,clip]{7157fig6.eps}
\end{figure}](/articles/aa/full/2007/29/aa7157-07/Timg17.gif) |
Figure 3:
a), left panel,
cumulative distributions of the Swift
(solid line) and BeppoSAX (dashed lines) GRBs. The leftmost BeppoSAX
curve assumes
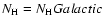 for the GRBs with a best-fit
intrinsic
consistent with zero. The rightmost BeppoSAX curve
assumes for these GRBs the 90% upper limit. b), right panel, histograms of the Swift GRB with (shadow histogram) and without
redshift (black histogram).
for the GRBs with a best-fit
intrinsic
consistent with zero. The rightmost BeppoSAX curve
assumes for these GRBs the 90% upper limit. b), right panel, histograms of the Swift GRB with (shadow histogram) and without
redshift (black histogram). |
| Open with DEXTER |
Figure 3a compares the best-fit column density
in
observer frame for the samples of Swift and BeppoSAX GRBs. The X-ray
afterglows at the time of the BeppoSAX NFI observations (obtained by
repointing the satellite with a typical delay time of 8-10 hr from
the GRB event) were significantly weaker than at the time of the
Swift observations (typically minutes to a few hours after the GRB
event), due to the afterglow power law decrease with exponent
 .
This implies that the uncertainties on the X-ray
spectral parameters, and therefore ,
are much greater for BeppoSAX
GRBs than for Swift GRBs. Indeed, the typical uncertainty of Swift
column densities is
.
This implies that the uncertainties on the X-ray
spectral parameters, and therefore ,
are much greater for BeppoSAX
GRBs than for Swift GRBs. Indeed, the typical uncertainty of Swift
column densities is
 cm-2 (see e.g. Campana et al. 2006), whereas that of BeppoSAX is 10 times larger (see
Stratta et al. 2004; De Pasquale et al. 2006). For this reason we
plot 2 curves for the BeppoSAX GRBs. The leftmost curve assumes
cm-2 (see e.g. Campana et al. 2006), whereas that of BeppoSAX is 10 times larger (see
Stratta et al. 2004; De Pasquale et al. 2006). For this reason we
plot 2 curves for the BeppoSAX GRBs. The leftmost curve assumes
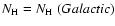 for those GRBs whose best-fit intrinsic
is
consistent with zero. The rightmost curve is based on 90% upper
limits on the
of these GRBs. The tail at high
values of
this distribution is due to not very well-constrained upper limits.
The real BeppoSAX
distribution is probabily between the two curves.
for those GRBs whose best-fit intrinsic
is
consistent with zero. The rightmost curve is based on 90% upper
limits on the
of these GRBs. The tail at high
values of
this distribution is due to not very well-constrained upper limits.
The real BeppoSAX
distribution is probabily between the two curves.
Shortward of a few  1021 cm-2, the BeppoSAX curves in
Fig. 3a are significantly lower than the Swift
curve. The probability that the BeppoSAX and Swift curves are drawn
from the same parent population is <10-5 and 1.7%, respectively,
using the Kolmogorov-Smirnov test, thus confirming that Swift samples
are less biased against obscuration than the BeppoSAX sample. Since
the observer-frame column density scales as the rest-frame column
density times (1+z) to a high negative power (
1021 cm-2, the BeppoSAX curves in
Fig. 3a are significantly lower than the Swift
curve. The probability that the BeppoSAX and Swift curves are drawn
from the same parent population is <10-5 and 1.7%, respectively,
using the Kolmogorov-Smirnov test, thus confirming that Swift samples
are less biased against obscuration than the BeppoSAX sample. Since
the observer-frame column density scales as the rest-frame column
density times (1+z) to a high negative power ( -2.5), this
implies that the BeppoSAX sample is somewhat biased against low-z,
highly obscured GRBs. Conversely, these GRBs must be present in the
Swift sample.
-2.5), this
implies that the BeppoSAX sample is somewhat biased against low-z,
highly obscured GRBs. Conversely, these GRBs must be present in the
Swift sample.
Figure 3b compares the
distribution of the Swift
GRBs with a determined redshift to that of the Swift GRBs with an
undetermined redshift. The probability that the two distributions are
drawn from the same parent population is only 1%, suggesting that the
sample of Swift GRBs with determined redshift is biased against GRB
with high (observer-frame) obscuration. Indeed, the distributions of the Swift and BeppoSAX GRBs with redshifts are
similar, unlike the
distributions of the full Swift and BeppoSAX
GRBs (see above). This introduces the next important group of
selection effects, those related to the determination of the redshift
of a GRB through spectroscopy of the optical/NIR afterglow or of its
host galaxy.
In determining the redshift of a GRB, the identification of the optical
afterglow plays a major role. Only 6 Swift redshifts have been found
through spectroscopy of the host galaxy (5 for the BeppoSAX and HETE2
joined sample).
Optical afterglows have been discovered for only 50% of the Swift GRB
sample, a fraction only slightly greater than that of the BeppoSAX and
HETE2 samples (46% and 39%, respectively). This result is somewhat
surprising, considering the prompt Swift localization
(minutes) and the strong international effort on Swift GRB follow-up
observations, which exploits an impressive number of facilities from
dedicated robotic telescopes to 8m class telescopes like the VLT,
Gemini, and Keck. It was expected that such an effort would have
produced a much larger fraction of optical/NIR afterglow
identifications than BeppoSAX and HETE2.
![\begin{figure}
\par\includegraphics[width=6.8cm,clip]{7157fig7.eps}
\end{figure}](/articles/aa/full/2007/29/aa7157-07/Timg23.gif) |
Figure 4:
The R magnitude of the optical afterglow at the time of its
discovery as a function of this time. Filled symbols are GRBs with
reliable redshift determination. The size of the symbol is
proportional to the redshift (the larger the symbol, the higher the
redshift). Circles = Swift GRBs; squares = BeppoSAX GRBs; triangles = HETE2 GRBs. |
| Open with DEXTER |
![\begin{figure}
\par\includegraphics[width=6.5cm,clip]{7157fig8.eps}\hspace*{3mm}
\includegraphics[width=6.5cm,clip]{7157fig9.eps}
\end{figure}](/articles/aa/full/2007/29/aa7157-07/Timg24.gif) |
Figure 5:
a), left panel, the distribution of the R magnitude 10ks
after the GRB events for the Swift (solid histogram) and the
BeppoSAX+HETE2 (dashed histogram) GRB samples. b), right panel, the
distribution of the -ray (15-150 keV) to optical (R band) flux
ratio for the Swift (solid histogram), and BeppoSAX+HETE2 (red
histogram) GRB samples. |
| Open with DEXTER |
Figure 4 shows the R magnitude of the optical afterglow as a
function of the discovery-time of the optical afterglow for the Swift,
BeppoSAX, and HETE2 GRBs. As expected, redshifts tend to be found for
bright afterglows. The figure also suggests that, at a given time from
the GRB event, the Swift optical afterglows are fainter, on average,
than the BeppoSAX and HETE2 afterglows. We then computed the magnitude
of the Swift, BeppoSAX, and HETE2 afterglows at a fixed time using the
best-fit decay indices found for each GRB afterglow, when
available. In the rest of the cases we used a time decay index of -1. We chose a fixed time of 10 ks after the burst (observer frame),
which is intermediate between the typical times at which Swift,
BeppoSAX and HETE2 GRBs are discovered, thus minimizing the
extrapolation needed to compute the R mag at 10 ks.
Figure 5a compares the Swift distribution of the R mag at 10 ks from the GRB event with that of the BeppoSAX and HETE2. GRBs
without detection of optical afterglow but for which optical follow-up
observations were carried out are included in this distribution at the
magnitude of their upper limits. This figure confirms that Swift
finds bursts with a fainter optical afterglow. The probability that
the Swift and BeppoSAX+HETE2 distributions are drawn from the same
parent population is <10-5. Similar results are obtained by
considering the distributions of the magnitudes of the detected
afterglows, excluding the upper limits. In principle, the fainter
Swift optical afterglows may be due to the fact that Swift detects, on
average, fainter GRBs (see Fig. 2). However, this is
probably not the case. Figure 5b shows the Swift and
BeppoSAX+HETE2 distributions of the -ray (15-150 keV) to
optical (R band) flux ratio. (Also in this case, GRBs with undetected
optical afterglow are included at the magnitude of their upper
limits.) The probability that the two distributions are drawn from the
same parent population is lower than 1%. This probability increases
to 1.6% by comparing the distributions of the magnitudes of the
detected afterglows, excluding the upper limits. Similar results are
obtained considering the X-ray (2-26 keV) to optical flux ratio.
Computing the R magnitude at 1 ks or at 100 ks does not change
this result qualitatively.
There two major differences in the Swift and BeppoSAX+HETE2 redshift
distributions: a) a relatively large number of GRB with z>3.5 is
present in the Swift sample (11 out 41 GRBs, i.e. 27% of the
sample). These GRBs are absent in the combined
BeppoSAX+HETE2 sample; b) a deficit of low redshift ()
in the
Swift sample with respect to what would be expected based on the
BeppoSAX+HETE2 sample. We discuss these two points in turn.
About the first point, the Swift better sensitivity to faint GRBs and
the Swift quick localization may explain the presence of a large
number of high-redshift GRBs in the Swift sample compared to the
BeppoSAX and HETE2 samples. First, the highest redshift GRBs are found
at low peak fluxes in Fig. 6a), which plots the redshift as
a function of the 15-150 keV peak flux for the Swift, BeppoSAX, and
HETE2 GRB samples. Second, the Swift capability to localize the GRB on
time-scales of minutes allows the discovery of faint optical
afterglows, which can be promptly observed in spectroscopic mode. The
median delay time of optical follow-up for the Swift, HETE2, and
BeppoSAX GRBs is 15 min, 3.5 h, and 14 h, respectively. If
optical and near-infrared afterglows decrease like power laws with
exponent
 ,
they would have faded by 2.9 and 4.4 mag passing from the median Swift delay time to the median
HETE2 and BeppoSAX delay times, respectively. Faint afterglows of
high-redshift GRBs will have weakened even below the spectroscopic
capability of 10m class telescopes, if observed many hours later
like in the BeppoSAX and HETE2 era. Furthermore, the host galaxies of
high-redshift GRBs are too faint to allow redshift determinations
through their emission lines.
,
they would have faded by 2.9 and 4.4 mag passing from the median Swift delay time to the median
HETE2 and BeppoSAX delay times, respectively. Faint afterglows of
high-redshift GRBs will have weakened even below the spectroscopic
capability of 10m class telescopes, if observed many hours later
like in the BeppoSAX and HETE2 era. Furthermore, the host galaxies of
high-redshift GRBs are too faint to allow redshift determinations
through their emission lines.
![\begin{figure}
\par\includegraphics[width=7.4cm,clip]{7157fig10.eps}\hspace*{4mm}
\includegraphics[width=7cm,clip]{7157fig11.eps}
\end{figure}](/articles/aa/full/2007/29/aa7157-07/Timg28.gif) |
Figure 6:
The redshift as a function of the 15-150 keV peak flux a),
left panel, and of the observer frame
b),
right panel, for the
Swift (circles), BeppoSAX (triangles) and HETE2 (squares) GRBs. GRB
without a measured redshift are plotted at a constant z as empty
symbols. The left dashed line in Fig. 6b is the
expectation for a constant, rest-frame column density of
 ,
and the right dashed line is the expectation for ,
and the right dashed line is the expectation for
 . . |
| Open with DEXTER |
The discrepancy between the Swift and BeppoSAX+HETE2 samples at low
redshift is less straightforward and requires a more detailed
discussion. Figure 6a shows that the peak flux distrubution
becomes wider at low redshift. Indeed, the median redshift of the 24
Swift GRB with 15-150 keV peak flux >
 erg cm-2 s-1 (
 of the sample) is only
 ,
very
different from the median redshift of the full sample (
,
very
different from the median redshift of the full sample (
 ).
The sample of bright GRBs is particularly useful because: a) selection
effects due to temporal and spatial variations in the instrument
sensitivity are minimized; and b) the redshift range is narrower, with
high-z GRBs systematically fainter than bright GRBs, thus minimizing
evolutionary effects. For bright fluxes the sensitivity of the
instruments can be safely considered constant over their entire field
of view, so it is easier to compare the number of GRBs expected by
different experiments. Comparing the field of view of Swift BAT to
that of the BeppoSAX WFC and considering the net observing time spent
by the two satellites searching for GRBs, we expect a number of bright
GRBs (15-150 keV peak flux >
erg cm-2 s-1)
to be 1.5 times higher in the Swift sample than in the BeppoSAX
sample, a factor similar to what is found in the real GRB samples
(1.77). Conversely, the number of bright GRBs with z<2 in the Swift
sample is only half that in the BeppoSAX sample (4 against 8). It is
clear that a strong selection effect is at work, biasing the sample of
Swift GRBs with redshift against low-z sources. Indeed, only 7 out of
24 bright Swift GRBs have a spectroscopic redshift, to be compared to 8 out of 13 in the BeppoSAX sample (and 3 out of 6 in the HETE2
sample).
).
The sample of bright GRBs is particularly useful because: a) selection
effects due to temporal and spatial variations in the instrument
sensitivity are minimized; and b) the redshift range is narrower, with
high-z GRBs systematically fainter than bright GRBs, thus minimizing
evolutionary effects. For bright fluxes the sensitivity of the
instruments can be safely considered constant over their entire field
of view, so it is easier to compare the number of GRBs expected by
different experiments. Comparing the field of view of Swift BAT to
that of the BeppoSAX WFC and considering the net observing time spent
by the two satellites searching for GRBs, we expect a number of bright
GRBs (15-150 keV peak flux >
erg cm-2 s-1)
to be 1.5 times higher in the Swift sample than in the BeppoSAX
sample, a factor similar to what is found in the real GRB samples
(1.77). Conversely, the number of bright GRBs with z<2 in the Swift
sample is only half that in the BeppoSAX sample (4 against 8). It is
clear that a strong selection effect is at work, biasing the sample of
Swift GRBs with redshift against low-z sources. Indeed, only 7 out of
24 bright Swift GRBs have a spectroscopic redshift, to be compared to 8 out of 13 in the BeppoSAX sample (and 3 out of 6 in the HETE2
sample).
A possible cause of the difficulty in obtaining a redshift for many
bright Swift GRBs is obscuration. The median observer-frame column
density toward the bright Swift GRBs is
 with an
interquartile range of 0.24, while the median
with an
interquartile range of 0.24, while the median
 of the faint
Swift GRBs is
of the faint
Swift GRBs is
 with interquartile 0.30. The probability
that the two
distribution are drawn from the same parent
population is
with interquartile 0.30. The probability
that the two
distribution are drawn from the same parent
population is  .
The median
of the 13 BeppoSAX GRBs
with 15-150 keV peak flux >
erg cm-2 s-1 is
20.66 (or 20.97 assuming the 90% upper limit for the GRBs with a
best-fit intrinsic
consistent with zero). The intrinsic
observer-frame
(i.e. after subtraction of the Galactic column
density along the line of sight) of the 24 Swift bright GRBs is 21.10.
At a typical redshift of 1.5 this implies a rest-frame column density
of
.
The median
of the 13 BeppoSAX GRBs
with 15-150 keV peak flux >
erg cm-2 s-1 is
20.66 (or 20.97 assuming the 90% upper limit for the GRBs with a
best-fit intrinsic
consistent with zero). The intrinsic
observer-frame
(i.e. after subtraction of the Galactic column
density along the line of sight) of the 24 Swift bright GRBs is 21.10.
At a typical redshift of 1.5 this implies a rest-frame column density
of
 and an optical extinction of several magnitudes,
assuming a Galactic dust-to-gas ratio. This dust extinction would make
more difficult both to discovery optical afterglows and to determine
the redshift through optical spectroscopy. Indeed, the fraction of
detected optical afterglows among the bright Swift GRBs is 46%,
slightly smaller than for the sample of the 98 Swift GRBs with 15-150 keV peak flux <
erg cm-2 s-1 (52%). The median R band magnitudes of the bright GRBs (
and an optical extinction of several magnitudes,
assuming a Galactic dust-to-gas ratio. This dust extinction would make
more difficult both to discovery optical afterglows and to determine
the redshift through optical spectroscopy. Indeed, the fraction of
detected optical afterglows among the bright Swift GRBs is 46%,
slightly smaller than for the sample of the 98 Swift GRBs with 15-150 keV peak flux <
erg cm-2 s-1 (52%). The median R band magnitudes of the bright GRBs (
 )
is also similar to
the faint GRBs (
)
is also similar to
the faint GRBs (
 ). Nearly identical are the median R magnitudes at 10 ks,
 for bright GRBs and
 for
the faint GRBs. Conversely, one would expect fainter optical
afterglows for the fainter GRBs. Finally, the fraction of bright Swift
GRB with redshift is only 29%, while that of bright BeppoSAX and
HETE2 GRBs is 62% and 50%, respectively, despite the much quicker
optical follow-up observations for Swift GRBs. Excluding the objects
with redshift obtained from host-galaxy emission lines from these
samples does not change this conclusion.
for
the faint GRBs. Conversely, one would expect fainter optical
afterglows for the fainter GRBs. Finally, the fraction of bright Swift
GRB with redshift is only 29%, while that of bright BeppoSAX and
HETE2 GRBs is 62% and 50%, respectively, despite the much quicker
optical follow-up observations for Swift GRBs. Excluding the objects
with redshift obtained from host-galaxy emission lines from these
samples does not change this conclusion.
Figure 6b plots the redshift as a function of the observer
frame
for the Swift and BeppoSAX GRB samples. Not surprisingly,
the highest redshift GRBs are found not only at low peak fluxes
(Fig. 6a), but also at low observed column densities. The
two dashed lines in Fig. 6b) are the expectation of a
constant, rest-frame column density of
(left line) and
(right line). The observed Swift
distribution is
consistent with the expectation of rest-frame column densities of the
order of 1022 cm-2, typical of dense molecular clouds. GRBs
with rest-frame obscuring column densities of the order of 1023 cm-2 do exist. Such high column densities have been detected only
in high z GRBs so far (GRB050904 at z=6.29 and and GRB060510B at z=4.9). These column densities imply a huge extinction of the
rest-frame UV light, if dust with properties similar to those in the
Galaxy, the SMC, or even for a dust with a grain distribution strongly
shifted toward large grain sizes (Stratta et al. 2004, 2005) would be
associated to the X-ray absorbing gas. The simple detection of the
bright optical and near infrared afterglow of this GRB (Tagliaferri et al. 2005; Haislip et al. 2006; Boer et al. 2006) implies peculiar
dust properties (Campana et al. 2006b; Stratta et al. 2007).
Here we limit ourselves to note that high-z GRBs with a
gas column density similar to the one of GRB050904, but with less extreme
dust properties, would easily remain undetected in the optical and near
infrared. Furthermore, their host galaxies would be so faint that
unambiguous associations with the GRB would be impossible, because the
probability of finding such faint galaxies in the arcsec Swift XRT
error-boxes would not be negligible, thus making it impossible to
determine their redshift.
To assess more quantitatively how the different selection effects
(peak flux limit, GRB obscuration, and magnitude of the optical
afterglow) can modify the redshift distribution, we extracted from the
Swift GRB sample a subsample having the same peak flux,
and
Rmag (at 10 ks) distributions of the joined BeppoSAX+HETE2 sample (the
"constrained'' GRB sample hereafter). Figure 7 compares the redshift
distribution of the constrained GRB sample with that of the full Swift
and BeppoSAX+HETE2 GRB samples. To evaluate the uncertainty on the
constrained GRB sample redshift distribution, we ran the random
extraction 100 times and plotted the contours of the region covered by
the constrained GRB sample redshift distributions. We see that the
constrained GRB sample redshift distribution is consistent, to within
the uncertainties, with the real BeppoSAX+HETE2 redshift distribution.
Other, more subtle, selection effects may be at work as well. For
example, there are redshift ranges for which the typical interval
covered by optical spectrometers (3800-8000 Å) does not
contain any strong emission or absorption line. For example, strong
emission lines such as H
![$\alpha ,~{\rm H}\beta ,
~[{\rm OIII}]\lambda\lambda4959,5007,~[{\rm OII}]\lambda3725$](/articles/aa/full/2007/29/aa7157-07/img42.gif) ,
are shifted outside
the above wavelength range at
,
are shifted outside
the above wavelength range at  ,
while Lyman-
enters
the range at
,
while Lyman-
enters
the range at  .
The redshift range 1.1-2.1 is the so-called
"redshift desert''. Analogously, the strongest absorption feature
after Lyman-
is the MgII
.
The redshift range 1.1-2.1 is the so-called
"redshift desert''. Analogously, the strongest absorption feature
after Lyman-
is the MgII
 doublet. This is shifted in a region strongly affected by telluric
features already at
doublet. This is shifted in a region strongly affected by telluric
features already at  ,
so redshift determinations through
absorption lines in low signal to noise spectra are difficult in the
redshift range 1.5-2.1. Treating these effects quantitatively (e.g. Bloom
2003) is complicated by the very diverse quality of the optical
spectra of GRB afterglows. Unfortunately, because of the highly
variable nature of these events, afterglow observations have often
been performed in non-optimal conditions and instrument set-ups, and
most importantly, they cannot be repeated.
,
so redshift determinations through
absorption lines in low signal to noise spectra are difficult in the
redshift range 1.5-2.1. Treating these effects quantitatively (e.g. Bloom
2003) is complicated by the very diverse quality of the optical
spectra of GRB afterglows. Unfortunately, because of the highly
variable nature of these events, afterglow observations have often
been performed in non-optimal conditions and instrument set-ups, and
most importantly, they cannot be repeated.
We have compared three well-defined samples of long GRBs observed and
localized by Swift (122 GRBs), BeppoSAX (39 GRBs) and HETE2 (44 GRBs),
for a total of 205 objects. Secure spectroscopic redshifts were
measured for 67 of these GRBs. The fraction of redshift determinations
is similar in the three samples, 34%, 30%, and 32%, respectively.
Swift GRBs are, on average, slightly fainter and harder than BeppoSAX
and HETE2 GRBs. This is probably due to both the higher sensitivity
of the BAT detector with respect to the BeppoSAX and HETE2 detectors
and to the higher energy range (15-150 keV), where Swift GRBs are
detected and localized, compared to BeppoSAX and HETE2 (2-20
keV). The distribution of the observer frame
for the Swift GRBs
is shifted toward higher
values than BeppoSAX, at a confidence
level of better than 98%. This is again probably due to the different
energy bands in which GRBs are localized by the two satellites. The
most obscured GRBs have probably been missed by the BeppSAX survey.
The distribution of the observer frame
for the Swift GRBs
without redshift determination is also shifted toward higher values than that of the Swift GRBs with a redshift determination
(confidence level of better than 99%), implying that the sample of
Swift GRBs with redshift determinations is biased against high
obscuration. This is confirmed by a more detailed analysis of the
sample of bright GRBs. If dust is associated to the X-ray absorbing
gas, one would expect that extinction makes the discovery and study of
optical afterglows of bright Swift GRBs more difficult. This is
probably the case, since the fraction of bright Swift GRB with
redshift is only 29%, while that of bright BeppoSAX and HETE2 GRBs is 62% and 50%, respectively. Highly obscured, bright, low-redshift
GRBs are likely to be present in the Swift sample, but so far most of
them must have escaped redshift determination (we expect that the
majority of the 17 bright Swift GRBs without redshift are at
). A program to discover and measure the magnitude and the
redshift of the host galaxies of bright Swift GRBs could confirm this
conclusion and provide a sample of GRB redshifts unbiased against
obscuration.
![\begin{figure}
\par\includegraphics[width=7cm,clip]{7157fig12.eps}
\end{figure}](/articles/aa/full/2007/29/aa7157-07/Timg47.gif) |
Figure 7:
The average cumulative redshift distribution of a subsample
of Swift GRBs having the same peak flux,
and R mag (at 10 ks)
distributions of the joined BeppoSAX+HETE2 samples (thin solid line)
compared with the Swift (thick solid line) and BeppoSAX+HETE2 (dashed
line) total redshift distributions. The thin dotted lines mark the
redshift range covered by 100 random extractions and give an idea
of the statistical uncertainty associated to a single extraction of a
redshift distribution of 26 GRBs from a parent population. |
| Open with DEXTER |
Highly X-ray obscured GRBs also do exist at high redshifts. The
detection of bright optical and near-infrared (UV rest-frame)
afterglows from these GRBs implies a dust-to-gas ratio and/or dust
composition different from those of nearby GRBs (Stratta et al. 2007). Indeed, at
 the major source of dust in the local
Universe (AGB stars) falls short of enough time to produce enough dust,
implying that high-z GRB host galaxies probably contains much less
dust than lower redshift host galaxies. This implies that redshift
determination of high-z GRBs would not be more difficult than that of
lower redshift GRBs, even if the observed optical and near-infrared
bands sample the UV rest frame. If this is the case, the Swift sample
of GRBs with redshifts would be a fair sample of the real high-z GRB
population.
the major source of dust in the local
Universe (AGB stars) falls short of enough time to produce enough dust,
implying that high-z GRB host galaxies probably contains much less
dust than lower redshift host galaxies. This implies that redshift
determination of high-z GRBs would not be more difficult than that of
lower redshift GRBs, even if the observed optical and near-infrared
bands sample the UV rest frame. If this is the case, the Swift sample
of GRBs with redshifts would be a fair sample of the real high-z GRB
population.
The absence of high-redshift GRBs in the BeppoSAX and HETE2 samples of
GRBs with measured redshift is most likely due to the fact that the
median delay between the GRB event and the optical and near infrared
follow-ups for BeppoSAX and HETE2 GRBs is 50 times and 15 times longer than for Swift GRBs. At the time of the BeppoSAX and
HETE2 follow-up, the faint afterglow of high-redshift GRBs was too
faint to allow redshift determination through absorption-line
spectroscopy. Furthermore, the host galaxies of high-redshift GRBs
are too faint to allow redshift determination through their emission
lines. High-redshift GRBs may well be present in the BeppoSAX and
HETE2 samples, but it is extremely difficult, if not impossible, to
determine their redshift and therefore recognize them as such.
Swift optical afterglows, measured at a fixed observer-frame time,
e.g. 10 ks after the GRB event, are fainter than BeppoSAX and HETE2
optical afterglows, also when compared to the GRB 15-150 keV
peak flux. This is somewhat surprising, because the higher median
redshift of Swift GRBs implies that a fixed observer-frame time
samples, on average, a shorter rest-frame time delay from the GRB
event for the Swift GRBs than do BeppoSAX and HETE2. Because afterglows
decrease like power laws, one would expect that the ratio between the
GRB peak flux and the optical afterglow magnitude at a fixed observed
time would be smaller for the Swift afterglows, contrary to what is
observed. At least two effects may contribute to explaining the observed
trend. The first is that at z>4 the Lyman-
forest enters the
R band, thus reducing the observed optical flux. The second is a
higher extinction in Swift GRBs with respect to BeppoSAX and HETE2
GRBs, as disccused above.
To conclude, at least the selection effects on GRB localization and
GRB redshift determination must be properly taken into account in
order to safely use GRBs as cosmological tools and to derive the
physical and cosmological evolution of the GRB formation rate from
statistical analysis of the present GRB samples. This would allow a
fair and quantitively-meaningful comparison with the star-formation
rate estimated through other means. Moreover, star formation in
regions hardly reachable by other techniques (low mass, dwarf
galaxies, high-redshift galaxies, dust-enshshouded star formation
sites) could be probed.
Acknowledgements
We thank Rosalba Perna and Elena Rossi for early
discussions of the topics presented in this papers. We also thank Eli
Waxman for useful comments and Luigi Stella for a careful reading of
the manuscript. We acknowledge support from contracts ASI/I/R/039/04
and ASI/I/R/023/05/0.
- Band, D. L. 2003, ApJ, 588,
945 [NASA ADS] [CrossRef] (In the text)
- Band, D. L. 2006, ApJ, 644,
378 [NASA ADS] [CrossRef]
- Bloom, J. S. 2003,
AJ, 125, 2865 [NASA ADS] [CrossRef]
- Boer, M., Atteia, J.
L., Damerdji, Y., Koltz, A., & Stratta, G. 2006, ApJ, 638,
L71 [NASA ADS] [CrossRef]
- Campana, S., Romano, P.,
Covino, S., et al. 2006, A&A, 449, 61 [NASA ADS] [CrossRef] [EDP Sciences] (In the text)
- Campana, S., Lazzati,
D., Ripamonti, E., et al. 2006, ApJL, in press
[arXiv:astro-ph/0611305]
- Daigne, F., Rossi,
E. M., & Mochkovitch, R. 2006, MNRAS, 372, 1034 [NASA ADS] (In the text)
- D'Elia, V.,
Piranomonte, S., Ward, P., Fiore, F., Meurs, E. J. A., & Norci,
L. 2006, Proceedings of the meeting The Multicoloured Landscape of
Compact Objects and their Explosive Origins, AIP, ed. L. Burderi,
et al., in press
(In the text)
- D'Elia, V., Fiore,
F., Piranomonte, S., et al. 2007, A&A, 467, 629 [NASA ADS] [CrossRef] [EDP Sciences]
- De Pasquale, M., Piro,
L., Gendre, B., et al. 2006, A&A, 455, 813 [NASA ADS] [CrossRef] [EDP Sciences]
- Dickey, J. M., &
Lockman, F. J. 1990, ARA&A, 28, 215 [NASA ADS]
- Fynbo, J. P. U.,
Hjorth, J., Malesani, D., et al. 2007, Proceedings of the Eleventh
Marcel Grossmann Meeting on General Relativity, ed. H. Kleinert, R.
T. Jantzen, & R. Ruffini [arXiv:astro-ph/0703458]
- Guetta, D., Piran,
T., & Waxman, E. 2005, ApJ, 619, 412 [NASA ADS] [CrossRef] (In the text)
- Guetta, D., &
Piran, T. 2007, A&A, submitted
[arXiv:astro-ph/0701194]
- Guetta, D., &
Della Valle, M. 2007, ApJL, in press
[arXiv:astro-ph/0612194]
- Jakobsson, P., Levan,
A., Fynbo, J. P. U., et al. 2006, A&A, 447, 897 [NASA ADS] [CrossRef] [EDP Sciences] (In the text)
- Haislip, J. B.,
Nysewander, M. C., Reichart, D. E., et al. 2006, Nature, 440
181
- Lockman, F. J.,
& Condon, J. J. 2005, AJ, 129, 1968 [NASA ADS] [CrossRef]
- MacFadyen, A. I., &
Woosley, S. E. 1999, ApJ, 524, 262 [NASA ADS] [CrossRef] (In the text)
- Natarajan, P., Albanna,
B., Hjorth, J., et al. 2005, MNRAS, 364, L8 [NASA ADS] (In the text)
- Piro, L., De
Pasquale, M., Soffitta, P., et al. 2005, ApJ, 623, 314 [NASA ADS] [CrossRef]
- Porciani, C., & Madau,
P. 2001, ApJ, 548, 522 [NASA ADS] [CrossRef] (In the text)
- Prochaska, J. X.,
Chen, H., & Bloom, J. 2006, ApJ, 648, L97 [NASA ADS] [CrossRef] (In the text)
- Sakamoto, T., Lamb, D.
Q., Kawai, N., et al. 2005, ApJ, 629, 311 [NASA ADS] [CrossRef]
- Savaglio, S. 2006, New J.
Phys., 8, 295 [CrossRef] [arXiv:astro-ph/0609489]
- Stratta, G., Fiore, F.,
Antonelli, L. A., Piro, L., & De Pasquale, M. 2004, ApJ, 608,
846 [NASA ADS] [CrossRef]
- Stratta, G., Perna, R.,
Lazzati, D., et al. 2005, A&A, 441, 83 [NASA ADS] [CrossRef] [EDP Sciences]
- Stratta, G., Maiolino, R.,
Fiore, F., & D'Elia, V. 2007, ApJL, in press
[arXiv:astro-ph/0703349]
- Tagliaferri, G.,
Antonelli, L. A., Chincarini, G., et al. 2005, A&A, 443,
L1 [NASA ADS] [CrossRef] [EDP Sciences]
- Wijers, R. A. M. J., et al.
1998, MNRAS, 294, L13 [NASA ADS]
- Zeh, A., Klose, S., &
Kann, D. A. 2006, ApJ, 637, 889 [NASA ADS] [CrossRef]
Copyright ESO 2007
![\begin{figure}
\par\includegraphics[width=7.2cm,clip]{7157fig1.eps}\hspace*{4mm}
\includegraphics[width=7cm,clip]{7157fig2.eps}
\end{figure}](/articles/aa/full/2007/29/aa7157-07/img9.gif)
![\begin{figure}
\par\includegraphics[width=7cm,clip]{7157fig3.eps}\hspace*{3mm}
\includegraphics[width=7.2cm,clip]{7157fig4.eps}
\end{figure}](/articles/aa/full/2007/29/aa7157-07/img13.gif)
![\begin{figure}
\par\includegraphics[width=7.3cm,clip]{7157fig5.eps}\hspace*{3mm}
\includegraphics[width=7cm,clip]{7157fig6.eps}
\end{figure}](/articles/aa/full/2007/29/aa7157-07/img17.gif)
![\begin{figure}
\par\includegraphics[width=6.8cm,clip]{7157fig7.eps}
\end{figure}](/articles/aa/full/2007/29/aa7157-07/img23.gif)
![\begin{figure}
\par\includegraphics[width=6.5cm,clip]{7157fig8.eps}\hspace*{3mm}
\includegraphics[width=6.5cm,clip]{7157fig9.eps}
\end{figure}](/articles/aa/full/2007/29/aa7157-07/img24.gif)
![\begin{figure}
\par\includegraphics[width=7.4cm,clip]{7157fig10.eps}\hspace*{4mm}
\includegraphics[width=7cm,clip]{7157fig11.eps}
\end{figure}](/articles/aa/full/2007/29/aa7157-07/img28.gif)
![\begin{figure}
\par\includegraphics[width=7cm,clip]{7157fig12.eps}
\end{figure}](/articles/aa/full/2007/29/aa7157-07/img47.gif)