![\begin{figure}
\par\includegraphics[width=8.8cm,clip]{7168fig1.ps}\par\vspace*{2mm}
\includegraphics[width=8.8cm,clip]{7168fig2.ps}\end{figure}](/articles/aa/full/2007/28/aa7168-07/img30.gif) |
Figure 1:
Visual lightcurve of S Ori as a function of Julian Date
and stellar cycle/phase. Data are from the AAVSO (Henden et al. 2006) and AFOEV (CDS) databases. We adopt a
period of
|
| Open with DEXTER | |
In the text
![\begin{figure}
\par\includegraphics[width=8.6cm,clip]{7168fig3.eps}
\end{figure}](/articles/aa/full/2007/28/aa7168-07/img59.gif) |
Figure 2:
Results of our VLTI/MIDI 8-13 |
| Open with DEXTER | |
In the text
![\begin{figure}
\par\includegraphics[width=8.5cm,clip]{7168fig4.eps}\end{figure}](/articles/aa/full/2007/28/aa7168-07/img60.gif) |
Figure 3:
Results of our VLTI/MIDI 8-13 |
| Open with DEXTER | |
In the text
![\begin{figure}
\par\includegraphics[width=8.5cm,clip]{7168fig5.eps}\end{figure}](/articles/aa/full/2007/28/aa7168-07/img61.gif) |
Figure 4:
Results of our VLTI/MIDI 8-13 |
| Open with DEXTER | |
In the text
![\begin{figure}
\par\includegraphics[width=8.5cm,clip]{7168fig6.eps}\end{figure}](/articles/aa/full/2007/28/aa7168-07/img62.gif) |
Figure 5:
Results of our VLTI/MIDI 8-13 |
| Open with DEXTER | |
In the text
![\begin{figure}
\par\includegraphics[width=8.6cm,clip]{7168fig7.eps}\end{figure}](/articles/aa/full/2007/28/aa7168-07/img112.gif) |
Figure 6:
Density profiles of radiatively driven wind models calculated
with the DUSTY code (Ivezic & Elitzur 1997;
Ivezic et al. 1999) for input parameters from
Table 3, together with
|
| Open with DEXTER | |
In the text
![\begin{figure}
\par\includegraphics[width=16cm,clip]{7168fig8.eps}\end{figure}](/articles/aa/full/2007/28/aa7168-07/img119.gif) |
Figure 7:
The (red) v=2, J=1-0 (42.8 GHz) and
(green) v=1, J=1-0 (43.1 GHz) maser images overlaid onto
pseudo-color representations of the infrared intensity.
The continuum photosphere (in fact mostly hidden behind the molecular
atmosphere in the N-band) is enhanced to a light blue color. The
darker blue shades represent our model intensity profile as in panels
(e) of Figs. 2-5, and the green shades
represent the location of the Al2O3 dust shell on top of the
low-intensity extended wings of the molecular atmosphere. The true location
of the star relative to the maser images is unknown. Here, we assume that the
center of the star coincides with the
center of the maser spot distribution.
Synthesized beam sizes
for epoch A are
|
| Open with DEXTER | |
In the text
![\begin{figure}
\par\includegraphics[width=5.6cm,clip]{7168figa.eps}\hspace*{2mm}...
...eps}\hspace*{2mm}
\includegraphics[width=5.6cm,clip]{7168figf.eps} \end{figure}](/articles/aa/full/2007/28/aa7168-07/img127.gif) |
Figure 8:
LOS velocity structure of the ( top)
v=1, J=1-0 (43.1 GHz)
and ( bottom)
v=2, J=1-0 (42.8 GHz) SiO maser emission
toward S Ori. The epochs of observations are from left to
right Epoch A (
|
| Open with DEXTER | |
In the text
![\begin{figure}
\par\includegraphics[width=8.5cm,clip]{7168figg.eps}\end{figure}](/articles/aa/full/2007/28/aa7168-07/img146.gif) |
Figure 9:
Histogram of the LOS velocities of our SiO maser spots combining
VLBA epochs A-C. Panel a) shows the histogram for the v=2 42.8 GHz
masers and panel b) for the v=1 43.1 GHz masers. Also indicated
are the mean values
|
| Open with DEXTER | |
In the text
![\begin{figure}
\par\includegraphics[width=8.5cm,clip]{7168figh.eps}\end{figure}](/articles/aa/full/2007/28/aa7168-07/img162.gif) |
Figure 10:
Distances of the 43.1 GHz maser components from the common
center of the distribution (radius) versus their velocity relative to the
average LOS velocity for the 43.1 GHz
transition (
|
| Open with DEXTER | |
In the text
![\begin{figure}
\par\includegraphics[width=8.5cm,clip]{7168figi.eps}\end{figure}](/articles/aa/full/2007/28/aa7168-07/img163.gif) |
Figure 11: As Fig. 10, but for the 42.8 GHz transition. The axes' scales are identical for the two figures. Compared to Fig. 10, it is evident that the 42.8 GHz maser spots lie at systematically closer distances to the center of the common maser distribution than the 43.1 GHz maser spots. |
| Open with DEXTER | |
In the text
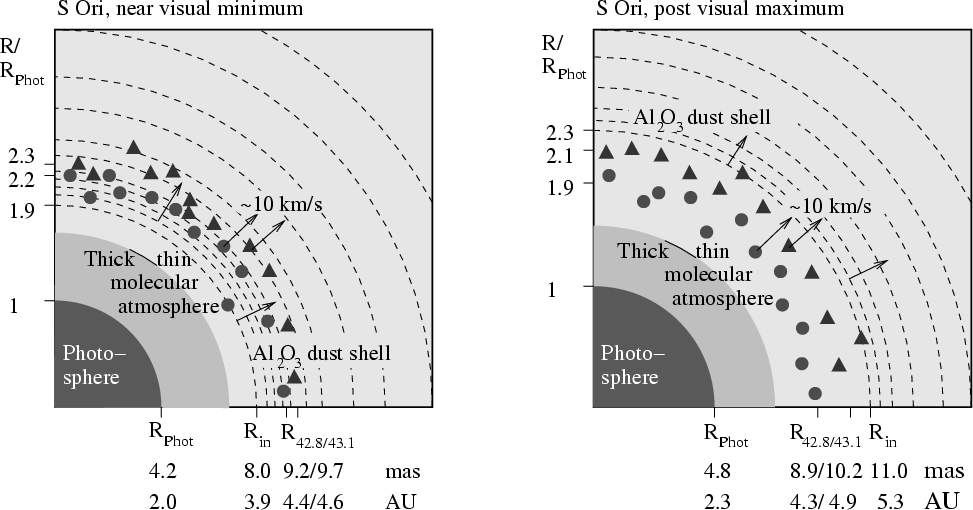 |
Figure 12: Sketch of the radial structure of S Ori's CSE at ( left) near-minimum and ( right) post-maximum visual phase as derived in this work. Shown are the locations of the continuum photosphere (dark gray), the at N-band optically thick molecular atmosphere (medium dark gray), the at N-band optically thin molecular atmosphere (light gray), the Al2O3 dust shell (dashed arcs), and the 42.8 GHz and 43.1 GHz maser spots (circles/triangles). The numbers below and beside the panels are the mean values of ( left) epochs A & B and ( right) epochs C & D from Table 7. |
| Open with DEXTER | |
In the text