A&A 468, 963-971 (2007)
DOI: 10.1051/0004-6361:20077155
H.-B. Cai1,2 - Z.-Q. Shen1,3 - H. Sudou4 - L.-L. Shang1 - S. Iguchi5 - Y. Murata6 - Y. Taniguchi7 - K. Wakamatsu4 - H. Takaba4
1 - Shanghai Astronomical Observatory, Chinese Academy
of Sciences, Shanghai 200030, PR China
2 - Graduate School of Chinese Academy of Sciences, Beijing 100039, PR China
3 - Joint Institute for Galaxy and Cosmology, SHAO and USTC, PR China
4 - Faculty of Engineering, Gifu
University, Gifu 501-1193, Japan
5 - National Astronomical Observatory of Japan, 2-21-1 Osawa, Mitaka, Tokyo
181-8588, Japan
6 - The Institute of Space and Astronautical Science, Japan Aerospace Exploration Agency, 3-1-1
Yoshinodai, Sagamihara, Kanagawa 229-8510, Japan
7 - Physics Department, Graduate School of Science, Ehime
University, 2-5 Bunkyou, Matuyama, 790-8577, Japan
Received 24 January 2007 / Accepted 16 March 2007
Abstract
We present the results of six-epoch Very Long Baseline Array (VLBA) observations of 3C 66A. The
high-resolution Very Long Baseline Interferometer (VLBI) maps obtained at multi-frequency (2.3, 8.4, and 22.2 GHz) simultaneously enabled us to identify the brightest compact component with the core. We find that the
spectrum of the core can be reasonably fitted by the synchrotron self-absorption model. Our VLBA maps show that
the jet of 3C 66A has two bendings at about 1.2 and 4 mas from the core. We also give possible identifications
of our jet components with the components in previous VLBA observations by analysing their proper motions. We
find consistent differences of the position from the core in one component between different frequencies at six
epochs.
Key words: galaxies: jets - galaxies: quasars: individual: 3C 66A - radio continuum: galaxies
The source 3C 66A (B0219+428, 4C 42.07) is a low-frequency peaked BL Lac object (LBL) peaking at IR-UV wavebands (e.g., Perri et al. 2003; Joshi & Böttcher 2006). Since its optical counterpart was identified by Wills & Wills (1974), a large number of observations from radio to gamma-ray bands have been performed on 3C 66A. As a blazar, 3C 66A also exhibits a prominent variability at radio, IR, and optical (cf. Böttcher et al. 2005, hereafter B05).
Price et al. (1993) gave the first Very Long Array (VLA) maps at 1.5 and 5 GHz, both showing that 3C
66A has a
![]() extended structure along the position angle
extended structure along the position angle
![]() .
New VLA maps at 1.5 and
5 GHz (Taylor et al. 1996) further revealed that 3C 66A has two weak lobes, one
at
.
New VLA maps at 1.5 and
5 GHz (Taylor et al. 1996) further revealed that 3C 66A has two weak lobes, one
at
![]() south of
the central region, the other at
south of
the central region, the other at
![]() with PA about
with PA about
![]() .
Taylor et al. (1996) present
the first 5 GHz VLBA map, exhibiting a typical core-jet structure in 3C 66A. Jorstad et al. (2001,
hereafter J01) studied the jet's kinematics of 3C 66A through multi-epoch VLBA observations at 22 and 43 GHz,
and they detected superluminal motions for four jet components with the apparent velocities from 15.3c to 29.7c
(the apparent velocities shown in this paper have been calculated by using the cosmological parameters given
below), and one stationary jet component. A more detailed kinematic study of 3C 66A was done by Jorstad et al.
(2005, hereafter J05) through the total and polarized intensity VLBA observations at 43 GHz at 17
epochs spanning 1998 March to 2001 April, with some epochs accompanied by nearly simultaneous polarization
measurements at 100, 222/353 GHz, and the optical wavebands. B05 presented a coordinated observation of 3C 66A
during the Whole Earth Blazar Telescope (WEBT) campaign at multiple frequencies including radio, infrared,
optical, X-rays, and gamma-rays at very high energy. Their VLBA observations at three epochs at 22 and 43 GHz
revealed superluminal motion for only one jet component with an apparent velocity of 12.1c, other jet components
remain stationary, and the radial radio brightness profile suggests a magnetic field decay
.
Taylor et al. (1996) present
the first 5 GHz VLBA map, exhibiting a typical core-jet structure in 3C 66A. Jorstad et al. (2001,
hereafter J01) studied the jet's kinematics of 3C 66A through multi-epoch VLBA observations at 22 and 43 GHz,
and they detected superluminal motions for four jet components with the apparent velocities from 15.3c to 29.7c
(the apparent velocities shown in this paper have been calculated by using the cosmological parameters given
below), and one stationary jet component. A more detailed kinematic study of 3C 66A was done by Jorstad et al.
(2005, hereafter J05) through the total and polarized intensity VLBA observations at 43 GHz at 17
epochs spanning 1998 March to 2001 April, with some epochs accompanied by nearly simultaneous polarization
measurements at 100, 222/353 GHz, and the optical wavebands. B05 presented a coordinated observation of 3C 66A
during the Whole Earth Blazar Telescope (WEBT) campaign at multiple frequencies including radio, infrared,
optical, X-rays, and gamma-rays at very high energy. Their VLBA observations at three epochs at 22 and 43 GHz
revealed superluminal motion for only one jet component with an apparent velocity of 12.1c, other jet components
remain stationary, and the radial radio brightness profile suggests a magnetic field decay
![]() r-1and, thus, a predominantly perpendicular magnetic field orientation.
r-1and, thus, a predominantly perpendicular magnetic field orientation.
We describe in Sect. 2 our VLBA observations of 3C 66A at relatively low frequencies of 2.3 and 8.4 GHz during six epochs and at 22.2 GHz during the first two of six epochs. The results are presented in Sect. 3. We analyse the spectra of the VLBI components in Sect. 3.1, study the kinematics of the jet components in Sect. 3.2, and the positional difference of the jet components caused by the frequency-dependent core position offset in Sect. 3.3. The discussion of results is given in Sect. 4, followed by conclusions in Sect. 5.
We adopt 0.444 as the redshift of 3C 66A (Miller et al. 1978), although Bramel et al.
(2005) thought that this redshift value is still uncertain and deserves more spectroscopic
observations. Throughout this paper the radio spectral index ![]() is defined as
is defined as
![]() .
By assuming H0=71 km s-1 Mpc-1,
.
By assuming H0=71 km s-1 Mpc-1,
![]() ,
and
,
and
![]() (Spergel et al. 2003), we have a scale for 3C 66A (z = 0.444) of 1 mas = 5.69 pc.
(Spergel et al. 2003), we have a scale for 3C 66A (z = 0.444) of 1 mas = 5.69 pc.
The observations of 3C 66A were performed with the NRAO![]() VLBA at 2.3 and 8.4 GHz during the following six epochs: 2001 March 13-14 (2001.20), 2001 June 25 (2001.48),
2001 November 9 (2001.86), 2002 February 8-9 (2002.11), 2002 February 21-22 (2002.14), and 2002 June 14
(2002.45). The VLBA observations at 22.2 GHz were successfully performed at the above first two epochs. These
observations were used to search for the binary black hole in 3C 66B (Sudou et al. 2003). The
on-source time at each epoch is about 30 min at 2.3 and 8.4 GHz, and 70 min at 22.2 GHz. The recording bandwidth
is 16 MHz (two 8 MHz IF channels) at 2.3 and 8.4 GHz, and 32 MHz (four 8 MHz IF channels) at 22.2 GHz. All the
data were recorded with the right-circular polarization (RCP) mode at 2.3 and 8.4 GHz and with the left-circular
polarization (LCP) mode at 22.2 GHz.
VLBA at 2.3 and 8.4 GHz during the following six epochs: 2001 March 13-14 (2001.20), 2001 June 25 (2001.48),
2001 November 9 (2001.86), 2002 February 8-9 (2002.11), 2002 February 21-22 (2002.14), and 2002 June 14
(2002.45). The VLBA observations at 22.2 GHz were successfully performed at the above first two epochs. These
observations were used to search for the binary black hole in 3C 66B (Sudou et al. 2003). The
on-source time at each epoch is about 30 min at 2.3 and 8.4 GHz, and 70 min at 22.2 GHz. The recording bandwidth
is 16 MHz (two 8 MHz IF channels) at 2.3 and 8.4 GHz, and 32 MHz (four 8 MHz IF channels) at 22.2 GHz. All the
data were recorded with the right-circular polarization (RCP) mode at 2.3 and 8.4 GHz and with the left-circular
polarization (LCP) mode at 22.2 GHz.
The data correlation was done with the VLBA correlator in Socorro, New Mexico, USA. Post-correlation data
analysis was done in the NRAO AIPS software (Schwab & Cotton 1983) for fringe fitting and in the
Caltech DIFMAP package (Shepherd 1997) for hybrid mapping. A prior visibility amplitude calibration
was done using the antenna gain and the system temperature measured at each station. During the process of
amplitude calibration, the correction for atmospheric opacity was also applied at all the three frequencies.
During the hybrid mapping, the CLEAN and phase-only self-calibration were iteratively used for the early
processing, and the amplitude self-calibration was added for the later processing. The final VLBA maps are shown
in Fig. 1. The mapping parameters of Fig. 1 are listed in Table 1. The
quantitative description of the source structure was determined by the circular Gaussian model fitting to the
calibrated visibility data, and the results are listed in Table 2.
![\begin{figure}
\par\scalebox{0.6}[0.6]{\rotatebox{0}{\includegraphics{7155f1_1.e...
...0.6]{\rotatebox{0}{\includegraphics{7155f1_3.eps}}}\hspace*{6.3cm}\end{figure}](/articles/aa/full/2007/24/aa7155-07/img11.gif) |
Figure 1: The naturally-weighted VLBA maps of 3C 66A at 2.3, 8.4, and 22.2 GHz from top to bottom. The circles superimposed on the maps represent the Gaussian model components listed in Table 2, whose names are labelled. The crosses represent the restoring beams in Table 1. |
| Open with DEXTER | |
Table 1: Description of VLBA maps of 3C 66A shown in Fig. 1.
Table 2: The results of model-fitting at six epochs.
For the VLBI spectral analysis, an accurate absolute calibration of the flux density is necessary. Unfortunately due to the lack of the corresponding VLBA observations for other compact amplitude calibrators, we could not perform any absolute amplitude calibration. Based on our experience of the study on PKS 0528+134 and 3C 138 by the multi-frequency VLBA observations (Cai et al. 2006; Shen et al. 2005), the errors in the absolute flux-density calibration are about 10% at 2.3 and 8.4 GHz, and about 20% at 22.2 GHz. We also used the Difwrap program (Lovell 2000) to estimate the errors of the Gaussian model-fitting parameters. The errors of the flux densities in the Gaussian model fitting estimated by Difwrap are much smaller than the errors in the absolute flux-density calibration, so we only adopted the errors in the absolute flux-density calibration as the error bars of flux density, and adopted the errors of other model-fitting parameters estimated by Difwrap. All the errors are listed in Table 2.
The fitted VLBI components listed in Table 2 are also labelled in Fig. 1. We label the component at the north end (having the smallest size and the highest brightness temperature) k component, which is further identified with the core according to its spectral characteristics in Sect. 3.1. Other jet components are labelled alphabetically according to their separations from the k component.
Component c detected at 22.2 GHz was not detected at 2.3 and 8.4 GHz, which may be due to the lower resolution
at 2.3 and 8.4 GHz and its relative weakness at 2.3 and 8.4 GHz when compared with components b and d. The maps
at 8.4 and 22.2 GHz show that there are two bendings in the jet emission, at about 1.2 and 4 mas from component k, with an extended jet structure toward PA ![]() 170
170
![]() at
20-30 mas. This extension toward the south is
consistent with that of the VLA maps at 1.5 and 5 GHz (Price et al. 1993; Taylor et al.
1996) and the VLBA map at 5 GHz in Taylor et al. (1996). But the structure toward the
north that has been detected in the VLA maps at 1.5 and 5 GHz is not shown in our VLBA maps and the VLBA map at
5 GHz either (Taylor et al. 1996). This may be due to the lobe in the north
(PA
at
20-30 mas. This extension toward the south is
consistent with that of the VLA maps at 1.5 and 5 GHz (Price et al. 1993; Taylor et al.
1996) and the VLBA map at 5 GHz in Taylor et al. (1996). But the structure toward the
north that has been detected in the VLA maps at 1.5 and 5 GHz is not shown in our VLBA maps and the VLBA map at
5 GHz either (Taylor et al. 1996). This may be due to the lobe in the north
(PA ![]() -20
-20![]() ),
detected by VLA at 1.5 and 5 GHz, being too weak and dispersive, and thus resolved by the VLBA. In the following
subsections, we study the spectra, motions, and the positional offsets of these jet components based on our VLBA
observations.
),
detected by VLA at 1.5 and 5 GHz, being too weak and dispersive, and thus resolved by the VLBA. In the following
subsections, we study the spectra, motions, and the positional offsets of these jet components based on our VLBA
observations.
The detection of components (k, b, d, e, f, and g) at more than one frequency allows spectral analysis of these VLBI components. We plot the spectrum of k component in Figs. 2a and b, and the other five components' spectra in Fig. 2c. The data in Figs. 2a, b, and c are from our observations at 2001.20, 2001.48, and 2001.20, respectively. The spectral indexes of component d at the first two epochs (2001.20 and 2001.48) were obtained from the linear regression on the data points at 2.3, 8.4, and 22.2 GHz. The spectral indexes of the other components are simply from the two-point measurements at 2.3 and 8.4 GHz, except for component b at the first two epochs whose spectral indexes come from two-point measurements at 8.4 and 22.2 GHz. The results from these spectral fits during six epochs are given in Table 3, where we can see that the k component's spectral indexes, different from other components, are positive, implying the existence of an absorption. Its inverse spectrum at the low frequency in Fig. 2b also confirms this. Combined with its compactness, we identify k as the core of 3C 66A.
Taylor et al. (1996) report on the VLBI observations of 3C 66A at 5 GHz at 1995.65 with a core flux
density 0.67 Jy. According to the single-dish monitoring by the University of Michigan Radio Observatory
(UMRAO), the total flux densities of 3C 66A at 5 GHz at epochs 2001.20 and 2001.48 of 2.25 and
2.37 Jy,
respectively, are almost the same as that at epoch 1995.65 of 2.38 Jy (Taylor et al. 1996). By
assuming that the same total flux density infers the same core activity, we can estimate the flux density of
VLBI core to be 0.67 Jy at 5 GHz at 2001.48 (as plotted in Fig. 2d). Then we use the synchrotron-self
absorption (SSA) formula
![]() to fit the data at 2.3, 5,
8.4, and 22.2 GHz, where S0 is the flux density in Jy at 1 GHz when the SSA optical depth at 1 GHz
to fit the data at 2.3, 5,
8.4, and 22.2 GHz, where S0 is the flux density in Jy at 1 GHz when the SSA optical depth at 1 GHz
![]()
![]() and
and ![]() is the optically thin spectral index. The best-fit
is the optically thin spectral index. The best-fit
![]() ,
S0=0.10 Jy, and
,
S0=0.10 Jy, and
![]() ,
the fitting curve is plotted in Fig. 2d. From the fitting curve we estimate that the peak flux
density Sm is
,
the fitting curve is plotted in Fig. 2d. From the fitting curve we estimate that the peak flux
density Sm is ![]() 0.66 Jy at the inverse frequency
0.66 Jy at the inverse frequency
![]() GHz. Using the relation
GHz. Using the relation
![]() for the SSA model (Kellermann & Pauliny 1981), we
estimate the magnetic field in the core region
for the SSA model (Kellermann & Pauliny 1981), we
estimate the magnetic field in the core region ![]() 1.1 mG, here
1.1 mG, here ![]() ,
the angular diameter of the core of
0.21 mas is the geometrical mean of the angular diameters at 2.3 and 8.4 GHz. For comparison, the angular size
of 3C 66A at 5 GHz is 0.2 mas from previous VLBA observations (Taylor et al. 1996).
,
the angular diameter of the core of
0.21 mas is the geometrical mean of the angular diameters at 2.3 and 8.4 GHz. For comparison, the angular size
of 3C 66A at 5 GHz is 0.2 mas from previous VLBA observations (Taylor et al. 1996).
J01, J05, and B05 have studied the jet kinematics in detail, and they showed that the kinematics of 3C 66A is
complicated; some components show superluminal motions, some show the inward (apparently toward the core)
motions, and some show the zero proper motions. We also linearly fit the separations of the jet components at 2.3 and 8.4 GHz (Fig. 3), where the fitting results are listed in Table 4. Since the
observations at 22.2 GHz were at two short-separated epochs, we do not fit the separations of the jet components
at 22.2 GHz. We can see from Fig. 3 and Table 4 that there are no obvious proper motions of
the jet components at 2.3 and 8.4 GHz within the uncertainties. B05 also find no obvious superluminal motions of
the components B05-B2 (we add "B05'' before the corresponding component name used in their paper, this kind of
nomenclature is also used for the components in J01 and J05), B05-B3, B05-C2, and B05-C3 except that B05-C1 has
the apparent velocity 12.1 ![]() 8.0c through their three epochs (2003.78, 2003.83, and 2004.08) observations at 22 and 43 GHz.
8.0c through their three epochs (2003.78, 2003.83, and 2004.08) observations at 22 and 43 GHz.
![\begin{figure}
\par\includegraphics[width=8.4cm,clip]{7155f2_1.eps}\hspace*{4mm}...
...eps}\hspace*{4mm}
\includegraphics[width=8.4cm,clip]{7155f2_4.eps}
\end{figure}](/articles/aa/full/2007/24/aa7155-07/img116.gif) |
Figure 2: The spectra of VLBI components in 3C 66A: a) and b) are the spectrum of core (k component) at 2001.20 and 2001.48, and c) is the spectra of the jet components b, d, e, f, and g at 2001.20. Shown in d) is an SSA fitting curve to the spectrum of k component with all the data points from our observations at 2001.48 except 5 GHz data from Taylor et al. (1996). |
| Open with DEXTER | |
To show a superluminal motion of 1c in 3C 66A, a proper motion of at least 0.037 mas yr-1 should be detected. But the errors of proper motions in Table 4 are all greater than 0.037 mas yr-1 except for component b at 8.4 GHz, which means that the non-detection of superluminal motion may be due to the short time baseline of our observations, so we studied the kinematics of the jet components by linking our observations with the observations of J01, J05, and B05. We investigated the relations among our components and the components in B05, J01, and J05 by extrapolating the detected proper motions in J01 and J05 because of their more frequent and longer-spanned observing epochs. Figure 4 shows the relations of these components, where the data points of components a and c are from our observations at 22.2 GHz, the data points of components b and d are from our observations at 8.4 GHz, and other data points are from observations at 43 GHz in J01, J05, and B05. Although there is a difference in the separations from the core of the same component at 8.4/43 GHz and at 22.2/43 GHz probably due to the SSA, we show in Sect. 3.3 that such a positional difference is small (less than 10% of the separation of the jet component relative to the core), so combining the data at 8.4, 22.2, and 43 GHz together to discuss the proper motion barely affects on our results. We can see from Fig. 4 that J05-C4, J05-C3, J05-C2, J05-C1, J05-B6, J05-A1, J05-B4, and J05-A2 may be identified with B05-C3, a (and B05-C2), B05-C1, b, J01-B6, c, J01-B4, and d, respectively. We also try the linear fitting to the separations of these components based on our identifications and give the results in Table 5.
According to Fig. 4, we speculate that J01-B1 may be identified with J05-A2. Although B05-B3 may be
identified with J05-A2 according to the motion trend of J05-A2, B05-B2 is more possibly identified with J05-A2
because their position angles are almost the same, ![]()
![]() .
It is also possible that J05-A1 or J05-C1
may be identified with B05-C1. Obviously future high-resolution VLBI observations are needed to confirm these
identifications.
.
It is also possible that J05-A1 or J05-C1
may be identified with B05-C1. Obviously future high-resolution VLBI observations are needed to confirm these
identifications.
It can be seen from Table 2 that the separations of components b and d from the core at 8.4 GHz are smaller than the ones at 22.2 GHz, and the separations of component d at 2.3 GHz are also smaller than at 8.4 GHz; i.e., there is a difference of position from the core of the same jet component at different frequencies. There is no obvious frequency-dependent positional difference for the outer jet components, which may be due to their weak emissions and thus large positional uncertainties. According to Lobanov (1998), the SSA can cause the offset of the position from the jet apex of the ultracompact VLBI core at different frequencies due to the frequency-dependent opacity effects since the VLBI core is observed at the location where the optical depth of SSA is 1. Consequently the separations from the core of the optically-thin jet component at different frequencies will be different. In the following, we adopt this model to estimate the separations of 3C 66A core from the jet apex at different frequencies.
Under the assumption that the magnetic field and electron density within the ultracompact VLBI core region
decrease with r, the distance from the conical jet apex, as
![]() and
and
![]() (Königl
1981), the projected angular distance of the core from the jet apex on the sky plane at the observing
frequency
(Königl
1981), the projected angular distance of the core from the jet apex on the sky plane at the observing
frequency ![]() can be expressed as (Lobanov 1998):
can be expressed as (Lobanov 1998):
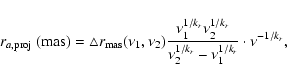 |
(1) |
 |
(2) |
We must emphasise that the formula for calculating the positional difference of the jet component is based on the assumption that the magnetic field and electron density continuously decrease with r; i.e., there is a smooth-flow jet structure within the ultracompact VLBI core region. If this is not the case, we still can observe the positional difference of the optically-thin jet component relative to the core because of the opacity effect, but its dependency on frequency would not follow that in Eq. (1).
Table 3: The spectral indexes of the VLBI components.
![\begin{figure}
\par\mbox{ \includegraphics[width=85mm]{7155f3_1.eps} \includegraphics[width=85mm]{7155f3_2.eps} }\end{figure}](/articles/aa/full/2007/24/aa7155-07/img131.gif) |
Figure 3: The linear fitting to the separations of components b, d, e, f, and g at 2.3 and 8.4 GHz, respectively. Fitting results are given in Table 4. |
| Open with DEXTER | |
Table 4: The proper motions of the jet components in 3C 66A during our six epochs.
![\begin{figure}
\par\includegraphics[width=9cm,clip]{7155f4.eps}
\end{figure}](/articles/aa/full/2007/24/aa7155-07/img134.gif) |
Figure 4: Identification of our jet components with the jet components detected in J01, J05, and B05. The open symbols represent our components (a, b, c, and d), filled symbols represent the components (J05-C4, J05-C3, J05-C2, J05-C1, J05-B4, J05-B6, J05-A1, and J05-A2) in J05, the half-filled symbols represent the components (J01-B1, J01-B4, and J01-B6) in J01, and the line-composed symbols represent the components (B05-B2, B05-B3, B05-C1, B05-C2, and B05-C3) in B05. See text for more details. |
| Open with DEXTER | |
Our VLBA maps of 3C 66A show a typical core-jet structure with two bendings at 1.2 and 4 mas from the core. Furthermore, the VLBA maps at 43 GHz in J05 show that the first bending is a continuous bending beginning at 1.2 mas up to 3 mas from the core. We also find that the flux densities of the VLBI components in J05, B05, and our data at 22.2 GHz decrease along the jet, but start to increase at the location 1.2 mas up to 2.6 mas from the core. Such an obvious increase in the flux densities of the VLBI components in J05 beginning from 1.2 mas from the core can be seen in Fig. 5. The coincidence between the place of the first bending and where the flux densities of the jet components increase suggests that the observed bending may be related to the increase in the flux densities of the jet. And continuous bending from 1.2 to 3 mas may be due to the continuous decrease in the viewing angle to the jet components, then the increase of Doppler boosting. It is difficult to judge whether there is an increase in the flux density to be related to the bending at 4 mas since we cannot find any obvious increase in the flux density beginning from 4 mas.
Combining our data at 2.3, 8.4, and 22.2 GHz at 2001.48 with the data at 5 GHz at 1995.65 in Taylor et al.
(1996), we used the SSA model to fit the spectra of the core for the first time. The best-fit
optically-thin spectral index is -0.08, and B05 give an average spectral index -0.15 from their observations at 22 and 43 GHz at three epochs 2003.78, 2003.83, and 2004.08. The difference in the spectral index may be due to
the different core activities at different observing epochs. By examining the light curves from the UMRAO and
the Metsähovi radio observatory (see Teräsranta et al. 1998; and Teräsranta et al.
2005), we find that the observing epoch 2001.48 is near the radio burst at 2001.20. The
observations in B05 at three epochs were also close to a radio burst at 2004.0, but the amplitude of this radio
burst is lower than the one at 2001.20. It may be possible that there are more high-energy electrons in the core
region at 2001.48 than at three epochs in B05, resulting in a flatter spectrum at 2001.48 than those at 2003.78,
2003.83, and 2004.08.
![\begin{figure}
\par\includegraphics[width=8.2cm,clip]{7155f5.eps}
\end{figure}](/articles/aa/full/2007/24/aa7155-07/img135.gif) |
Figure 5: The distribution of the flux density of the jet components against the separation from the core at 43 GHz. The data are from J05. This figure shows that the flux density of the jet component starts to increase from about 1.2 mas till about 2.6 mas (indicated by two vertical lines). |
| Open with DEXTER | |
We fit the separations of the jet components of 3C 66A at 2.3 and 8.4 GHz for six epochs, and did not detect any proper motions of these jet components during our observations, which may be due to our short coverage time. We then studied the relations between our jet components and the components in J01, J05, and B05, and give the possible identifications of these jet components in Fig. 4. We can see from Fig. 4 that our jet components are not stationary if our identifications are right. The components J05-A1 and J05-A2 in J05 show the apparently inward motion to the core, it may be due to the viewing angle to the jet component becoming small when the jet component moves back toward the line of sight. This is also evidence that the increase in the flux densities of the jet components from 1.2 to 2.6 mas may be due to decreasing viewing angles to these jet components.
The average positional difference in component d from the core at 2.3 and 8.4 GHz is 0.27 mas. Lobanov (1998) give the positional differences of the optically-thin jet components from the core at 2.3 and 8.4 GHz of 3C 395 (z=0.635), 4C 39.25 (z=0.699), and 1038+528A (z=0.678) about 0.60, 0.50, and 0.50 mas, respectively, which are bigger than the one, 0.27 mas, in 3C 66A. The value of the observed positional difference of the jet component from the core is determined by the magnetic field and electron density in the core region, redshift, and viewing angle to the jet. The observed positional difference of the jet component will be bigger with the stronger magnetic field and higher electron density in the core region, the lower redshift, and the larger viewing angle. The redshift of 3C 66A is lower than 3C 395, 4C 39.25, and 1038+528A, but the magnetic field in the core region and the viewing angle are smaller than the ones in 3C 395, 4C 39.25, and 1038+528A (Lobanov 1998), which may explain why the observed positional difference in the component d in 3C 66A is smaller than the ones in 3C 395, 4C 39.25, and 1038+528A.
Table 5: The proper motions by linearly-fitting to the separations of the jet components in Fig. 4 by assuming the identifications of these jet components. See text for details.
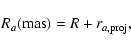
Table 6: The angular separations of the core and component d relative to the jet apex.
Acknowledgements
This research has made use of data from the University of Michigan Radio Astronomy Observatory which has been supported by the University of Michigan and the National Science Foundation. This work was supported in part by the National Natural Science Foundation of China (grants 10573029, 10625314, and 10633010) and the Knowledge Innovation Program of the Chinese Academy of Sciences (Grant No. KJCX2-YW-T03), and sponsored by the Programme of Shanghai Subject Chief Scientist (06XD14024).Z.-Q. Shen acknowledges the support by the One-Hundred-Talent Programme of the Chinese Academy of Sciences.