![\begin{figure}
\par\includegraphics[width=8.5cm,clip]{6673fig1.eps}
\end{figure}](/articles/aa/full/2007/24/aa6673-06/img32.gif) |
Figure 1:
Radial
profile of all detected stellar objects with
|
| Open with DEXTER | |
In the text
![\begin{figure}
\par\includegraphics[width=8.6cm,clip]{6673fig2.eps} \end{figure}](/articles/aa/full/2007/24/aa6673-06/img39.gif) |
Figure 2: Objects classification using the MAG_AUTO-MU_MAX plane. |
| Open with DEXTER | |
In the text
![\begin{figure}
\par\includegraphics[width=12cm,clip]{6673fig3.eps}
\end{figure}](/articles/aa/full/2007/24/aa6673-06/img40.gif) |
Figure 3:
NAOS/CONICA |
| Open with DEXTER | |
In the text
| |
Figure 4:
Completeness for extended sources. Galaxies with parameters ( |
| Open with DEXTER | |
In the text
![\begin{figure}
\par\includegraphics[width=8.8cm,clip]{6673fig5.eps} \end{figure}](/articles/aa/full/2007/24/aa6673-06/img51.gif) |
Figure 5:
Le Phare photometric redshift distribution for the 60 matched
objects. The distribution is peaked around |
| Open with DEXTER | |
In the text
![\begin{figure}
\par\includegraphics[width=8cm,height=6.5cm,clip]{6673fig6.eps}\h...
...e*{4mm}
\includegraphics[width=8cm,height=6.5cm,clip]{6673fig7.eps}\end{figure}](/articles/aa/full/2007/24/aa6673-06/img66.gif) |
Figure 6: Separation between regular and irregular objects. Left: simulated objects (empty squares), right: real objects (crosses). |
| Open with DEXTER | |
In the text
![\begin{figure}
\par\includegraphics[width=8cm,clip]{6673fig8.eps} \end{figure}](/articles/aa/full/2007/24/aa6673-06/img67.gif) |
Figure 7: Asymmetry versus magnitude: asymmetry begins to grow only at magnitudes greater then 22.2 which is greater than the limiting magnitude. |
| Open with DEXTER | |
In the text
![\begin{figure}
\par\includegraphics[width=8.3cm,height=7cm,clip]{6673fig9.eps}\h...
...e*{4mm}
\includegraphics[width=8.3cm,height=7cm,clip]{6673fig10.eps}\end{figure}](/articles/aa/full/2007/24/aa6673-06/img70.gif) |
Figure 8: C-A calibration and classification. Boundaries are drawn using an automated classification method (SVM) that avoids the use of a nearby sample and subjective visual classifications. Left: simulated objects, open squares: objects with B/T<0.2, filled squares: objects with B/T>0.8. Right: real objects. |
| Open with DEXTER | |
In the text
![\begin{figure}
\par\includegraphics[width=8.5cm,clip]{6673fig11.eps} \end{figure}](/articles/aa/full/2007/24/aa6673-06/img82.gif) |
Figure 9: Example of PSF fitting in Fourier space. Squares: observations, dashed line: seeing-limited MTF, dotted line: diffraction-limited MTF. The AO MTF contains higher frequencies than the seeing-limited one. The telescope diffraction limit is not reached however in this example due to the undersampling of the instrumental setup. |
| Open with DEXTER | |
In the text
![\begin{figure}
\par\includegraphics[width=8.5cm,clip]{6673fig30.eps}
\end{figure}](/articles/aa/full/2007/24/aa6673-06/img124.gif) |
Figure 10: Comparison of classification methods, show the probability that a galaxy classified with GIM2D is classified in the same morphological type by C-A. (see text for details). |
| Open with DEXTER | |
In the text
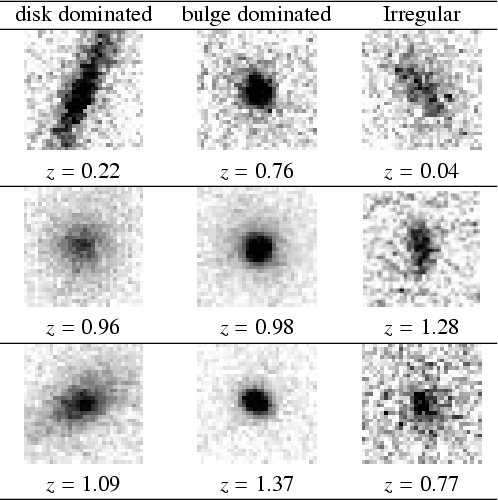 |
Figure 11:
Example of classification in the three main morphological types at different redshifts. The image size is
|
| Open with DEXTER | |
In the text
![\begin{figure}
\par\includegraphics[width=8.5cm,height=7cm,clip]{6673fig40.eps}\...
...e*{4mm}
\includegraphics[width=8.5cm,height=7cm,clip]{6673fig41.eps}\end{figure}](/articles/aa/full/2007/24/aa6673-06/img136.gif) |
Figure 12:
Comparison with ground-based observations. We performed a profile
fitting on the same real
galaxy observed with NACO ( left) and MegaCam (CFHTLS-i' band, right). The galaxy magnitude is
KAB=20.5 and i'=21.3. Surface brightness profiles were computed within the isophotal areas enclosed by pixels |
| Open with DEXTER | |
In the text
![\begin{figure}
\par\includegraphics[width=6cm,clip]{6673fig42.eps} \end{figure}](/articles/aa/full/2007/24/aa6673-06/img140.gif) |
Figure 13: Galaxy distribution: comparison between K-band and I band C-A classifications. The figure shows the probability that a galaxy in the K-band is classified in the same morphological type in the I-band. |
| Open with DEXTER | |
In the text
![\begin{figure}
\par\includegraphics[width=6cm,clip]{6673fig43.eps}
\end{figure}](/articles/aa/full/2007/24/aa6673-06/img141.gif) |
Figure 14: Comparison of classifications with different boundaries. We repeat the morphological classification with the boundaries used by Brinchmann et al. (1998). We conclude that the results do not change significantly which supports the validity of the employed method. |
| Open with DEXTER | |
In the text
![\begin{figure}
\par\includegraphics[width=7.5cm,clip]{6673fig44.eps}\end{figure}](/articles/aa/full/2007/24/aa6673-06/img144.gif) |
Figure 15: Redshift distribution for the three morphological types. We plotted the Brinchmann et al. (1998) sample (circles) and our sample observed with ACS (squares) and with NACO (triangles). Brinchmann et al. (1998) and ACS data are corrected to the R rest-frame band. The NACO sample is observed from the K-band and no correction has been applied. The ACS and NACO samples have been separated into two redshift bins (z<0.8and z>0.8). The represented redshifts are the median redshifts of each bin. |
| Open with DEXTER | |
In the text
![\begin{figure}
\par\includegraphics[width=8.5cm,height=7cm,clip]{6673fig45.eps}\...
...{4mm}
\includegraphics[width=8.5cm,height=7cm,clip]{6673fig46.eps} \end{figure}](/articles/aa/full/2007/24/aa6673-06/img145.gif) |
Figure 16: C-A cut for the ACS images. The same classification procedure has been repeated for the same sample observed with ACS in the I-band. Left: simulated objects. Right: real objects. Circles: B/T<0.2, Filled squares: B/T>0.8, crosses: real objects. Dotted line is the border used in Brinchmann et al. (1998) to separate bulge dominated from disk dominated, dashed line is the one computed in the paper. |
| Open with DEXTER | |
In the text
![\begin{figure}
\par\includegraphics[width=12cm,clip]{6673fig61.eps}
\end{figure}](/articles/aa/full/2007/24/aa6673-06/img166.gif) |
Figure A.1:
Ks corrected number counts compared with other K-band
surveys. The solid line is the best fitting power-law in the range
|
In the text