A&A 468, 587-601 (2007)
DOI: 10.1051/0004-6361:20066410
L. Christensen1 - L. Wisotzki2 - M. M. Roth2 - S. F. Sánchez3 - A. Kelz2 - K. Jahnke4
1 - European Southern Observatory, Casilla 19001, Santiago 19, Chile
2 - Astrophysikalisches Institut Potsdam, An der Sternwarte 16,
14482 Potsdam, Germany
3 - Centro Astronómico Hispano Alemán de Calar Alto, Calle Jesús Durbán Remón 2,2 04004 Almería, Spain
4 - Max-Planck-Institut für Astronomie, Königstuhl 17, 69117
Heidelberg, Germany
Received 16 September 2006 / Accepted 8 March 2007
Abstract
Aims. We search for galaxy counterparts to damped Lyman-![]() absorbers (DLAs) at z>2 towards nine quasars, which have 14 DLAs and 8 sub-DLAs in their spectra.
absorbers (DLAs) at z>2 towards nine quasars, which have 14 DLAs and 8 sub-DLAs in their spectra.
Methods. We use integral field spectroscopy to search for Ly![]() emission line objects at the redshifts of the absorption systems.
emission line objects at the redshifts of the absorption systems.
Results. Besides recovering two previously confirmed objects, we find six statistically significant candidate Ly![]() emission line objects. The candidates are identified as having wavelengths close to the DLA line where the background quasar emission is absorbed. In comparison with the six currently known Ly
emission line objects. The candidates are identified as having wavelengths close to the DLA line where the background quasar emission is absorbed. In comparison with the six currently known Ly![]() emitting DLA galaxies the candidates have similar line fluxes and line widths, while velocity offsets between the emission lines and systemic DLA redshifts are larger. The impact parameters are larger than 10 kpc, and lower column density systems are found at larger impact parameters.
emitting DLA galaxies the candidates have similar line fluxes and line widths, while velocity offsets between the emission lines and systemic DLA redshifts are larger. The impact parameters are larger than 10 kpc, and lower column density systems are found at larger impact parameters.
Conclusions. Assuming that a single gas cloud extends from the QSO line of sight to the location of the candidate emission line, we find that the average candidate DLA galaxy is surrounded by neutral gas with an exponential scale length of ![]() 5 kpc.
5 kpc.
Key words: galaxies: formation - galaxies: high-redshift - galaxies: quasars: absorption lines
Galaxy counterparts to Damped Lyman-![]() systems (DLAs) seen in
quasar (QSO) spectra have been suggested to be (proto)-disk galaxies
with line of sight clouds of neutral gas with column densities
systems (DLAs) seen in
quasar (QSO) spectra have been suggested to be (proto)-disk galaxies
with line of sight clouds of neutral gas with column densities
![]() > 2
> 2 ![]() 1020 cm-2 (Wolfe et al. 1986). Analyses of
absorption line profiles have indicated that rotational components
with velocities of
1020 cm-2 (Wolfe et al. 1986). Analyses of
absorption line profiles have indicated that rotational components
with velocities of ![]() 200 km-1 can be involved in these
systems suggesting that DLAs reside in large disk galaxies
(Ledoux et al. 1998a; Prochaska & Wolfe 1997). On the other hand, numerical simulations
show that in a hierarchical formation scenario merging proto-galactic
clumps can also give rise to the observed line profiles
(Haehnelt et al. 1998).
200 km-1 can be involved in these
systems suggesting that DLAs reside in large disk galaxies
(Ledoux et al. 1998a; Prochaska & Wolfe 1997). On the other hand, numerical simulations
show that in a hierarchical formation scenario merging proto-galactic
clumps can also give rise to the observed line profiles
(Haehnelt et al. 1998).
A large fraction of the neutral hydrogen present at z>2 is contained
in high column density DLA systems
(Lanzetta et al. 1995; Storrie-Lombardi & Wolfe 2000; Péroux et al. 2001). In addition to the classical
DLAs, clouds with column densities
1019 <
![]() < 2
< 2 ![]() 1020 cm-2 also show some
degree of damping wings, which is characteristic of DLA systems. It is
suggested that sub-DLA systems contain a significant fraction of the
neutral matter in the Universe (Péroux et al. 2003). Metallicity studies
have shown that the properties of the sub-DLA systems are similar to
those of DLA systems (Dessauges-Zavadsky et al. 2003), apart from the latter
category having large ionisation corrections (Prochaska & Herbert-Fort 2004).
1020 cm-2 also show some
degree of damping wings, which is characteristic of DLA systems. It is
suggested that sub-DLA systems contain a significant fraction of the
neutral matter in the Universe (Péroux et al. 2003). Metallicity studies
have shown that the properties of the sub-DLA systems are similar to
those of DLA systems (Dessauges-Zavadsky et al. 2003), apart from the latter
category having large ionisation corrections (Prochaska & Herbert-Fort 2004).
The association of DLAs with galaxies has been a subject of much
study. Originally, either space-based or ground-based deep images
were obtained to identify objects near the line of sight to the QSOs
(Warren et al. 2001; Steidel et al. 1995; Le Brun et al. 1997). To confirm nearby objects as
galaxies that are responsible for the DLA lines in the QSO spectra,
follow-up spectra are needed to find the galaxy redshifts. At z<1,
confirmations of 14 systems exist to date (Rao et al. 2003; Chen et al. 2005; Lacy et al. 2003; Chen & Lanzetta 2003, and references therein), while at ![]() only 6 DLA galaxies are confirmed through spectroscopic observations of Ly
only 6 DLA galaxies are confirmed through spectroscopic observations of Ly![]() emission from the DLA galaxies
(Møller et al. 2004; Djorgovski et al. 1996; Møller et al. 1998; Møller & Warren 1993; Møller et al. 2002; Leibundgut & Robertson 1999),
three of which are located at the same redshifts as the QSOs
themselves. Other techniques to identify DLA galaxies involve
narrow-band imaging (e.g. Fynbo et al. 1999,2000) or Fabry-Perot
imaging. A Fabry-Perot imaging study of several QSO fields did not
result in detections of emission from DLA galaxies
(Lowenthal et al. 1995), while recently the same method was used to
identify a few emission line candidates (Kulkarni et al. 2006).
emission from the DLA galaxies
(Møller et al. 2004; Djorgovski et al. 1996; Møller et al. 1998; Møller & Warren 1993; Møller et al. 2002; Leibundgut & Robertson 1999),
three of which are located at the same redshifts as the QSOs
themselves. Other techniques to identify DLA galaxies involve
narrow-band imaging (e.g. Fynbo et al. 1999,2000) or Fabry-Perot
imaging. A Fabry-Perot imaging study of several QSO fields did not
result in detections of emission from DLA galaxies
(Lowenthal et al. 1995), while recently the same method was used to
identify a few emission line candidates (Kulkarni et al. 2006).
Integral field spectroscopy (IFS) presents an alternative that
provides images and spectra at each point on the sky
simultaneously. This technique can be used to look for emission line
objects at known wavelengths, but unknown spatial location. This
technique is ideally suited to look for Ly![]() emission lines from the
galaxies responsible for strong QSO absorption lines. At the
Ly
emission lines from the
galaxies responsible for strong QSO absorption lines. At the
Ly![]() wavelength corresponding to the redshift of the DLA system, the
QSO emission has been absorbed, enabling us to locate emission line
objects very near to the QSO line of sight. Because of the large
column densities in DLAs and the resonant nature of Ly
wavelength corresponding to the redshift of the DLA system, the
QSO emission has been absorbed, enabling us to locate emission line
objects very near to the QSO line of sight. Because of the large
column densities in DLAs and the resonant nature of Ly![]() photons the
corresponding emission line may be offset in velocity space relative
to the DLA line (e.g. Leibundgut & Robertson 1999), but such an offset is
not always observed (e.g. Møller et al. 2004).
photons the
corresponding emission line may be offset in velocity space relative
to the DLA line (e.g. Leibundgut & Robertson 1999), but such an offset is
not always observed (e.g. Møller et al. 2004).
IFS searches for emission from DLA galaxies towards two QSOs have
resulted in upper limits for their fluxes
(Ledoux et al. 1998b; Petitjean et al. 1996), while a sub-DLA galaxy previously known
to be a Ly![]() emitter was confirmed with IFS (Christensen et al. 2004).
Here we present a survey using IFS to look for Ly
emitter was confirmed with IFS (Christensen et al. 2004).
Here we present a survey using IFS to look for Ly![]() emitting DLA galaxies. Section 2 describes the sample of QSOs
included in the survey, which are known previously to have DLAs and
sub-DLAs in their spectra. Section 3 describes the
observations and data reduction. In Sect. 4 the
method of detecting emission line candidates is described.
Section 5 presents the results and comments on
each object. Properties of the Ly
emitting DLA galaxies. Section 2 describes the sample of QSOs
included in the survey, which are known previously to have DLAs and
sub-DLAs in their spectra. Section 3 describes the
observations and data reduction. In Sect. 4 the
method of detecting emission line candidates is described.
Section 5 presents the results and comments on
each object. Properties of the Ly![]() emission candidates detected in
the survey in relation to the six previously known Ly
emission candidates detected in
the survey in relation to the six previously known Ly![]() emitting DLA galaxies are presented in Sect. 6. Section 7 summarises our findings. A flat cosmology
with H0=70 km s-1 Mpc-1,
emitting DLA galaxies are presented in Sect. 6. Section 7 summarises our findings. A flat cosmology
with H0=70 km s-1 Mpc-1,
![]() ,
and
,
and
![]() is used throughout.
is used throughout.
This study, as well as previous ones that try to identify the host
galaxies of DLA systems, can be biased since the galaxy observed at
the right redshift likely belongs to the brightest emission line object
close to the line of sight. In the case that the host galaxy is a much
fainter galaxy in a group, it will not be identified correctly. In
the remaining part of the paper, an "identified'' DLA galaxy refers to
observations that show (line) emission from independent observations,
while the "candidates'' are only reported in these IFS observations. Although extensive tests are done on the data to distinguish the candidates from potential artifacts, independent
observations are needed to prove them as Ly![]() emitters connected with the DLAs.
emitters connected with the DLAs.
Table 1: List of the observed DLA and sub-DLA systems with column densities and metallicities taken from the literature.
We selected a number of DLA systems without previous detections of
associated Ly![]() emission. The selected QSOs with known DLAs were
chosen based on the following criteria
emission. The selected QSOs with known DLAs were
chosen based on the following criteria
Table 2: Log of the observations. The last two columns show the average seeing during the integrations and the photometric conditions derived from the A&G camera images.
To increase the sample size with a minimum number of pointings we
preferentially selected QSOs with multiple DLAs. IFS covers a range of
wavelengths, and correspondingly Ly![]() emission at a large range of
redshifts in the line of sight for each QSO. However, in retrospect,
this can affect the emission line detections, because extinction in
foreground DLAs could obscure emission from background ones when the
galaxies lie in the same line of sight. Hence, upper limits on
detections of the higher redshift systems can be biased.
emission at a large range of
redshifts in the line of sight for each QSO. However, in retrospect,
this can affect the emission line detections, because extinction in
foreground DLAs could obscure emission from background ones when the
galaxies lie in the same line of sight. Hence, upper limits on
detections of the higher redshift systems can be biased.
From the list of DLA systems compiled by S. Curran![]() , we found 66 QSOs
matching these criteria in 2003. More recently, detections of DLAs in
the Sloan Digitized Sky Survey QSO spectra have greatly increased the
number of known DLAs (Prochaska et al. 2005; Prochaska & Herbert-Fort 2004). A systematic
survey of all 66 objects would require a large amount of time with
present instruments, so we selected a few systems based on their
observability during the allocated observing runs. We avoided DLAs
with Ly
, we found 66 QSOs
matching these criteria in 2003. More recently, detections of DLAs in
the Sloan Digitized Sky Survey QSO spectra have greatly increased the
number of known DLAs (Prochaska et al. 2005; Prochaska & Herbert-Fort 2004). A systematic
survey of all 66 objects would require a large amount of time with
present instruments, so we selected a few systems based on their
observability during the allocated observing runs. We avoided DLAs
with Ly![]() absorption lines close to sky emission lines.
absorption lines close to sky emission lines.
The total sample consists of 9 QSOs with a total number of 14 DLA systems as listed in Table 1. These QSOs have an additional 8 sub-DLAs which are included in the survey. Because of the small number of DLAs involved in the survey, a proper statistical study is not the aim of this paper. Instead we focus on a few systems to exploit the benefits of IFS for this kind of investigation.
To study the applicability of IFS in identifying DLA galaxies we
initially observed DLA galaxies where Ly![]() emission had been reported
previously in the literature. Two of these systems could be observed
during our runs; Q2233+131 and PHL 1222, originally
identified by Steidel et al. (1995), Djorgovski et al. (1996) and
Møller et al. (1998). Both objects are reported to have extended
Ly
emission had been reported
previously in the literature. Two of these systems could be observed
during our runs; Q2233+131 and PHL 1222, originally
identified by Steidel et al. (1995), Djorgovski et al. (1996) and
Møller et al. (1998). Both objects are reported to have extended
Ly![]() emission (Fynbo et al. 1999; Christensen et al. 2004). Table 1 includes
these two previously known Ly
emission (Fynbo et al. 1999; Christensen et al. 2004). Table 1 includes
these two previously known Ly![]() emitting DLA and sub-DLA galaxies,
although the criteria listed above are not satisfied. The absorption
system towards Q2233+131 has a column density that classifies it as a sub-DLA. Unless otherwise noted, these two objects are kept separate from the detection of candidate emission line objects in the remainder of the paper.
emitting DLA and sub-DLA galaxies,
although the criteria listed above are not satisfied. The absorption
system towards Q2233+131 has a column density that classifies it as a sub-DLA. Unless otherwise noted, these two objects are kept separate from the detection of candidate emission line objects in the remainder of the paper.
Most of the DLAs in the IFS study lie towards bright QSOs (R<19).
This ensured that the PSF variations as a function of wavelength could
be determined, which was necessary for the subtraction of the QSO emission. Bright QSOs had larger residuals from the subtraction of
the continuum emission, which potentially affected out ability to
recover emission line objects that were offset in velocity space and
located closer than 1
![]() to the QSO line of sight. However, tests
with artificial objects showed that this was a minor problem for the
data set (see Sect. 5.3).
to the QSO line of sight. However, tests
with artificial objects showed that this was a minor problem for the
data set (see Sect. 5.3).
Using the Potsdam Multi Aperture Spectrophotometer (PMAS) mounted on
the 3.5 m telescope at Calar Alto we observed the objects listed in
Table 2 during several runs from 2002-2004. The PMAS
integral field unit (IFU) was used in the standard configuration where
256 fibres are coupled to a 16 ![]() 16 element lens array. During
the observations each fibre covered 0
16 element lens array. During
the observations each fibre covered 0
![]() 5
5 ![]() 0
0
![]() 5 on the
sky giving a field of view of 8
5 on the
sky giving a field of view of 8
![]()
![]() 8
8
![]() .
Each fibre
resulted in a spatial element (spaxel) represented by a single
spectrum. The 256 spectra were recorded on a 2k
.
Each fibre
resulted in a spatial element (spaxel) represented by a single
spectrum. The 256 spectra were recorded on a 2k ![]() 4k CCD which
was read out in a 2
4k CCD which
was read out in a 2 ![]() 2 binned mode. With a separation of 7 pixels between individual spectra, the fibre to fibre cross-talk was
negligible (less than 0.4% for an extraction of all 7 pixels).
Detailed overviews of the PMAS instrument and capabilities are given
in Roth et al. (2000,2005).
2 binned mode. With a separation of 7 pixels between individual spectra, the fibre to fibre cross-talk was
negligible (less than 0.4% for an extraction of all 7 pixels).
Detailed overviews of the PMAS instrument and capabilities are given
in Roth et al. (2000,2005).
For individual exposures a maximum time of 1800s was used because of
the large number of pixels affected by cosmic ray hits. Furthermore,
because of varying conditions such as the atmospheric transmission and
seeing, the total exposure time for each object was adjusted, or
sometimes an observation was repeated under better conditions. The
photometric conditions during observations were monitored in real time
with the PMAS acquisition and guiding camera (A&G camera) which is
equipped with a 1k ![]() 1k CCD. Seeing values listed in
Table 2 refer to the seeing FWHM measured in
the A&G camera images. Determining actual spectrophotometric
conditions requires monitoring of the extinction coefficients which
cannot be determined from the A&G camera images. In
Table 2 "stable'' means that the photometry of the
guiding star was constant within 1% during the observations.
1k CCD. Seeing values listed in
Table 2 refer to the seeing FWHM measured in
the A&G camera images. Determining actual spectrophotometric
conditions requires monitoring of the extinction coefficients which
cannot be determined from the A&G camera images. In
Table 2 "stable'' means that the photometry of the
guiding star was constant within 1% during the observations.
The data were obtained using 2 gratings; one with 300 lines mm-1and one with 600 lines mm-1, set at a chosen tilt to cover a selected wavelength range. The FWHM of the sky lines were measured to be 6.4 and 3.2 Å, respectively. Observations of spectrophotometric standard stars were carried out at the beginning and end of each night at the grating position used for the observations.
Data reduction was done by first subtracting an average bias frame. Before extracting the 256 spectra most cosmic ray hits were removed by the routine described in Pych (2004). A high threshold was chosen such that not all cosmic rays were removed, because a low threshold would also remove bright sky emission lines from some spectra. Remaining cosmic rays were removed from the extracted spectra using the program L.A. Cosmic (van Dokkum 2001).
The locations of the spectra on the CCD were found from exposures of a continuum lamp, taken either before or after the science exposures, using a tracing algorithm developed for the IDL based PMAS data reduction package P3D (Becker 2002). The spectral extraction was done in two ways; a "simple extraction'' that added all flux from each spectrum on the CCD (i.e. an extraction width of 7 pixels), and another method that took into account the profile of the spectrum on the CCD. This second method assumed that the spectral profiles were represented by Gaussian functions (Gaussian extraction) where the widths were allowed to vary with wavelength. Widths were determined by fits to each of the 256 spectra as a function of the wavelength, and the extraction used these width in combination with the centre found from the tracing algorithm. The Gaussian profile is an approximation because the profiles are not strictly Gaussian. The second method increased the signal-to-noise ratio by >10% for faint objects and therefore unless otherwise noted, the results from the "Gaussian extraction'' data cubes will be reported (see also Sánchez 2006).
After extraction, the spectra were wavelength calibrated using exposures of emission line lamps taken just before or after the observations. The wavelength calibration was done using the P3D reduction tool. Comparisons with sky emission lines indicated an accuracy of the wavelength calibration of about 10% of the spectral resolution.
The spectra show a wavelength dependent fibre to fibre transmission. To correct for this effect, we extracted sky spectra obtained from twilight sky observations in the same way as the science observations. A one dimensional average sky spectrum was calculated. Each of the 256 spectra were divided by this average spectrum, and the fraction was fit by a polynomial function to reduce noise. These polynomials were used to flat field the science spectra.
Before combining individual frames, the extracted spectra were arranged into data cubes. Each data cube was corrected for extinction using an average extinction curve for Calar Alto (Hopp & Fernandez 2002). The data cube combination took into account a correction for the differential atmospheric refraction using a theoretical prediction (Filippenko 1982). Relative spatial shifts between individual data cubes were determined from a two-dimensional Gaussian fit to the QSO PSF at a wavelength close to the strong DLA absorption lines.
Subtraction of the sky background was an iterative process because the locations of the emission line objects of interest were not known beforehand. PMAS, in the configuration used, does not have specifically allocated sky fibres. Instead, we selected 10-20 fibres uncontaminated by the QSO emission and the average spectrum was subtracted from all 256 spectra. Different spaxel selections were examined visually to select an appropriate sky spectrum which had no emission line or noisy pixels in the spectral region of interest.
Flux calibration was done in the standard way using observations of spectrophotometric standard stars. A one-dimensional spectrum of the standard star was constructed by co-adding flux from all 256 spaxels. This was used to create a sensitivity function that could be applied to each of the 256 spectra in the science exposures. For non-photometric nights the flux calibrated spectra were compared with QSO spectra from the literature to estimate photometric errors. However, no correction factor was applied to our spectra, because an intrinsic variability of the QSOs would make such scaling uncertain. For some cases we note in Sect. 5.5 that there are differences which could be caused by either non-photometric conditions or intrinsic variability.
For reference we show spectra of the target QSOs in
Fig. 1. Where present, metal absorption lines
corresponding to the highest column density DLAs are indicated. For
QSOs with multiple DLAs lines only the DLA lines and their redshifts
are indicated since the wavelength coverage does not include lines
redwards of the QSO Ly![]() line. A detailed analysis of metal
absorption lines requires higher resolution spectroscopy as presented
elsewhere (e.g. Dessauges-Zavadsky et al. 2003; Péroux et al. 2003; Prochaska et al. 2003c). DLA redshifts derived from the metal absorption lines were consistent with
those reported in the literature within the accuracy of the wavelength
calibration of the data cubes.
line. A detailed analysis of metal
absorption lines requires higher resolution spectroscopy as presented
elsewhere (e.g. Dessauges-Zavadsky et al. 2003; Péroux et al. 2003; Prochaska et al. 2003c). DLA redshifts derived from the metal absorption lines were consistent with
those reported in the literature within the accuracy of the wavelength
calibration of the data cubes.
![\begin{figure}
\par\includegraphics[height=20.5cm,width=14.6cm,clip]{6410_f1.ps}\end{figure}](/articles/aa/full/2007/23/aa6410-06/img23.gif) |
Figure 1:
QSO spectra extracted with a 3
|
| Open with DEXTER | |
The observations covered the wavelengths of Ly![]() for all but one of
the strong absorption systems listed in Table 1. Only
the highest redshift sub-DLA system towards Q2155+1358 was not
covered, i.e. the total number of systems included in this analysis is
21 DLA and sub-DLA systems.
for all but one of
the strong absorption systems listed in Table 1. Only
the highest redshift sub-DLA system towards Q2155+1358 was not
covered, i.e. the total number of systems included in this analysis is
21 DLA and sub-DLA systems.
For this project we are only interested in small wavelength regions
corresponding to Ly![]() at the DLA redshifts, and thus the search for
candidate galaxies could be carried out using customised narrow-band
filters. IFS, on the other hand, has the advantage that the widths of
the narrow-band filters can be adjusted to match those of the emission
lines. Typically customised narrow-band filters have a larger
transmission FWHM than the spectral resolution of IFS data.
Hence, IFS allows detection of emission line objects with a higher
signal-to-noise ratio than that possible with narrow-band filters. A disadvantage is the relatively small field of view of current IFUs,
but this is not a serious concern. One can estimate the expected
sizes of DLA galaxies (see Wolfe et al. 1986). Using a Schechter luminosity function and a power-law relation between the disk luminosity and gas radius given by the Holmberg relation
at the DLA redshifts, and thus the search for
candidate galaxies could be carried out using customised narrow-band
filters. IFS, on the other hand, has the advantage that the widths of
the narrow-band filters can be adjusted to match those of the emission
lines. Typically customised narrow-band filters have a larger
transmission FWHM than the spectral resolution of IFS data.
Hence, IFS allows detection of emission line objects with a higher
signal-to-noise ratio than that possible with narrow-band filters. A disadvantage is the relatively small field of view of current IFUs,
but this is not a serious concern. One can estimate the expected
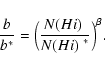
sizes of DLA galaxies (see Wolfe et al. 1986). Using a Schechter luminosity function and a power-law relation between the disk luminosity and gas radius given by the Holmberg relation
![]() ,
one can calculate the expected impact
parameter. Combining
,
one can calculate the expected impact
parameter. Combining
![]() found for DLA galaxies at z<1(Chen et al. 2005) with the luminosity function in for z=3 galaxies
(Poli et al. 2003) one finds
found for DLA galaxies at z<1(Chen et al. 2005) with the luminosity function in for z=3 galaxies
(Poli et al. 2003) one finds
![]() kpc. If DLA galaxies are
similar to or fainter than L* galaxies this implies that DLA galaxies at z>2 are expected to lie closer than
kpc. If DLA galaxies are
similar to or fainter than L* galaxies this implies that DLA galaxies at z>2 are expected to lie closer than ![]() 4
4
![]() from
the QSO line of sight. The small field of view of IFUs is therefore
well suited to search for Ly
from
the QSO line of sight. The small field of view of IFUs is therefore
well suited to search for Ly![]() emission from DLA galaxies.
emission from DLA galaxies.
The estimated galaxy sizes are highly dependent on the parameters of
the DLA galaxy luminosity and slope ![]() .
Most probably, high
redshift DLA galaxies are not regular disks like those in the local
universe. Numerical models of DLAs predict that the galaxies are
mostly smaller than 10 kpc, while observations that give limits on the
star-formation rates associated with DLAs suggest that DLAs are
located in neutral gas around Lyman break galaxies (Wolfe & Chen 2006).
As DLA galaxies at z>2 are generally found to be fainter than an L* galaxy (Colbert & Malkan 2002), we choose to consider only objects with impact parameters smaller than 30 kpc for a more detailed
analysis.
.
Most probably, high
redshift DLA galaxies are not regular disks like those in the local
universe. Numerical models of DLAs predict that the galaxies are
mostly smaller than 10 kpc, while observations that give limits on the
star-formation rates associated with DLAs suggest that DLAs are
located in neutral gas around Lyman break galaxies (Wolfe & Chen 2006).
As DLA galaxies at z>2 are generally found to be fainter than an L* galaxy (Colbert & Malkan 2002), we choose to consider only objects with impact parameters smaller than 30 kpc for a more detailed
analysis.
The impact parameters that we measure in the data correspond to the radially projected distances so the real distances to the absorber can be larger. Two candidates are found at impact parameters larger than 30 kpc, and they are likely not associated directly with the absorbers themselves.
Some Ly![]() emission lines from DLA galaxies are offset from the QSO-
DLA line by
emission lines from DLA galaxies are offset from the QSO-
DLA line by ![]() 200 km s-1 (Møller et al. 2002), whereas
Ly
200 km s-1 (Møller et al. 2002), whereas
Ly![]() emission from high redshift galaxies can have even larger
offsets from the galaxy systemic redshift (Shapley et al. 2003). We
therefore chose to focus on regions in the data cubes with velocities
ranging from approximately -1000 to +1000 km s-1 from the DLA lines.
emission from high redshift galaxies can have even larger
offsets from the galaxy systemic redshift (Shapley et al. 2003). We
therefore chose to focus on regions in the data cubes with velocities
ranging from approximately -1000 to +1000 km s-1 from the DLA lines.
First, the reduced data cubes were stacked in a two-dimensional frame and inspected visually around the DLA lines for emission line objects. When the spatial offset from the QSO is larger than the seeing, or alternatively when the QSO is very faint, emission line objects can be identified directly because of the ordering of the spectra in the stacked spectrum. Where no objects could be detected visually further sampling of the data cubes was necessary to increase the signal-to-noise ratio to detect candidate emission line objects. Inspections of the data cubes was done using the Euro3D visualisation tool (Sánchez 2004).
From the reduced, sky-subtracted and combined data cubes, narrow-band
images were created with an initial width of 10-15 Å depending on
the spectral resolution of the observations. A set of images was
created offset by -10 to +10 Å from the DLA line to allow for
possible velocity shifts of the Ly![]() emission line,
and inspected visually for objects brighter than the background. If
detected, spectra from these brighter regions were co-added and
inspected for emission lines at the wavelength chosen in the
narrow-band image. This step was necessary to discriminate between
emission lines and individual noisy spectra. It is known that three
blocks of 16 fibres, i.e. 48 fibres in an area of 1
emission line,
and inspected visually for objects brighter than the background. If
detected, spectra from these brighter regions were co-added and
inspected for emission lines at the wavelength chosen in the
narrow-band image. This step was necessary to discriminate between
emission lines and individual noisy spectra. It is known that three
blocks of 16 fibres, i.e. 48 fibres in an area of 1
![]() 5 to the west
in the field of view, have lower than average transmission. The
effect of correcting for the total throughput was that these spectra
had lower signal-to-noise ratios. When narrow-band images were created
from the cubes, the higher variance in these spaxels could result in
extreme values, seemingly inconsistent with the neighboring spaxels.
Only by looking at the spectrum associated with a bright spaxel could
it be determined if an emission line was present, or if the spectrum
was just noisy. If an emission line was seen, a second pass
narrow-band image was created using the value of the emission line
width to increase the signal of the detection. A second pass
one-dimensional spectrum was created after inspecting the narrow-band
image for more bright spaxels surrounding the emission line
candidate. This procedure was iterated until the signal in either
narrow-band images or spectra did not increase. We found that an interactive visual identification of faint emission lines was more effective than an automatic routine.
5 to the west
in the field of view, have lower than average transmission. The
effect of correcting for the total throughput was that these spectra
had lower signal-to-noise ratios. When narrow-band images were created
from the cubes, the higher variance in these spaxels could result in
extreme values, seemingly inconsistent with the neighboring spaxels.
Only by looking at the spectrum associated with a bright spaxel could
it be determined if an emission line was present, or if the spectrum
was just noisy. If an emission line was seen, a second pass
narrow-band image was created using the value of the emission line
width to increase the signal of the detection. A second pass
one-dimensional spectrum was created after inspecting the narrow-band
image for more bright spaxels surrounding the emission line
candidate. This procedure was iterated until the signal in either
narrow-band images or spectra did not increase. We found that an interactive visual identification of faint emission lines was more effective than an automatic routine.
To allow a better visual detection of emission line objects, the
narrow-band images were interpolated to pixel scales 0
![]() 2 pixel-1 as shown in Fig. 2. In all panels
the images are 8
2 pixel-1 as shown in Fig. 2. In all panels
the images are 8
![]() by 8
by 8
![]() ,
with orientation north up and
east left. The left panels show interpolated images of the QSO at
wavelengths near to the DLA line. Contours correspond to an image
centered on the visually detected emission feature close to the DLA redshift. In the middle panels in Fig. 2 the
plots are reversed, such that the image shows the emission line object
and the contours correspond to the QSO narrow-band image. Here, the
innermost contour corresponds to the seeing FWHM. To enhance
the visibility of the candidates the QSO emission was subtracted from
the data cubes before creating the images. This subtraction of the
QSO emission was done using a simple approach
(see Christensen et al. 2006). A scale factor was determined for each
spaxel by dividing each spectrum by the extracted one-dimensional QSO spectrum. Using this scale factor, the QSO emission was subtracted, a process which retains objects with spectral characteristics different from the QSO in the data cube.
,
with orientation north up and
east left. The left panels show interpolated images of the QSO at
wavelengths near to the DLA line. Contours correspond to an image
centered on the visually detected emission feature close to the DLA redshift. In the middle panels in Fig. 2 the
plots are reversed, such that the image shows the emission line object
and the contours correspond to the QSO narrow-band image. Here, the
innermost contour corresponds to the seeing FWHM. To enhance
the visibility of the candidates the QSO emission was subtracted from
the data cubes before creating the images. This subtraction of the
QSO emission was done using a simple approach
(see Christensen et al. 2006). A scale factor was determined for each
spaxel by dividing each spectrum by the extracted one-dimensional QSO spectrum. Using this scale factor, the QSO emission was subtracted, a process which retains objects with spectral characteristics different from the QSO in the data cube.
The spectra of the candidates are shown in the right hand column in
Fig. 2. These are created by co-adding spectra
from between 4 and 10 spaxels. The dotted line corresponds to the
1![]() noise level determined from a statistical analysis of the
pixel values in the data cube, while the lower sub-panels show the
background noise spectra in the data cubes, obtained from 4-10 background spaxels.
noise level determined from a statistical analysis of the
pixel values in the data cube, while the lower sub-panels show the
background noise spectra in the data cubes, obtained from 4-10 background spaxels.
![\begin{figure}
\par\includegraphics[height=19.9cm,width=12.5cm,clip]{6410_f2.ps}\end{figure}](/articles/aa/full/2007/23/aa6410-06/img28.gif) |
Figure 2:
Left panels: narrow-band images of the QSOs with
overlayed contours of narrow-band images centered on the
Ly |
| Open with DEXTER | |
Properties of the candidate objects corresponding to those with
spectra in Fig. 2 are listed in
Table 3. Offsets in RA, Dec from the QSO and
the corresponding projected distance at the DLA redshift are listed in
Cols. 2-4. Emission lines were fit using ngaussfit in
IRAF, redshifts listed in Col. 5 are derived. Fluxes in Col. 6
are derived from the Gaussian fits, and errors in the peak intensity,
line width, and continuum placement are propagated to calculate the
uncertainties. The fluxes have not been corrected for the Galactic
extinction. The flux measurements and the associated errors indicate
that most of the candidates are detected with a signal-to-noise ratio
<![]() .
Column 7 gives the velocity difference between the
systemic DLA redshift and the candidate Ly
.
Column 7 gives the velocity difference between the
systemic DLA redshift and the candidate Ly![]() emission lines. We
integrate the signal-to-noise estimate over the emission line (Col. 8),
emission lines. We
integrate the signal-to-noise estimate over the emission line (Col. 8),
![]() ,
where f is
the line flux, N is the number of pixels the emission line covers
and
,
where f is
the line flux, N is the number of pixels the emission line covers
and ![]() is the noise in adjacent wavelength intervals. Column 9
gives the observed emission line FWHM after correcting for
the instrumental resolution. Finally Col. 10 gives the significance
classes of the candidate detection, which is explained in Sect. 5.1.
is the noise in adjacent wavelength intervals. Column 9
gives the observed emission line FWHM after correcting for
the instrumental resolution. Finally Col. 10 gives the significance
classes of the candidate detection, which is explained in Sect. 5.1.
Columns 3 and 4 in Table 4 list the values of Galactic reddening towards each QSO (Schlegel et al. 1998), and the correction factors to be applied to the candidate fluxes for a Milky Way extinction curve (Fitzpatrick 1999).
Table 3:
Properties of candidate Ly![]() emission lines. Columns 2-4 list the offsets of the candidate in RA and Dec and in projected kpc at the Ly
emission lines. Columns 2-4 list the offsets of the candidate in RA and Dec and in projected kpc at the Ly![]() emission redshifts (in Col. 5),
respectively. Column 6 lists the integrated Ly
emission redshifts (in Col. 5),
respectively. Column 6 lists the integrated Ly![]() flux in units of
10-17 erg cm-2 s-1, and Col. 7 the velocity offset from the DLA redshift. Column 8 lists the integrated signal-to-noise ratio of the Ly
flux in units of
10-17 erg cm-2 s-1, and Col. 7 the velocity offset from the DLA redshift. Column 8 lists the integrated signal-to-noise ratio of the Ly![]() emission line, and Col. 9 gives the line width of the
emission lines. Fluxes have not been corrected for Galactic extinction. Column 10 lists the significance class of the detections as described in Sect. 5.5. "Conf.''
implies candidates that were confirmed previously (Djorgovski et al. 1996; Møller et al. 1998).
emission line, and Col. 9 gives the line width of the
emission lines. Fluxes have not been corrected for Galactic extinction. Column 10 lists the significance class of the detections as described in Sect. 5.5. "Conf.''
implies candidates that were confirmed previously (Djorgovski et al. 1996; Møller et al. 1998).
This section describes the classification of the emission line candidates. We estimate the contamination from spurious detections and from interlopers. Notes on each observed object are presented as well.
To estimate how reliable the candidate detection was, various tests were applied to the data cubes. The candidates were assigned a significance class: 1, 2, 3, and 4 according to how many of the following tests were passed.
Table 4: Columns 2 and 3 give values of the Galactic reddening and the corresponding correction factor to be applied to the emission line candidates.
In the data cubes where no candidates were found, we estimated the
upper limits for the emission line fluxes. Spectra from spaxels
within one seeing element (e.g. 4 spaxels corresponding to a seeing of 1
![]() )
were co-added to create a one-dimensional spectrum. Artificial emission lines with varying line fluxes were added to this spectrum at the DLA wavelength, and Gaussian profile fits to these
lines were used to estimate the detection level. The results are
listed in Table 5. The varying limits are due to
the wavelength dependent noise in the data cubes and in particular the
presence of residuals from nearby sky emission lines.
)
were co-added to create a one-dimensional spectrum. Artificial emission lines with varying line fluxes were added to this spectrum at the DLA wavelength, and Gaussian profile fits to these
lines were used to estimate the detection level. The results are
listed in Table 5. The varying limits are due to
the wavelength dependent noise in the data cubes and in particular the
presence of residuals from nearby sky emission lines.
To investigate how the efficiency of the visual inspection depended on object properties, several experiments with artificial data cubes were made. Similar to artificial experiments for one- and two-dimensional data sets, artificial emission line objects were added to the data cubes. These objects were described by the location in RA and Dec, central wavelength, peak emission intensity, and the widths in RA, Dec and wavelength. For simplicity we assumed that an emission line object seen as a point source in the data cube could be represented by a Gaussian profile in each direction, i.e. described by a Gaussian ellipsoid in the data cube.
We first tested completely simulated data cubes with statistical noise
levels corresponding to the typical noise level in the combined data
cubes. An emission line object with a flux of
5 ![]() 10-17 erg cm-2 s-1, a width of 800 km s-1, and spatial
FWHM of 1
10-17 erg cm-2 s-1, a width of 800 km s-1, and spatial
FWHM of 1
![]() was placed at a previously known
wavelength. In the stacked spectra no objects could be seen
immediately. The emission line was only identified after inspecting
the data cube in the visualisation tool, and it was extracted and
analysed in the same way as the real data. Similar tests were made by
adding an emission line to a real data cube, where the background
noise included the systematic noise as well as the pure Poissonian
noise. These tests produced similar results for the faint emission
lines with Ly
was placed at a previously known
wavelength. In the stacked spectra no objects could be seen
immediately. The emission line was only identified after inspecting
the data cube in the visualisation tool, and it was extracted and
analysed in the same way as the real data. Similar tests were made by
adding an emission line to a real data cube, where the background
noise included the systematic noise as well as the pure Poissonian
noise. These tests produced similar results for the faint emission
lines with Ly![]() flux
flux ![]()
![]() 10-17 erg cm-2 s-1, i.e. 1) the
emission line flux could be recovered within uncertainties, 2) even at
very small impact parameters the object could be found 3) the
reconstructed PSF of the emission line object was irregular as in any
of the images in Fig. 2.
10-17 erg cm-2 s-1, i.e. 1) the
emission line flux could be recovered within uncertainties, 2) even at
very small impact parameters the object could be found 3) the
reconstructed PSF of the emission line object was irregular as in any
of the images in Fig. 2.
Table 5:
DLA and sub-DLA systems where no candidate emission lines
are found and 3![]() upper limits for the line fluxes. Fluxes
are in units of 10-17 erg cm-2 s-1.
upper limits for the line fluxes. Fluxes
are in units of 10-17 erg cm-2 s-1.
We also tested an automatic routine where the re-detection of the
artificial objects was done with no visual intervention. A set of
narrow-band images were created in wavelength ranges around the
artificial line. For the detection of an emission line the location
was constrained to be within ![]() 10 Å of the input central
wavelengths. These images were smoothed and a two-dimensional
Gaussian profile was fit to the images. When an object was detected
above a certain threshold, spaxels around the centre within the seeing
FWHM were co-added. A series of tests showed that the
recovered flux was consistent within 1
10 Å of the input central
wavelengths. These images were smoothed and a two-dimensional
Gaussian profile was fit to the images. When an object was detected
above a certain threshold, spaxels around the centre within the seeing
FWHM were co-added. A series of tests showed that the
recovered flux was consistent within 1![]() errors for fluxes down
to f=5
errors for fluxes down
to f=5 ![]() 10-17 erg cm-2 s-1. In a typical data cube this was also the
detection limit where 50% of the objects were re-identified, while
the fraction of re-identified emission lines at this flux level from a visual inspection was larger.
10-17 erg cm-2 s-1. In a typical data cube this was also the
detection limit where 50% of the objects were re-identified, while
the fraction of re-identified emission lines at this flux level from a visual inspection was larger.
Tests on the frequency of false detections in data cubes where no objects were present showed that simultaneous detections of objects in narrow-band images and associated spectra with S/N > 3 occurred at a rate of less than 5% in a series of experiments. Therefore false detections cannot explain the large number of candidate objects.
We estimate here whether the detected candidates are likely to be
field Ly![]() emitters having no association with the DLAs.
Observations of high redshift objects have partly focused on detecting
Ly
emitters having no association with the DLAs.
Observations of high redshift objects have partly focused on detecting
Ly![]() emission from galaxies to determine the global comoving
star-formation rates (e.g. Hu et al. 1998,2004). The density of
Ly
emission from galaxies to determine the global comoving
star-formation rates (e.g. Hu et al. 1998,2004). The density of
Ly![]() emitters at
emitters at ![]() is estimated to be 15 000 deg-2
is estimated to be 15 000 deg-2
![]() with line fluxes brighter than a mean of f=1.5
with line fluxes brighter than a mean of f=1.5 ![]() 10-17 erg cm-2 s-1 (Hu et al. 1998; Kudritzki et al. 2000). From the luminosity function at
10-17 erg cm-2 s-1 (Hu et al. 1998; Kudritzki et al. 2000). From the luminosity function at
![]() (van Breukelen et al. 2005), the expected number of field
Ly
(van Breukelen et al. 2005), the expected number of field
Ly![]() emitters at a flux limit of 5
emitters at a flux limit of 5 ![]() 10-17 erg cm-2 s-1 is
1.7
10-17 erg cm-2 s-1 is
1.7 ![]() 10-4 arcsec-2
10-4 arcsec-2
![]() .
In our survey,
the 9 data cubes sample a total redshift interval of
.
In our survey,
the 9 data cubes sample a total redshift interval of
![]() around
around ![]() .
Statistically, it is expected that there are 0.2 field Ly
.
Statistically, it is expected that there are 0.2 field Ly![]() emitters in the whole sample presented here. Because
these very faint lines are difficult to locate when the approximate
wavelength is not known in advance, we did not look for field emission
objects. The negligible number of expected field emitters furthermore
shows that the emission candidates, if proved to be real, are unlikely
to be interloping field Ly
emitters in the whole sample presented here. Because
these very faint lines are difficult to locate when the approximate
wavelength is not known in advance, we did not look for field emission
objects. The negligible number of expected field emitters furthermore
shows that the emission candidates, if proved to be real, are unlikely
to be interloping field Ly![]() emitters. They are much more likely to
be associated with the DLA galaxies.
emitters. They are much more likely to
be associated with the DLA galaxies.
This section explains the significance of the candidates for each individual QSO.
Q0151+045A. - This is a
![]() system at
system at
![]() .
After flux calibration,
the QSO spectrum is 2 mag brighter than that presented in
Møller et al. (1998). The low instrument sensitivity at 3560 Å
combined with a variable extinction coefficient at Calar Alto makes
the calibration uncertain.
.
After flux calibration,
the QSO spectrum is 2 mag brighter than that presented in
Møller et al. (1998). The low instrument sensitivity at 3560 Å
combined with a variable extinction coefficient at Calar Alto makes
the calibration uncertain.
Extended Ly![]() emission was observed in a region of
3
emission was observed in a region of
3
![]()
![]() 6
6
![]() around the QSO mostly to the east of the
QSO (Fynbo et al. 1999). Long slit spectroscopy along the long axis
revealed velocity structures of 400 km s-1 that could be
interpreted as a rotation curve (Møller 1999). In the IFS data
extended emission is detected to some degree in
Fig. 2, but not with the same detail as in the
higher spatial resolution and larger field of view data in
Fynbo et al. (1999). This is the only case in the sample where extended
emission is found, but the signal is not strong enough to determine
the velocity structure over the extended region. The spectrum shown in
Fig. 2 is the total spectrum co-added from the
whole nebula.
around the QSO mostly to the east of the
QSO (Fynbo et al. 1999). Long slit spectroscopy along the long axis
revealed velocity structures of 400 km s-1 that could be
interpreted as a rotation curve (Møller 1999). In the IFS data
extended emission is detected to some degree in
Fig. 2, but not with the same detail as in the
higher spatial resolution and larger field of view data in
Fynbo et al. (1999). This is the only case in the sample where extended
emission is found, but the signal is not strong enough to determine
the velocity structure over the extended region. The spectrum shown in
Fig. 2 is the total spectrum co-added from the
whole nebula.
Q0953+4749. - This
![]() QSO has three DLAs
at
QSO has three DLAs
at
![]() = 3.407, 3.891, and 4.244 (Bunker et al. 2003). A candidate associated with the lowest redshift DLA is visible in the
narrow-band image in Fig. 2. Independent
subcombinations, the simple extraction, and the corresponding spectra
show a faint emission line. This emission line coincides with a sky
emission line 1.6 Å away and could be due to sky subtraction
errors, so we only assign this candidate a significance class of 2. A Ly
= 3.407, 3.891, and 4.244 (Bunker et al. 2003). A candidate associated with the lowest redshift DLA is visible in the
narrow-band image in Fig. 2. Independent
subcombinations, the simple extraction, and the corresponding spectra
show a faint emission line. This emission line coincides with a sky
emission line 1.6 Å away and could be due to sky subtraction
errors, so we only assign this candidate a significance class of 2. A Ly![]() emission line from the DLA galaxy has been reported (A. Bunker, private comm.) but its line flux is below our detection limit. For the second DLA system at z=3.891 the object is present in
subcombinations, the simple-extracted images, and in the extracted
spectra. This candidate is assigned significance class 3. No candidate
is found for the highest redshift DLA to the detection limit reported
in Table 5.
emission line from the DLA galaxy has been reported (A. Bunker, private comm.) but its line flux is below our detection limit. For the second DLA system at z=3.891 the object is present in
subcombinations, the simple-extracted images, and in the extracted
spectra. This candidate is assigned significance class 3. No candidate
is found for the highest redshift DLA to the detection limit reported
in Table 5.
The locations of the candidates are compared to WFPC2 images obtained from the HST archive, but no continuum counterpart could be identified.
Q1347+112. - This
![]() QSO has a DLA at
QSO has a DLA at
![]() and another possible one at
and another possible one at
![]() ,
which needs confirmation from spectroscopy at
higher spectral resolution. An emission candidate for the z=2.471 DLA is visible in the subcombinations and the extracted one-dimensional spectra. In the simple extraction, the spectrum has a low signal-to-noise ratio and the emission feature in the spectrum is
faint. We assign a significance class of 3 to this candidate. For the
z=2.0568 DLA system we detect a candidate emission line object, but
note an increase in the background noise shortwards of 3750 Å. The
object is not seen in one of the subcombinations, nor the extracted
spectra, and therefore the candidate is assigned a significance class of 1.
,
which needs confirmation from spectroscopy at
higher spectral resolution. An emission candidate for the z=2.471 DLA is visible in the subcombinations and the extracted one-dimensional spectra. In the simple extraction, the spectrum has a low signal-to-noise ratio and the emission feature in the spectrum is
faint. We assign a significance class of 3 to this candidate. For the
z=2.0568 DLA system we detect a candidate emission line object, but
note an increase in the background noise shortwards of 3750 Å. The
object is not seen in one of the subcombinations, nor the extracted
spectra, and therefore the candidate is assigned a significance class of 1.
A snapshot WFPC F555W image (Bahcall et al. 1992) obtained from the HST archive has a 5![]() limiting magnitude of 24.4 mag arcsec-2, but no continuum counterpart can be seen at the location of the
candidate.
limiting magnitude of 24.4 mag arcsec-2, but no continuum counterpart can be seen at the location of the
candidate.
Q1425+606. - This
![]() QSO has a DLA at
QSO has a DLA at
![]() .
Because this QSO is very bright, strong
residuals within 1
.
Because this QSO is very bright, strong
residuals within 1
![]() from the QSO centre are present in the
narrow-band image where the QSO emission is subtracted. A faint object
offset by
from the QSO centre are present in the
narrow-band image where the QSO emission is subtracted. A faint object
offset by ![]() 4
4
![]() to the west is visible in the narrow-band
image in Fig. 2. The candidate is present in
subcombinations and in the constructed spectra and is assigned a significance class of 3. In PMAS data cubes, spaxels in the west
region are more noisy than the average due to an overall lower
transmission. Note that the tests suggest a good candidate, but the
impact parameter (>30 kpc) is large.
to the west is visible in the narrow-band
image in Fig. 2. The candidate is present in
subcombinations and in the constructed spectra and is assigned a significance class of 3. In PMAS data cubes, spaxels in the west
region are more noisy than the average due to an overall lower
transmission. Note that the tests suggest a good candidate, but the
impact parameter (>30 kpc) is large.
Q1451+1223. - This
![]() QSO has two DLAs at
QSO has two DLAs at
![]() and
and
![]() and a sub-DLA at
and a sub-DLA at
![]() .
For the DLA system at z=2.469 an object
appears after the QSO subtraction close to the centre. It is caused
by residuals, since the spectrum has no emission lines at the expected
wavelength. For the same DLA, a region
.
For the DLA system at z=2.469 an object
appears after the QSO subtraction close to the centre. It is caused
by residuals, since the spectrum has no emission lines at the expected
wavelength. For the same DLA, a region ![]() 4
4
![]() to the north west appears in both narrow-band imaging, subcombinations, simple extractions, and the constructed spectra. We therefore assign a significance class of 3 to it, but note that is has a large impact
parameter (39 kpc). For the z=3.171 sub-DLA an object is detected to
the north. Narrow-band images from subcombinations, and simple
extractions show the emission line candidate, but the corresponding
spectra have emission lines with very low signals. The candidate is
assigned a significance class of 3. No candidate is found for the
z=2.254 DLA.
to the north west appears in both narrow-band imaging, subcombinations, simple extractions, and the constructed spectra. We therefore assign a significance class of 3 to it, but note that is has a large impact
parameter (39 kpc). For the z=3.171 sub-DLA an object is detected to
the north. Narrow-band images from subcombinations, and simple
extractions show the emission line candidate, but the corresponding
spectra have emission lines with very low signals. The candidate is
assigned a significance class of 3. No candidate is found for the
z=2.254 DLA.
A deep optical broad-band image of the field surrounding this QSO was
obtained by Steidel et al. (1995), who found no obvious candidates to the
absorbers. Warren et al. (2001) found one candidate offset by 3
![]() 9 to
the south-west of the QSO in a NICMOS image, but this object is
outside the field of view of the IFS data. An HST/STIS archive image
shows that the emission line candidates lie in regions where no
continuum emitting counterpart is found.
9 to
the south-west of the QSO in a NICMOS image, but this object is
outside the field of view of the IFS data. An HST/STIS archive image
shows that the emission line candidates lie in regions where no
continuum emitting counterpart is found.
Q1759+7539. - This
![]() QSO has a DLA at
QSO has a DLA at
![]() and a sub-DLA at
and a sub-DLA at
![]() .
The candidate detected for the DLA system in
Fig. 2 lies near the northern edge of the
field of view and can be affected by flat field errors. Although it is
bright, the candidate is not visible in both subcombinations, and is
therefore assigned a significance class of 2. A bright area 1
.
The candidate detected for the DLA system in
Fig. 2 lies near the northern edge of the
field of view and can be affected by flat field errors. Although it is
bright, the candidate is not visible in both subcombinations, and is
therefore assigned a significance class of 2. A bright area 1
![]() 8 south west of the QSO appears after the QSO emission is subtracted but it is likely due to residuals. It has no emission lines at the expected wavelength and is not considered further. The higher redshift
sub-DLA system has an emission line candidate which is visible only
after the QSO PSF has been subtracted from the final cube. However,
the candidate is only visible in one out of two subcombinations and we
assign this candidate a low significance class of 1.
8 south west of the QSO appears after the QSO emission is subtracted but it is likely due to residuals. It has no emission lines at the expected wavelength and is not considered further. The higher redshift
sub-DLA system has an emission line candidate which is visible only
after the QSO PSF has been subtracted from the final cube. However,
the candidate is only visible in one out of two subcombinations and we
assign this candidate a low significance class of 1.
A NICMOS snapshot image showed no bright galaxies near the QSO to a limit corresponding to an L* galaxy (Colbert & Malkan 2002).
Q1802+5616. - This
![]() QSO has four DLAs at
QSO has four DLAs at
![]() = 3.391, 3.554, 3.762, and 3.811. The candidate
for the lowest redshift DLA system is directly visible in the reduced
and combined data cube when looking at the stacked spectra. The
candidate can also be identified in individual subcombinations and in
the simple extracted spectrum. Therefore this candidate is assigned
the class 4. In a narrow-band image at the wavelength of Ly
= 3.391, 3.554, 3.762, and 3.811. The candidate
for the lowest redshift DLA system is directly visible in the reduced
and combined data cube when looking at the stacked spectra. The
candidate can also be identified in individual subcombinations and in
the simple extracted spectrum. Therefore this candidate is assigned
the class 4. In a narrow-band image at the wavelength of Ly![]() at
z=3.7652 there is an emission region to the south (see
Fig. 2) and the corresponding spectrum shows
an emission feature. However, this line is coincident with a faint
sky emission line, so this candidate is assigned the class 2. No
candidates are found for the other two DLA systems.
at
z=3.7652 there is an emission region to the south (see
Fig. 2) and the corresponding spectrum shows
an emission feature. However, this line is coincident with a faint
sky emission line, so this candidate is assigned the class 2. No
candidates are found for the other two DLA systems.
Q2155+1358. - This
![]() QSO has a DLA at
QSO has a DLA at
![]() and three sub-DLAs at
and three sub-DLAs at
![]() 3.142, 3.565, and 4.212. The observations only
cover Ly
3.142, 3.565, and 4.212. The observations only
cover Ly![]() for the three lower redshift systems. IFS covering the
highest redshift system has revealed a possible faint candidate
emission line object (Francis & McDonnell 2006). The candidate Ly
for the three lower redshift systems. IFS covering the
highest redshift system has revealed a possible faint candidate
emission line object (Francis & McDonnell 2006). The candidate Ly![]() emission
line associated with the DLA system is visible in independent
subcombinations and in the simple extraction and is therefore assigned
a high value of 3. Because of the partial spatial overlap with the
QSO, the emission from the QSO is subtracted to give a cleaned
emission line object and the associated spectrum shown in
Fig. 2. A candidate is found to the south for
the z=3.142 sub-DLA system. This object is visible in the simple
extraction, and subcombinations, but only one associated spectrum
shows a clearly detected emission line. We assign a significance
class of 3 to this candidate. No candidate is found for the z=3.565 sub-DLA.
emission
line associated with the DLA system is visible in independent
subcombinations and in the simple extraction and is therefore assigned
a high value of 3. Because of the partial spatial overlap with the
QSO, the emission from the QSO is subtracted to give a cleaned
emission line object and the associated spectrum shown in
Fig. 2. A candidate is found to the south for
the z=3.142 sub-DLA system. This object is visible in the simple
extraction, and subcombinations, but only one associated spectrum
shows a clearly detected emission line. We assign a significance
class of 3 to this candidate. No candidate is found for the z=3.565 sub-DLA.
Q2233+131. - This
![]() QSO has two sub-DLAs
at
QSO has two sub-DLAs
at
![]() and
and
![]() 2.551. The galaxy
responsible for the z=3.153 DLA was found by Steidel et al. (1995), and
follow-up spectroscopy confirmed this by the detection of
Ly
2.551. The galaxy
responsible for the z=3.153 DLA was found by Steidel et al. (1995), and
follow-up spectroscopy confirmed this by the detection of
Ly![]() emission (Djorgovski et al. 1996). Previous IFS of this object
suggested that the Ly
emission (Djorgovski et al. 1996). Previous IFS of this object
suggested that the Ly![]() emission was extended
(Christensen et al. 2004). This is not confirmed by the higher spectral
resolution data included in this paper, although there appears to be
some faint emission to the east of the object in
Fig. 2. The new data and improved data
reduction which optimises the signal-to-noise ratio, confirm the line
flux Ly
emission was extended
(Christensen et al. 2004). This is not confirmed by the higher spectral
resolution data included in this paper, although there appears to be
some faint emission to the east of the object in
Fig. 2. The new data and improved data
reduction which optimises the signal-to-noise ratio, confirm the line
flux Ly![]() line flux reported in Djorgovski et al. (1996). No candidate
was found for the z=2.551 sub-DLA system, consistent with the upper
limit from a deeper Fabry-Perot imaging analysis (Kulkarni et al. 2006).
line flux reported in Djorgovski et al. (1996). No candidate
was found for the z=2.551 sub-DLA system, consistent with the upper
limit from a deeper Fabry-Perot imaging analysis (Kulkarni et al. 2006).
We proceed with a more detailed analysis of the properties of the
detected candidate Ly![]() emission lines. Only those candidates
assigned values 3 and 4 are included. Of the eight good candidates, we
reject two due to their large impact parameters (>30 kpc). However,
since they fulfill the criteria for good candidates, they could
instead belong to a brighter component in a group. The average
redshift of all the DLAs in the whole sample is
emission lines. Only those candidates
assigned values 3 and 4 are included. Of the eight good candidates, we
reject two due to their large impact parameters (>30 kpc). However,
since they fulfill the criteria for good candidates, they could
instead belong to a brighter component in a group. The average
redshift of all the DLAs in the whole sample is
![]() while that of the six remaining
candidates is
while that of the six remaining
candidates is
![]() ,
hence we find no
preference for detection of either lower or higher redshift
candidates. We emphasise that the candidates emission lines have
fluxes that are detected at the 3
,
hence we find no
preference for detection of either lower or higher redshift
candidates. We emphasise that the candidates emission lines have
fluxes that are detected at the 3![]() level, but with this in mind
we compare their properties with those of confirmed Ly
level, but with this in mind
we compare their properties with those of confirmed Ly![]() emission
lines from DLA galaxies.
emission
lines from DLA galaxies.
Figure 3 shows the inferred line fluxes of the
candidates as a function of redshift. The triangles denote our
candidates and square symbols indicate already confirmed objects from
the literature
(Møller et al. 2004; Djorgovski et al. 1996; Møller et al. 1998; Møller & Warren 1993; Møller et al. 2002; Leibundgut & Robertson 1999). This
figure shows that the line fluxes for the candidates are similar to
those for the previously confirmed ones, which have deeper
observations and detection levels of 5-10![]() .
.
Fabry-Perot imaging studies of QSOs with DLAs have managed to reach
similar or lower flux limits than our IFS survey
(Kulkarni et al. 2006; Lowenthal et al. 1995). With their detection limit some
objects should have been detected if the Ly![]() fluxes of DLA galaxies
are around the level we find for the candidates and the confirmed
objects. IFS is useful to look for emission lines as it allows us to
adjust a posteriori the central wavelength, whereas in Fabry-Perot
images, the emission line could fall at the wings of the filter where
the transmission is lower. Another advantage of IFS observations is
the knowledge of the spatial QSO PSF as a function of wavelength which
allows a modeling and subtraction of the QSO emission
(Wisotzki et al. 2003; Sánchez et al. 2004). This allows detection of emission lines
even when they are superimposed on the QSO. Nevertheless we do not
detect emission line candidates closer than about 1
fluxes of DLA galaxies
are around the level we find for the candidates and the confirmed
objects. IFS is useful to look for emission lines as it allows us to
adjust a posteriori the central wavelength, whereas in Fabry-Perot
images, the emission line could fall at the wings of the filter where
the transmission is lower. Another advantage of IFS observations is
the knowledge of the spatial QSO PSF as a function of wavelength which
allows a modeling and subtraction of the QSO emission
(Wisotzki et al. 2003; Sánchez et al. 2004). This allows detection of emission lines
even when they are superimposed on the QSO. Nevertheless we do not
detect emission line candidates closer than about 1
![]() from the
QSO possibly due to subtraction residuals. The fact that the confirmed
objects are found at smaller impact parameters compared to the
candidates (Sect. 6.3) could indicate a bias.
from the
QSO possibly due to subtraction residuals. The fact that the confirmed
objects are found at smaller impact parameters compared to the
candidates (Sect. 6.3) could indicate a bias.
![\begin{figure}
\par\includegraphics[width=7.7cm,clip]{6410_f3.ps}\end{figure}](/articles/aa/full/2007/23/aa6410-06/img65.gif) |
Figure 3:
Line fluxes of Ly |
| Open with DEXTER | |
An anticorrelation is expected between the Ly![]() luminosity and the
velocity difference between the Ly
luminosity and the
velocity difference between the Ly![]() emission line and optical
emission lines (Weatherley et al. 2005). The resonant nature of
Ly
emission line and optical
emission lines (Weatherley et al. 2005). The resonant nature of
Ly![]() causes a shift of the emission line towards slightly longer
wavelengths where the photons can escape absorption. When a larger
fraction of the blue part of the line profile is absorbed, the
remaining emission line of lower luminosity will be more shifted in
velocity compared to brighter ones. This explanation is supported by
the study of Ly
causes a shift of the emission line towards slightly longer
wavelengths where the photons can escape absorption. When a larger
fraction of the blue part of the line profile is absorbed, the
remaining emission line of lower luminosity will be more shifted in
velocity compared to brighter ones. This explanation is supported by
the study of Ly![]() emission lines from Lyman break galaxies (LBGs)
(Shapley et al. 2003).
emission lines from Lyman break galaxies (LBGs)
(Shapley et al. 2003).
Figure 4 shows the velocity differences between
Ly![]() emission lines and the DLA redshifts for the candidates as a function of the Ly
emission lines and the DLA redshifts for the candidates as a function of the Ly![]() luminosity. There is no evidence for a correlation for the candidates. We note that the only candidate that
shows a negative velocity offset is the best candidate in the sample;
the z=3.391 DLA towards Q1802+5616. For the candidates we find an average velocity difference of 300
luminosity. There is no evidence for a correlation for the candidates. We note that the only candidate that
shows a negative velocity offset is the best candidate in the sample;
the z=3.391 DLA towards Q1802+5616. For the candidates we find an average velocity difference of 300 ![]() 580 km s-1, which is similar to the velocity differences measured for LBGs;
Pettini et al. (2001) find 560
580 km s-1, which is similar to the velocity differences measured for LBGs;
Pettini et al. (2001) find 560 ![]() 410 km s-1 while a larger sample
has
410 km s-1 while a larger sample
has ![]() = 650 km s-1 between the Ly
= 650 km s-1 between the Ly![]() emission line and
low-ionisation absorption lines (Shapley et al. 2003). In the case that
DLAs are associated with bright galaxies we would expect to see large
velocity offsets too. Furthermore, as the line of sight towards the
emission line object and the QSOs differ by 10-30 kpc, a larger
velocity offset can be expected due to differences in kinematics
within the host and its environment. Instead, if the DLA galaxy
resides in a group, the velocity offset will reflect the velocity
dispersion in the group instead of being related to the host. In
support of this idea, it has been shown that bright Lyman break
galaxies at z>2 are surrounded by gas extending to large distances
(Adelberger et al. 2005). Correlation studies have revealed that DLAs cluster on almost the same scale as LBGs (Cooke et al. 2006), indicating
that a similar amount of gas is present in their environments.
emission line and
low-ionisation absorption lines (Shapley et al. 2003). In the case that
DLAs are associated with bright galaxies we would expect to see large
velocity offsets too. Furthermore, as the line of sight towards the
emission line object and the QSOs differ by 10-30 kpc, a larger
velocity offset can be expected due to differences in kinematics
within the host and its environment. Instead, if the DLA galaxy
resides in a group, the velocity offset will reflect the velocity
dispersion in the group instead of being related to the host. In
support of this idea, it has been shown that bright Lyman break
galaxies at z>2 are surrounded by gas extending to large distances
(Adelberger et al. 2005). Correlation studies have revealed that DLAs cluster on almost the same scale as LBGs (Cooke et al. 2006), indicating
that a similar amount of gas is present in their environments.
Like flux-limited surveys, this IFS study selects the brightest emission component, and it is possible that the real absorbing galaxy is a fainter component in a group.
![\begin{figure}
\par\includegraphics[width=7.8cm,clip]{6410_f4.ps}\end{figure}](/articles/aa/full/2007/23/aa6410-06/img67.gif) |
Figure 4:
Velocity differences between the Ly |
| Open with DEXTER | |
In the case that DLA galaxies are related to rotating large disks, it
can be expected that the velocity difference increases with impact
parameter but Fig. 5 shows no clear
correlation. In three of the confirmed DLA galaxies optical emission
lines have velocity differences between -200 and 30 km s-1relative to Ly![]() (Weatherley et al. 2005). Some candidates have larger
offsets, possibly affected more strongly by resonant scattering.
(Weatherley et al. 2005). Some candidates have larger
offsets, possibly affected more strongly by resonant scattering.
![\begin{figure}
\par\includegraphics[width=7.8cm,clip]{6410_f5.ps}\end{figure}](/articles/aa/full/2007/23/aa6410-06/img68.gif) |
Figure 5:
Velocity differences between the Ly |
| Open with DEXTER | |
The average impact parameter of 16 kpc derived for the candidates is larger than that expected by numerical simulations which favor impact parameters of b=3 kpc for DLA galaxies, and have fewer than 25% with b>10 kpc at all redshifts (Okoshi & Nagashima 2005; Hou et al. 2005; Haehnelt et al. 2000). Larger DLA galaxy sizes of 10-15 kpc at 2<z<4 are inferred by other simulations (Gardner et al. 2001). A possibility for the difference between observations and simulations is that the simulations assume a single disk scenario, while DLA galaxies could exist in groups (Hou et al. 2005). The real absorbing galaxy could be fainter and lie closer to the QSO line of sight than the detected candidate galaxy.
An anticorrelation between
![]() and the distance to the nearest
galaxy is found in simulations (Gardner et al. 2001), but no analysis of
this effect for observed DLA galaxies has been attempted. A trend for
larger column density absorbers at smaller impact parameters was
observed in a sample of DLA galaxies at z<1 (Rao et al. 2003). At lower
column densities in the Ly
and the distance to the nearest
galaxy is found in simulations (Gardner et al. 2001), but no analysis of
this effect for observed DLA galaxies has been attempted. A trend for
larger column density absorbers at smaller impact parameters was
observed in a sample of DLA galaxies at z<1 (Rao et al. 2003). At lower
column densities in the Ly![]() forest such an anticorrelation has been
shown to exist (Chen et al. 2001,1998). Observations of the galaxies
giving rise to Mg II absorption lines showed an anticorrelation
between the impact parameters and column densities of both Mg II and H I (Churchill et al. 2000), but recent
observations of a larger sample have indicated that the correlation is
not always present (Churchill et al. 2005).
forest such an anticorrelation has been
shown to exist (Chen et al. 2001,1998). Observations of the galaxies
giving rise to Mg II absorption lines showed an anticorrelation
between the impact parameters and column densities of both Mg II and H I (Churchill et al. 2000), but recent
observations of a larger sample have indicated that the correlation is
not always present (Churchill et al. 2005).
We here investigate whether the candidates show a similar anticorrelation using the impact parameters for the candidates as a proxy for the sizes of neutral gas envelopes around proto galaxies. Assuming such a correlation is necessarily a rough approximation because large morphological differences between individual systems are expected (Rao et al. 2003; Chen & Lanzetta 2003). Specifically, the possible presence of sub-clumps is neglected.
To analyse the sizes of DLA galaxies at z<1, Chen & Lanzetta (2003) describe
the extension of the neutral gas cloud associated with DLA galaxies as
![\begin{figure}
\par\includegraphics[width=7.3cm,clip]{6410_f6.ps}\end{figure}](/articles/aa/full/2007/23/aa6410-06/img70.gif) |
Figure 6:
Angular impact parameter vs. redshift. The solid line
corresponds to the size-luminosity relation for an LB* galaxy
(Chen & Lanzetta 2003), while the dotted and dashed lines correspond to
galaxies with B band luminosities
|
| Open with DEXTER | |
Using similar arguments as above one could expect that there is a relation between the impact parameter b, and the column density measured for the DLA. Figure 7 shows the
![]() measured for the DLA as a function of the impact parameters in kpc. We assume a similar scaling relation as in Eq. (1) for the impact parameter and
measured for the DLA as a function of the impact parameters in kpc. We assume a similar scaling relation as in Eq. (1) for the impact parameter and
![]() ,
i.e.
,
i.e.
![\begin{figure}
\par\includegraphics[width=7.6cm,clip]{6410_f7.ps}\end{figure}](/articles/aa/full/2007/23/aa6410-06/img74.gif) |
Figure 7:
Column density of neutral hydrogen as a function of impact
parameters for the candidates and previously confirmed objects. The
symbols are similar to the previous figures. The solid and dashed
lines are fits to the power-law relation
|
| Open with DEXTER | |
Radio observations of the 21 cm emission from H I disks in the
local Universe have shown that an exponential profile is a poor
representation in the central part of disk galaxies, where the 21 cm
flux density either stays constant or decreases towards the centre
(e.g. Verheijen & Sancisi 2001). However, at optical wavelengths disk
galaxies are well represented by exponential profiles. Here we fit the
impact parameter distribution by the relation
| (3) |
![\begin{figure}
\par\includegraphics[width=7.6cm,clip]{6410_f8.ps}\end{figure}](/articles/aa/full/2007/23/aa6410-06/img80.gif) |
Figure 8:
Column density of neutral hydrogen as a function of impact
parameter for the candidates and previously confirmed objects. The
solid and dashed lines show the fit to the exponential relation
|
| Open with DEXTER | |
Local disk galaxies have optical scale lengths ranging from ![]() 2 kpc to
2 kpc to ![]() 6 kpc, and observations of the H I profile in low surface brightness galaxies have indicated scale lengths >10 kpc (Matthews et al. 2001). In contrast, higher redshift spiral galaxies in
the HST Ultra Deep field have smaller optical scale lengths of
1.5-3 kpc (Elmegreen et al. 2005), possibly biased towards smaller values
due to the easier detection of high surface brightness, high star
formation rate regions. The question is how extended the gaseous
envelopes are around these young galaxies. The impact parameters of
the candidates suggest that high redshift DLAs reside far from the
host galaxy, if not in a regular proto-galactic disk (Wolfe et al. 1986),
then in a region of the same physical scale, possibly in merging
clumps of gas surrounding the actual proto galaxy. In this picture,
DLAs can be found far from the center of the parent galaxy.
6 kpc, and observations of the H I profile in low surface brightness galaxies have indicated scale lengths >10 kpc (Matthews et al. 2001). In contrast, higher redshift spiral galaxies in
the HST Ultra Deep field have smaller optical scale lengths of
1.5-3 kpc (Elmegreen et al. 2005), possibly biased towards smaller values
due to the easier detection of high surface brightness, high star
formation rate regions. The question is how extended the gaseous
envelopes are around these young galaxies. The impact parameters of
the candidates suggest that high redshift DLAs reside far from the
host galaxy, if not in a regular proto-galactic disk (Wolfe et al. 1986),
then in a region of the same physical scale, possibly in merging
clumps of gas surrounding the actual proto galaxy. In this picture,
DLAs can be found far from the center of the parent galaxy.
The two objects that were originally discarded as candidates due to their large impact parameters (>30 kpc) do not follow the relations for either the exponential or power-law profiles. Including them would make the scatter around the fit substantial.
Using a space based imaging survey and follow up long-slit
spectroscopic observations, Møller et al. (2004) found indications for a positive metallicity-Ly![]() luminosity relation, such that
Ly
luminosity relation, such that
Ly![]() emission was preferentially observed in higher metallicity
systems. They argued that this positive correlation could over-power
the negative dust-Ly
emission was preferentially observed in higher metallicity
systems. They argued that this positive correlation could over-power
the negative dust-Ly![]() luminosity effects which are expected to be
strong in high metallicity environments (Charlot & Fall 1993). Studies of
Ly
luminosity effects which are expected to be
strong in high metallicity environments (Charlot & Fall 1993). Studies of
Ly![]() emission from nearby star-forming galaxies have not revealed any
correlations between metallicity and Ly
emission from nearby star-forming galaxies have not revealed any
correlations between metallicity and Ly![]() emission strength
(Keel 2005). Differences in the velocity-metallicity relation
between high and low redshift DLAs could be explained by higher
redshift DLAs residing in lower mass galaxies (Ledoux et al. 2006), that
have fainter Ly
emission strength
(Keel 2005). Differences in the velocity-metallicity relation
between high and low redshift DLAs could be explained by higher
redshift DLAs residing in lower mass galaxies (Ledoux et al. 2006), that
have fainter Ly![]() emission.
emission.
In this context we investigate the distribution of metallicities for
the emission line candidates in comparison to the total sample. We
compare the cumulative distributions of metallicities ([Si/H]) for the
DLAs that have candidate Ly![]() detections with the metallicities of
the remaining objects that have either no Ly
detections with the metallicities of
the remaining objects that have either no Ly![]() candidates or rejected
candidates. The distributions in Fig. 9 show
the fraction of DLAs with metallicities larger than a given value.
Table 1 has several lower limits on [Si/H] and
Fig. 9 treats the limits as actual detections.
candidates or rejected
candidates. The distributions in Fig. 9 show
the fraction of DLAs with metallicities larger than a given value.
Table 1 has several lower limits on [Si/H] and
Fig. 9 treats the limits as actual detections.
![\begin{figure}
\par\includegraphics[width=7.3cm,clip]{6410_f9.ps}\end{figure}](/articles/aa/full/2007/23/aa6410-06/img81.gif) |
Figure 9: Cumulative distribution of Si metallicities of the six good emission line candidates compared to the remaining part of the sample. The probability that the two distributions are similar is 38% estimated from a Kolmogorov-Smirnov test. |
| Open with DEXTER | |
A two sided Kolmogorov Smirnov (KS) test gives a probability of 38% that the two samples have the same underlying distributions. A similar analysis for [Fe/H] gives the same result. Hence, none of the tests give clear statistical evidence for a difference between the two populations. Only a small number of DLAs are included in this survey. For the two samples with N1 and N2 being the number of objects in each sample respectively we find N1N2/(N1+N2) =4. For the KS test to be statistically valid a value larger than 4 is required (Press et al. 1992), hence a few more objects are needed to make the test more statistically significant.
In local galaxies the metallicities of H II regions are shown
to decrease with increasing radial distance in the disk
(Zaritsky et al. 1994). If DLAs arise in disks lower metallicities are
expected at larger linear separations between the QSO line of sight
and the galaxy centers. A comparison of absorption metallicities for 3 DLAs at z<0.6 with abundances derived from strong emission line
diagnostics from the galaxy spectra revealed that gradients are likely
present at at level -0.041 ![]() 0.012 dex kpc-1 (Chen et al. 2005).
Uncertainties in the gradients arise due to an unknown correction for
dust depletion and also the inclination of the galaxy plays an important role due to projection effects. Metallicity differences due
to differential depletion within a singe DLA galaxy can be strong as
demonstrated by observations of a lensed QSO (Lopez et al. 2005).
0.012 dex kpc-1 (Chen et al. 2005).
Uncertainties in the gradients arise due to an unknown correction for
dust depletion and also the inclination of the galaxy plays an important role due to projection effects. Metallicity differences due
to differential depletion within a singe DLA galaxy can be strong as
demonstrated by observations of a lensed QSO (Lopez et al. 2005).
![\begin{figure}
\par\includegraphics[width=7.55cm,clip]{6410_f10.ps}\end{figure}](/articles/aa/full/2007/23/aa6410-06/img82.gif) |
Figure 10:
DLA metallicities as a function of the impact parameters,
where symbols shapes have similar meanings as in the previous
figures. The dotted line shows a fit to all the objects excluding
the limits. This line has a gradient of
-0.024 |
| Open with DEXTER | |
Observations of nebular emission lines from seven galaxies at 2.0<z<2.5 indicate an average solar metallicity (Shapley et al. 2004), with evidence for the presence of metallicity gradients (Förster Schreiber et al. 2006). If metallicity gradients exist for high redshift DLA galaxies, we would expect to see a tendency for higher metallicities for the DLA galaxies detected at smaller impact parameters. DLA galaxies are on the average fainter than LBGs detected in flux limited surveys (Møller et al. 2002). Combining this with a high redshift luminosity-metallicity relation can imply low DLA metallicities without involving metallicity gradients.
Figure 10 shows the DLA metallicities as a function of the impact parameters. The line shows a fit to all objects ignoring those with lower limits on [Si/H]. This gradient is
-0.024 ![]() 0.015, i.e. is consistent with zero at the 2
0.015, i.e. is consistent with zero at the 2![]() level. The large scatter in the plot could be real and unrelated to
gradients. Different DLAs exhibit a large range of star formation
histories (Erni et al. 2006; Herbert-Fort et al. 2006), which makes it unreasonable
to expect a smooth relation between metallicities and impact
parameters for a sample of DLAs. Clearly more data are needed to
determine the reality of any relation.
level. The large scatter in the plot could be real and unrelated to
gradients. Different DLAs exhibit a large range of star formation
histories (Erni et al. 2006; Herbert-Fort et al. 2006), which makes it unreasonable
to expect a smooth relation between metallicities and impact
parameters for a sample of DLAs. Clearly more data are needed to
determine the reality of any relation.
We have presented an integral field spectroscopic survey of 9 high
redshift QSOs, which have a total of 14 DLA systems and 8 sub-DLA systems. We detect eight good candidates for Ly![]() emission lines from DLA and sub-DLA galaxies. Two of these are found at impact
parameters larger than 30 kpc, and are not likely associated directly
with the absorbing galaxy, but could be associated with galaxy groups
in which the real absorbing galaxy resides. All candidates are
detected at a statistically significant level in reconstructed
narrow-band images as well as in the co-added one-dimensional spectra.
Further observations will be useful to independently confirm the
candidates at an even higher signal to noise ratio. We compare the
properties inferred from the IFS data with those for previously
spectroscopically confirmed Ly
emission lines from DLA and sub-DLA galaxies. Two of these are found at impact
parameters larger than 30 kpc, and are not likely associated directly
with the absorbing galaxy, but could be associated with galaxy groups
in which the real absorbing galaxy resides. All candidates are
detected at a statistically significant level in reconstructed
narrow-band images as well as in the co-added one-dimensional spectra.
Further observations will be useful to independently confirm the
candidates at an even higher signal to noise ratio. We compare the
properties inferred from the IFS data with those for previously
spectroscopically confirmed Ly![]() emission lines from DLA galaxies
reported in the literature. We find that line luminosities are
similar to those of previously confirmed objects, that the average
impact parameters are larger by a factor of
emission lines from DLA galaxies
reported in the literature. We find that line luminosities are
similar to those of previously confirmed objects, that the average
impact parameters are larger by a factor of ![]() 2, and that some
candidates have larger velocity offsets between the Ly
2, and that some
candidates have larger velocity offsets between the Ly![]() emission
line and the systemic redshift of the DLA system.
emission
line and the systemic redshift of the DLA system.
We analyse the distribution of DLA column densities as a function of impact parameters. Assuming that the average DLA galaxy is similar to a disk galaxy with an exponential profile, we show that it has a scale length of 5 kpc. Such a scale length is similar to disk scale lengths found for local spiral galaxies. This could imply that DLAs belong to large disks even at high redshifts as originally suggested by Wolfe et al. (1986). However, it is probably too simplistic to expect that high redshift DLAs reside in regular disks with similar structure to large local disks. DLA systems are generally not associated with luminous galaxies (e.g. Colbert & Malkan 2002; Møller et al. 2002). The large impact parameters found for the candidates indicate that the distribution of H I clouds in DLA galaxies extends significantly beyond the optical sizes of fainter dwarf galaxies.
Furthermore, Wolfe & Chen (2006) showed that high redshift DLAs do not
reside in extended disks that follow the local Schmidt-Kennicutt law
for star formation. The IFS results presented here suggest that the
Ly![]() emission is generally not extended, and that star formation
takes place at a distance of several kpc from the DLA. Hence, we may
speculate that DLAs arise in the outskirts of proto-galaxies, for
example in clouds of neutral gas around LBGs. In this case one would
expect a significant scatter in the relation between the impact
parameter and column density of the DLA since neutral clouds could be
distributed irregularly around the galaxy. Contrary to expectations,
the objects show a small scatter around the relations in
Figs. 7 and 8.
Regardless of the distribution of neutral gas in DLA galaxies we
conclude that there is a tendency to find a lower column density DLA
with increasing impact parameter. Extending the investigation to
include DLAs and sub-DLAs with
emission is generally not extended, and that star formation
takes place at a distance of several kpc from the DLA. Hence, we may
speculate that DLAs arise in the outskirts of proto-galaxies, for
example in clouds of neutral gas around LBGs. In this case one would
expect a significant scatter in the relation between the impact
parameter and column density of the DLA since neutral clouds could be
distributed irregularly around the galaxy. Contrary to expectations,
the objects show a small scatter around the relations in
Figs. 7 and 8.
Regardless of the distribution of neutral gas in DLA galaxies we
conclude that there is a tendency to find a lower column density DLA
with increasing impact parameter. Extending the investigation to
include DLAs and sub-DLAs with
![]() > 1019.6 cm-2 this
tendency emerges for both the candidates and the confirmed objects.
> 1019.6 cm-2 this
tendency emerges for both the candidates and the confirmed objects.
The velocity offsets between the Ly![]() emission lines and the systemic
redshifts of the DLAs are larger for half of the candidates compared
to the confirmed objects. This could indicate an origin in groups of
galaxies, where the DLA resides in a less luminous component than the
galaxy detected in Ly
emission lines and the systemic
redshifts of the DLAs are larger for half of the candidates compared
to the confirmed objects. This could indicate an origin in groups of
galaxies, where the DLA resides in a less luminous component than the
galaxy detected in Ly![]() .
To determine whether resonant scattering
affects the candidate Ly
.
To determine whether resonant scattering
affects the candidate Ly![]() lines more strongly and gives rise to
larger velocity offsets than for the confirmed objects, observations
of the corresponding optical emission lines which are shifted to the
near-IR are required (e.g. Weatherley et al. 2005). Optical emission
lines furthermore have the advantage of being less affected by dust
absorption and therefore are better for estimating the star-formation
rates. Alternatively non-resonance UV lines such as C IV could
be studied.
lines more strongly and gives rise to
larger velocity offsets than for the confirmed objects, observations
of the corresponding optical emission lines which are shifted to the
near-IR are required (e.g. Weatherley et al. 2005). Optical emission
lines furthermore have the advantage of being less affected by dust
absorption and therefore are better for estimating the star-formation
rates. Alternatively non-resonance UV lines such as C IV could
be studied.
This survey was carried out with IFS on a 4-m class telescope, and the signals were generally near the detection limit. To verify this IFS method, it is necessary to get independent, higher signal-to-noise ratio spectra with a larger aperture telescope to confirm the existence of the emission lines.
Acknowledgements
This study was supported by the German Verbundforschung associated with the ULTROS project, grant No. 05AE2BAA/4. S.F. Sánchez acknowledges the support from the Euro3D Research Training Network, grant No. HPRN-CT2002-00305. K. Jahnke acknowledges support from DLR project No. 50 OR 0404. We thank the referee for useful suggestions that clarified the paper.
![\begin{figure}
\par\includegraphics[height=19.9cm,width=12.5cm,clip]{6410f2.2.ps}
\end{figure}](/articles/aa/full/2007/23/aa6410-06/img83.gif) |
Figure 2: continued. |
| Open with DEXTER | |
![\begin{figure}
\par\includegraphics[height=19.9cm,width=12.5cm,clip]{6410f2.3.ps}
\end{figure}](/articles/aa/full/2007/23/aa6410-06/img84.gif) |
Figure 2: continued. |
| Open with DEXTER | |
![\begin{figure}
\par\includegraphics[height=19.9cm,width=12.5cm,clip]{6410f2.4.ps}
\end{figure}](/articles/aa/full/2007/23/aa6410-06/img85.gif) |
Figure 2: continued. |
| Open with DEXTER | |
| |
Figure 2: continued. |
| Open with DEXTER | |