![\begin{figure}
\includegraphics[width=8.5cm,bb=20 100 850 850,clip=yes]{6788fig1.ps}\end{figure}](/articles/aa/full/2007/21/aa6788-06/Timg36.gif) |
Figure 1: Map of the mosaic of 16 SHALLOW fields observed in Fornax dSph, plotted on a DSS2-red image. The location of the DEEP field is shown as a grey box. |
| Open with DEXTER | |
In the text
 |
Figure 2:
Residuals in the (
|
| Open with DEXTER | |
In the text
 |
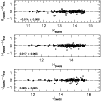
Figure 3: Comparison of the DEEP and SHALLOW photometry of Fornax. |
| Open with DEXTER | |
In the text
 |
Figure 4:
Comparison of SHALLOW
catalog with 2MASS photometry. Filled circles are data that
passed a |
| Open with DEXTER | |
In the text
 |
Figure 5: Completeness and photometric errors from artificial star experiments for the SHALLOW photometry. Upper panel: completeness calculated as the number of artificial stars recovered as a function of observed magnitude. Lower panel: photometric errors, i.e. the standard deviation of the differences between input and output magnitudes. |
| Open with DEXTER | |
In the text
 |
Figure 6: The results of artificial star experiments for the DEEP photometry. |
| Open with DEXTER | |
In the text
![\begin{figure}
\par\includegraphics[width=8.cm]{6788fig7a.ps}\includegraphics[wi...
...[width=8.cm]{6788fig7c.ps}\includegraphics[width=8.cm]{6788fig7d.ps}\end{figure}](/articles/aa/full/2007/21/aa6788-06/Timg61.gif) |
Figure 7: The color-magnitude diagrams of Fornax from the SHALLOW catalog, obtained by combining optical and near-infrared photometry. Stars on the extended AGB, chosen redder than (J-K) = 1 and brighter than K = 14.5, are shown as filled circles. Superimposed on the K, (J-K) diagram are theoretical isochrones from Girardi et al. (2002, G02, dashed lines) and Pietrinferni et al. (2004, P04, solid lines). The isochrone age is 7 Gyr and the metal abundances are the closest to the metallicity of Fornax for each model set: Z=0.001 and 0.004 for G02, Z=0.001 and 0.002 for P04. Typical photometric errors as derived from artificial star experiments are also shown as crosses in the upper-left panel. |
| Open with DEXTER | |
In the text
 |
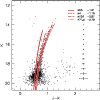
Figure 8: The near-infrared CMD of Fornax derived from our DEEP photometry, showing the RGB and the prominent "red clump'' of intermediate-age He-burning stars. Superposed on the RGB are the fiducial lines of Galactic globular clusters from Valenti et al. (2004a), with metallicities on the scale of Carretta & Gratton (1997). Typical photometric errors as derived from artificial star experiments are shown as crosses. |
| Open with DEXTER | |
In the text
 |
Figure 9: The K-band luminosity function of evolved stars in Fornax, corrected for completeness effects. This LF, derived from the DEEP catalog, shows the location of the red clump and the AGB bump. The inset illustrates our sample selection. A histogram with a 0.1 mag bin is shown as a dotted line, while the solid line represents a multibin histogram. |
| Open with DEXTER | |
In the text
 |
Figure 10: The luminosity function of the upper RGB, from the SHALLOW catalog. The inset shows how RGB stars have been selected. The RGB cutoff was measured by fitting an error-convolved step function ( green long-dashed line) to a multibin histogram ( continuous line). The dotted line shows an example of a simple LF with 0.1 mag bins. |
| Open with DEXTER | |
In the text
 |
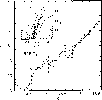
Figure 11: Derivation of a photometric Metallicity Distribution Function of RGB stars in Fornax using (V-K) colors. Upper panel: the photometric metallicity distribution function of red giants in Fornax. The solid line is a fit of the sum of two Gaussian functions ( dashed lines) to the data. The method is illustrated in the lower panel: the stars on the upper RGB of Fornax are interpolated across analytical fits ( dotted lines) to the RGB fiducial lines of template Galactic globular clusters. The yellow line marks the best-fit mean metallicity. |
| Open with DEXTER | |
In the text
 |
Figure 12: Contours of constant (V-K) color at MK=-5.0 as a function of age and [M/H] ( dotted lines), using the model isochrones of Pietrinferni et al. (2004). This plot allows a quantification of the age-metallicity degeneracy in the metallicity estimates based on optical-infrared colors. The red solid line corresponds to the color of the RGB of Fornax. An arrow shows the change in metallicity at this fixed color between 12.5 Gyr old globular clusters and a 7.5 Gyr old galaxy (representative of Fornax dSph). |
| Open with DEXTER | |
In the text
 |
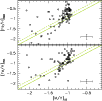
Figure 13:
Comparison of metallicities of
individual stars inferred from near-infrared colors and metal abundances
derived from the strengths of Ca II triplet lines. Lower panel:
spectroscopic data from Pont et al. (2004); upper panel: data from
Battaglia et al. (2006). The solid line indicates one-to-one
correlation, while a dashed line shows the shift expected by
taking into account the mean age of stellar populations in Fornax.
Error crosses represent the mean uncertainties of spectroscopic measures,
and the |
| Open with DEXTER | |
In the text
 |
Figure 14: Comparison of the metallicity distribution inferred from the optical-infrared colors of RGB stars (this paper, upper panel) and the MDF obtained from Ca II triplet spectroscopy (Battaglia et al. 2006; Pont et al. 2004, lower panel). The shaded part of the histogram from Pont et al. (2004) ([Fe/H] > -0.8) contains extrapolated metallicities. A mean age correction, resulting in a shift of 0.15 dex, has been applied to our histogram. |
| Open with DEXTER | |
In the text