A&A 467, 541-558 (2007)
DOI: 10.1051/0004-6361:20066152
R. O. Amorín1 - C. Muñoz-Tuñón1 - J. A. L. Aguerri1 - L. M. Cairós2 - N. Caon1
1 - Instituto de Astrofísica de Canarias (IAC),
Vía Láctea, 38200 La Laguna, Tenerife, Spain
2 -
Astrophysikalisches Institut Potsdam, An der Sternwarte 16,
14482 Potsdam, Germany
Received 31 July 2006 / Accepted 12 February 2007
Abstract
Context. The structural properties of the low surface brightness stellar host in blue compact dwarf galaxies are often studied by fitting r1/n models to the outer regions of their radial profiles. The limitations imposed by the presence of a large starburst emission overlapping the underlying component makes this kind of analysis a difficult task.
Aims. We propose a two-dimensional fitting methodology in order to improve the extraction of the structural parameters of the LSB host. We discuss its advantages and weaknesses by using a set of simulated galaxies and compare the results for a sample of eight objects with those already obtained using a one-dimensional technique.
Methods. We fit a PSF convolved Sérsic model to synthetic galaxies, and to real galaxy images in the B, V, R filters. We restrict the fit to the stellar host by masking out the starburst region and take special care to minimize the sky-subtraction uncertainties. In order to test the robustness and flexibility of the method, we carry out a set of fits with synthetic galaxies. Furthermore consistency checks are performed to assess the reliability and accuracy of the derived structural parameters.
Results. The more accurate isolation of the starburst emission is the most important advantage and strength of the method. Thus, we fit the host galaxy in a range of surface brightness and in a portion of area larger than in previous published 1D fits with the same dataset. We obtain robust fits for all the sample galaxies, all of which, except one, show Sérsic indices n very close to 1, with good agreement in the three bands. These findings suggest that the stellar hosts in BCDs have near-exponential profiles, a result that will help us to understand the mechanisms that form and shape BCD galaxies, and how they relate to the other dwarf galaxy classes.
Key words: galaxies: dwarf - galaxies: evolution - galaxies: photometry - galaxies: starburst - galaxies: structure
Blue compact dwarf (BCD) galaxies have been recognized for some time
as playing an important role in our understanding of star formation (SF)
processes, and their study provides relevant information for our knowledge of
the evolution of galaxies.
BCDs are gas-rich (H I mass fraction typically higher than 30%) and
metal-deficient (
![]() )
extragalactic
systems, which display very intense and narrow emission lines in the optical
(similar to those seen in H II regions), due to the intense
SF activity distributed in one to several star-forming bursts
(Cairós et al. 2001b, hereafter C01b).
Stars are formed at high rates (0.1-1
)
extragalactic
systems, which display very intense and narrow emission lines in the optical
(similar to those seen in H II regions), due to the intense
SF activity distributed in one to several star-forming bursts
(Cairós et al. 2001b, hereafter C01b).
Stars are formed at high rates (0.1-1
![]() ,
Fanelli et al. 1988), exhausting their gas content in much shorter times
than the age of the Universe. The mechanisms triggering the cloud collapse in
these low mass systems is still unknown since, unlike in normal spirals,
density waves are inhibited. Moreover, their characteristics are believed
to have been common among unevolved low-mass galaxies at high to intermediate
redshift.
Local BCDs are therefore the most suitable nearby laboratories for studying
the spectrophotometric and chemodynamic properties of
distant and faint galaxies counterparts at high spatial resolution.
,
Fanelli et al. 1988), exhausting their gas content in much shorter times
than the age of the Universe. The mechanisms triggering the cloud collapse in
these low mass systems is still unknown since, unlike in normal spirals,
density waves are inhibited. Moreover, their characteristics are believed
to have been common among unevolved low-mass galaxies at high to intermediate
redshift.
Local BCDs are therefore the most suitable nearby laboratories for studying
the spectrophotometric and chemodynamic properties of
distant and faint galaxies counterparts at high spatial resolution.
The nature and genesis of BCDs have been studied and are now better understood. The idea of BCDs being genuinely young galaxies forming stars for the very first time (Sargent & Searle 1970; Kunth et al. 1988) is now discarded, at least for the vast majority of them. Deep photometric studies in the optical (Loose & Thuan 1986; Telles 1995; Papaderos et al. 1996b; Doublier et al. 1997, 1999; Cairós 2000; Cairós et al. 2001a, hereafter C01a; C01b; Bergvall & Östlin 2002) and in the near-infrared (Noeske et al. 2005, and references therein) have in fact revealed that virtually all BCDs present a low-surface brightness (LSB) stellar host. This stellar component, underlying the SF regions, is an extended envelope that generally shows elliptical isophotes, displays red colours, indicative of an evolved stellar population (Papaderos et al. 1996b; C01a; CO1b; Cairós et al. 2002; Cairós et al. 2003; Bergvall & Östlin 2002), and is therefore a "witness'' of former events of star formation.
LSB hosts are typically found to dominate the intensity and colour
distribution of BCDs for
![]() mag/arcsec-2
(Papaderos et al. 1996b; C01b). This evolved stellar population is observed in
all types of BCDs, except for the extremely rare i0 type (from the
classification scheme of Loose & Thuan 1986).
mag/arcsec-2
(Papaderos et al. 1996b; C01b). This evolved stellar population is observed in
all types of BCDs, except for the extremely rare i0 type (from the
classification scheme of Loose & Thuan 1986).
In order to establish the luminosities, structures and evolutionary status, as well as the star-forming history of BCD galaxies, it is indispensable to characterize the LSB component underlying the starburst regions. The first step in this process is to derive the LSB host ages and chemical abundances. Also, a comprehensive spectrophotometric study of the starburst in BCDs needs a precise determination of the structural properties of the LSB stellar host in order to remove its contribution. Moreover, the structural, kinematic and dynamical properties of the host galaxy in BCDs are important issues in dwarf galaxy research, as they help to understand such processes as the regulation of the SF activity, and the possible evolutionary connections between different dwarf galaxy types.
Vaduvescu et al. (2006) show, from NIR surface photometry, that the starburst is usually a small fraction of the total mass. Furthermore, provided that dark matter does not dominate the mass within the Holmberg radius (Papaderos et al. 1996b), the LSB component is, together with the H I halo, mainly responsible for the global gravitational potential within which the starburst phenomenon takes place. Thus, the analysis of the projected luminosity distribution is fundamental for modelling the gravitational potential and the dynamics of BCDs, as well as the effects of starburst events in their interstellar medium, such as galactic winds. Whether the processed stellar material will be released, causing the contamination of the intergalactic medium, depends strongly on the galaxy structure (Tenorio-Tagle et al. 2003), being easier in disc-like objects than in spheroids (Silich & Tenorio-Tagle 2001, see their Fig. 3).
The comparison of the properties of the LSB stellar component (e.g. structural parameters, average colours, and colour gradients) with those of other dwarf galaxy classes (dwarf irregulars, dIs; dwarf elliptical, dEs), and low-surface brightness galaxies is crucial for testing those evolutionary scenarios that link these galaxies with BCDs (Thuan 1985; Davies & Phillipps 1988; Papaderos et al. 1996a; Marlowe et al. 1997, 1999; Cairós 2000).
The faint surface brightness of the LSB component and the contamination caused by the starburst emission make the derivation of the structural parameters of the underlying host in BCDs a complicated task. Thus, the derived structural parameters strongly depend on how well the starburst has been excluded from the fit, on the extent of the fitted LSB radial profile, on the quality of the dataset, and on the method and model used to parameterize the surface brightness profile.
Some previous studies, in which one-dimensional models of the BCDs LSB component were fitted, have shown discrepant results even for the same galaxies, especially when a Sérsic law was applied (see examples in Cairós et al. 2003 and Caon et al. 2005). Moreover, during the extraction of a radial profile one can find serious limitations and ambiguities. Each of the different procedures has its own drawbacks, resulting in information loss from the image (Baggett et al. 1998).
At the present time, several well-tested two-dimensional algorithms
are available. There are also several examples in the literature of studies showing
that the two-dimensional method is generally more reliable than one-dimensional
methods in bulge-disc decompositions (de Jong 1996), as it is able
to retrieve more accurate structural parameters.
Particularly in BCDs, a two-dimensional fit to the image, by using a ![]() minimization technique, may provide significant advantages over the fit to
some averaged one-dimensional profile.
minimization technique, may provide significant advantages over the fit to
some averaged one-dimensional profile.
In Caon et al. 2005 (hereafter Paper I) we presented a very detailed one-dimensional Sérsic fitting of a sample of eight BCDs, showing that by carefully selecting the fitted radial range and by performing consistency checks on the fits we can derive reliable structural parameters. We also analysed in detail the problems and uncertainties involved in the fitting of a 1D Sérsic model.
As a natural continuation of the work in Paper I, here we explore the LSB stellar host structural characterization by carrying out a two-dimensional fitting technique to the same galaxies. We propose a consistent methodology, explain its advantages and discuss its possible drawbacks and limitations.
One of the crucial issues to be investigated is whether or not there is an evolutionary link among the different classes of the dwarf galaxies population. Although detailed studies of individual objects are important and can provide tests, examples, or counterexamples, which are undoubtfully useful, statistical studies are the key for extending or establishing general paths. To do so, "semiautomatic'' procedures able to analyse a large data base are necessary. In particular, to classify the LSB host into structures with low or high n Sérsic index with well-controlled uncertanties would be an important first step.
In Sect. 2 we present the sample of galaxies; in Sect. 3 we describe the two-dimensional fitting methodology. Simulations with synthetic galaxies are described in Sect. 4. In Sect. 5 we discuss the observational uncertainties involving the fitting of a Sérsic model to the BCDs host galaxy. Section 6 presents the results of the 2D fitting to the sample of galaxies. Summary and conclusions are the subject of Sect. 7.
We have selected the same objects already analysed in Paper I. Such galaxies are those with the deepest images, located in areas of the sky free from nearby bright stars, and with few overlapping background or foreground objects. The basic data on the galaxies are presented in Table 1.
Table 1: The galaxy sample.
It is clear that many BCDs present light profiles with significant deviations from a pure exponential (Cairós et al. 2003; Paper I). Following our previous works (Cairós 2000; C01a; Cairós et al. 2003; Paper I) we have adopted the Sérsic law (Sérsic 1968) to fit our data. This paper does not concern itself with which mathematical function best suits the surface brightness profiles of most BCDs host galaxies. The applicability of the Sérsic profile and the drawbacks associated with it were the subject of Paper I. This profile has been shown to describe the light distribution in ellipticals (from dwarfs to brightest cluster members, Caon et al. 1993; Young & Currie 1994; Graham et al. 1996; Graham & Guzmán 2003; Aguerri et al. 2005) and spiral bulges (Prieto et al. 2001).
Here, for the first time, a new methodology for fitting BCD hosts by using a
two-dimensional technique is developed.
We used the publicly available software called GALFIT v2.0.3b
(Peng et al. 2002, hereafter P02). Detailed information on GALFIT and
how it is implemented can be found in P02, and
on-line![]() .
GALFIT has been used in recent years in several works where modelling of the
light distribution of galaxies was required, e.g. in disc galaxies
(Barden et al. 2005), field spheroidal and bulge-dominated galaxies
(Treu et al. 2005), active galaxies (Sánchez et al. 2004;
Dong & De Robertis 2006) and luminous blue compact galaxies (Noeske et al. 2006),
among others.
However, it has not yet been applied to blue compact and irregular dwarfs.
We give here a brief introduction on how GALFIT works and describe
the methodology we implemented and applied to fit our galaxies.
.
GALFIT has been used in recent years in several works where modelling of the
light distribution of galaxies was required, e.g. in disc galaxies
(Barden et al. 2005), field spheroidal and bulge-dominated galaxies
(Treu et al. 2005), active galaxies (Sánchez et al. 2004;
Dong & De Robertis 2006) and luminous blue compact galaxies (Noeske et al. 2006),
among others.
However, it has not yet been applied to blue compact and irregular dwarfs.
We give here a brief introduction on how GALFIT works and describe
the methodology we implemented and applied to fit our galaxies.
GALFIT was designed to extract structural components from galaxy images,
as it is capable of fitting a galaxy with an arbitrary number of
components simultaneously, whose geometry is described by axially symmetric generalized
ellipses (see Athanassoula et al. 1990), and whose profile
can be one of several analytic functions such as Sérsic, Gaussian,
exponential, or a constant or tilted background.
The program has the option of convolving the models with the point-spread
function (PSF) to simulate the seeing.
GALFIT minimizes the
![]() (normalized
(normalized ![]() ,
see P02) residuals using a
downhill gradient/parabolic expansion method, called Levernberg-Marquardt
(Press et al. 1997), by iteratively creating model images, convolving them with the PSF and
subtracting them from the data. Also, GALFIT is able to use the readout noise
and gain parameters of the image to build a Poissonian noise model in
order to weigh the pixels used in the fit.
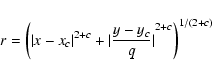
In our case, we fitted a single Sérsic model:
,
see P02) residuals using a
downhill gradient/parabolic expansion method, called Levernberg-Marquardt
(Press et al. 1997), by iteratively creating model images, convolving them with the PSF and
subtracting them from the data. Also, GALFIT is able to use the readout noise
and gain parameters of the image to build a Poissonian noise model in
order to weigh the pixels used in the fit.
In our case, we fitted a single Sérsic model:
![\begin{displaymath}I(r) = I_{\rm e} {\rm e}^{-b_{n}[(r/r_{\rm e})^{1/n} - 1]},
\end{displaymath}](/articles/aa/full/2007/20/aa6152-06/img22.gif) |
(1) |
 |
(2) |
The flux, integrated over all radii for an elliptical Sérsic profile with
an axis ratio q, is given (following the notation by P02) by:
 |
(3) |
 |
(4) |
In total, we have 8 free parameters:
xc, yc,
![]() ,
,
![]() ,
n, q, PA, and c. Note
that the same number of parameters must be determined
in a one-dimensional Sérsic fit.
,
n, q, PA, and c. Note
that the same number of parameters must be determined
in a one-dimensional Sérsic fit.
We prepare the images (galaxy and PSF) and the GALFIT input
files. Here we select the appropriate model we want to fit.
Then, we identify the starburst emission from the image and
make a set of elliptical (preliminary) masks in order to
mask-out that emission from the fit.
Next, we perform a set of fits and plot the output parameters
versus the size of the masks. From that and the residual images
we identify both the range of mask sizes where the parameters
fit data with the minimum scatter, and the mask outside which
the starburst emission is practically absent.
Afterwards, we use the residual image to refine the size and
shape of the mask and we fit again with the new mask in an
iterative process. Finally, the procedure stops when the best
solution is obtained. A sketch of the procedure is shown in
Fig. 2. The method is described in detail as follows:
1 - Preparing the images and the input files
Reduced and calibrated images were cleaned for bad pixels, cosmic
ray events, and other artefacts.
In some cases, the edge of the images were trimmed (Paper I)
in order to eliminate spurious sources and vignetting.
Background and foreground objects were masked out by using DS9 and the IRAF/PROS
task plcreate.
Images were corrected (Paper I) for small large-scale variations in the sky
background by fitting and subtracting out a low-order polynomial, using the
IRAF task imsurfit.
GALFIT requires a first-guess set of parameters to be given in an input file.
We used the same
![]() ,
,
![]() ,
n values published in Paper I;
for xc, yc, PA q we used mean values averaged outside the
starburst region from the isophote fitting carried out in Paper I, while
c was set to 0.
,
n values published in Paper I;
for xc, yc, PA q we used mean values averaged outside the
starburst region from the isophote fitting carried out in Paper I, while
c was set to 0.
Finally, GALFIT allows us to optionally fit also the sky-background as a
plane that can tilt in x and y:
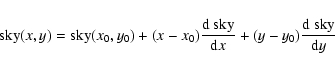 |
(5) |
2 - The input PSF
As we already mentioned, GALFIT uses a PSF image in order to simulate the
seeing and convolve it with models. When fitting the central pixels of a
light distribution, the convolution can be very important since the effects
of seeing are more significant (Trujillo et al. 2001a,b).
Since it is the most accurate way to do it, we extracted a PSF image
directly from the data, finding an unsaturated star with high S/N.
3 - Elaboration of input masks
When fitting the radial surface profiles of the LSB component in BCDs, the determination of the radial interval is critical (Paper I). Whatever the technique employed, we must make sure that we fit only those regions free from the starburst (young stars+gas). So, when fitting an image, we need to mask out the area of the galaxy occupied by the starburst, whose identification is not always straightforward.
Colour maps and H![]() images (when available) could help to identify
and delimit the starburst emission, and thus define a "first order'' size
and shape of the masks.
However, a more accurate determination of the region where the starburst
is practically absent is needed when fitting a Sérsic function.
In order to do this, an iterative procedure described below, has been applied.
The input masks for fitting consist of a set of elliptical masks of different sizes.
We have used the IRAF tasks plcreate and imreplace in order to
create masks of the same size as the input image, with value 0 in those regions to be
fitted ("starburst-free region'') and value 1 in the region we want
to mask out from the fit ("starburst region''). The size of these masks go from
the small ones containing the inner isophotes, i.e. masking out the starburst peak(s),
up to the larger ones, following the shape of the outer isophotes, ensuring that we mask out
the entire starburst emission.
images (when available) could help to identify
and delimit the starburst emission, and thus define a "first order'' size
and shape of the masks.
However, a more accurate determination of the region where the starburst
is practically absent is needed when fitting a Sérsic function.
In order to do this, an iterative procedure described below, has been applied.
The input masks for fitting consist of a set of elliptical masks of different sizes.
We have used the IRAF tasks plcreate and imreplace in order to
create masks of the same size as the input image, with value 0 in those regions to be
fitted ("starburst-free region'') and value 1 in the region we want
to mask out from the fit ("starburst region''). The size of these masks go from
the small ones containing the inner isophotes, i.e. masking out the starburst peak(s),
up to the larger ones, following the shape of the outer isophotes, ensuring that we mask out
the entire starburst emission.
4 - Searching for stability
The derived parameters may strongly depend on the masked area of the galaxy.
Small masks that do not contain all of the starburst emission or very large
masks extending far into the starburst-free region are both expected to produce
unreliable and/or large uncertainties in the fitted parameters.
In Paper I we used two variables: the transition radius,
![]() as
the radius beyond which starburst emission is absent, and
as
the radius beyond which starburst emission is absent, and
![]() ,
the outermost point fitted.
The quantity
,
the outermost point fitted.
The quantity
![]() then indicates the fitted radial interval
where the fit is stable, i.e. the parameters fits with the minimum scatter.
then indicates the fitted radial interval
where the fit is stable, i.e. the parameters fits with the minimum scatter.
Successive fits with elliptical input masks of different sizes is a possible
way of estimating both
![]() and the stability of a given parameter,
as the range of the light distribution that gives the minimum scatter.
Since GALFIT fits the entire image, weighting each
pixel with its own noise, we cannot set an outer radius (i.e.
and the stability of a given parameter,
as the range of the light distribution that gives the minimum scatter.
Since GALFIT fits the entire image, weighting each
pixel with its own noise, we cannot set an outer radius (i.e.
![]() )
for the fit,
so it is difficult to estimate
)
for the fit,
so it is difficult to estimate
![]() .
.
Instead, we prefer to quantify the percentage of galaxy pixels
we actually mask out from fit,
![]() ,
defined as
,
defined as
 |
(6) |
In the fitting procedure, we progressively increase the mask size, starting from a mask somewhat smaller than the starburst and ending with a mask significantly larger than the starburst. In this way, we aim to detect sudden changes in the structural parameters, which could indicate a significant contamination by the starburst light, i.e. a rough estimation of the transition radius.
The number of masks, and thus of independent fits, varies depending upon
the galaxy size, but between six and ten is usually enough to generate
a "stability plot'' in which the structural parameters are represented
versus
![]() (and/or
(and/or
![]() ,
see Figs. 4-6).
The step between masks, i.e. the step in
,
see Figs. 4-6).
The step between masks, i.e. the step in
![]() ,
depends on the extension of the starburst in each filter for
a given galaxy.
Each fit with a given mask is carried out twice with a fixed sky value and
a sky value free to vary in the fit.
As we shall discuss later, the difference between the values for the Sérsic
parameters in the two cases gives us a further estimation of the
uncertainties on fitting the LSB component.
The procedure can be automatized up to this point.
,
depends on the extension of the starburst in each filter for
a given galaxy.
Each fit with a given mask is carried out twice with a fixed sky value and
a sky value free to vary in the fit.
As we shall discuss later, the difference between the values for the Sérsic
parameters in the two cases gives us a further estimation of the
uncertainties on fitting the LSB component.
The procedure can be automatized up to this point.
5 - The final mask
From the stability plots we identify the best model, i.e. the one in which the
starburst has been completely masked out (see asterisks in Figs. 4-6).
From that model we determine the
![]() range where the parameters do not
change significantly (e.g. see grey band in Fig. 8).
We inspect the residual images (galaxy - model) in
order to check the goodness of the model outside the mask. Note that
the size and shape of the starburst and possible extra features overlapping the galaxy
are generally not axisymmetric, so
the size and shape of the mask for each galaxy image can be refined
after inspecting the residuals, as explained below.
Any signs of non-axisymmetric features, such as spiral arms, distortions or
possible dust lanes, can be detected in the residual images. The model
should be fainter than the galaxy in the starburst region and therefore,
the residuals within the masked inner region should be positive.
range where the parameters do not
change significantly (e.g. see grey band in Fig. 8).
We inspect the residual images (galaxy - model) in
order to check the goodness of the model outside the mask. Note that
the size and shape of the starburst and possible extra features overlapping the galaxy
are generally not axisymmetric, so
the size and shape of the mask for each galaxy image can be refined
after inspecting the residuals, as explained below.
Any signs of non-axisymmetric features, such as spiral arms, distortions or
possible dust lanes, can be detected in the residual images. The model
should be fainter than the galaxy in the starburst region and therefore,
the residuals within the masked inner region should be positive.
From the image of residuals, we use imreplace to create a new mask by
setting to 1 all those pixels whose residual is larger than three times the local rms.
In this way, the new mask will generally be smaller and will follow
more precisely the shape of the starburst region.
We call these new masks irregular masks. Then, we fit the image again.
This iterative process aims at optimizing
![]() by adapting the mask to
the actual extension and shape of the starburst region.
When no significant changes of the parameters are obtained by
refining the masks (typically <1%), and the residuals do not change appreciably,
the iterative procedure stops.
by adapting the mask to
the actual extension and shape of the starburst region.
When no significant changes of the parameters are obtained by
refining the masks (typically <1%), and the residuals do not change appreciably,
the iterative procedure stops.
In Fig. 1 we show a comparison between the final mask derived from
the iterative fits and the continuum-subtracted H![]() contours (>3
contours (>3![]() ), overlapping the B band image of Mrk 35.
The H
), overlapping the B band image of Mrk 35.
The H![]() emission was useful to give us a first guess mask but it turned out to be
somewhat smaller than the whole starburst region in the B band after the complete
mask refinement.
Thus, relying only on the H
emission was useful to give us a first guess mask but it turned out to be
somewhat smaller than the whole starburst region in the B band after the complete
mask refinement.
Thus, relying only on the H![]() image may lead to an overestimation (albeit small)
of the n shape parameter.
image may lead to an overestimation (albeit small)
of the n shape parameter.
6- Definition of solution
The final solution is obtained by using the irregular masks.
Once we determine the stability range as well as refine the mask in shape and size,
we choose the best solution as the one with the minimum
![]() residuals.
This solution is constrained by the dispersion of the stability range and the limits
imposed by the possible error sources, as we will discuss later.
residuals.
This solution is constrained by the dispersion of the stability range and the limits
imposed by the possible error sources, as we will discuss later.
![\begin{figure}
\par\includegraphics[width=8.4cm,clip]{6152Fg01.eps} \end{figure}](/articles/aa/full/2007/20/aa6152-06/img39.gif) |
Figure 1:
Mrk 35, B band. Overlapped in red, the final mask. In white, the H |
| Open with DEXTER | |
In order to test the reliability of the method and to determine its
robustness and flexibility, we carried out a set of fits with synthetic
galaxies.
Our interest in this exercise is to determine the typical errors induced by
the limited number of pixels used in the fit and to study the stability of the fitted
parameters as a function of
![]() .
This way, we are able to define a data range
within which the procedure provides reliable solutions.
We have built a set of model galaxies following the criteria:
.
This way, we are able to define a data range
within which the procedure provides reliable solutions.
We have built a set of model galaxies following the criteria:
![\begin{figure}
\par\includegraphics[angle=270,width=6.7cm,clip]{6152Fg02.eps} \end{figure}](/articles/aa/full/2007/20/aa6152-06/img43.gif) |
Figure 2: Scheme showing the main steps of the method. |
| Open with DEXTER | |
| |
Figure 3:
Two synthetic galaxies with Sérsic index n=1 ( left) and
n=4 ( right). The outermost isophote corresponds to
|
| Open with DEXTER | |
![\begin{figure}
\par\begin{tabular}{l l l l}
\includegraphics[width=8.2cm,clip]{...
...} &
\includegraphics[width=8.2cm,clip]{6152Fg05.eps} \end{tabular} \end{figure}](/articles/aa/full/2007/20/aa6152-06/img47.gif) |
Figure 4:
Relative deviations in the three model parameters ( |
| Open with DEXTER | |
We applied the method described in Sect. 3 to fit and recover the Sérsic parameters. We ran GALFIT with a first-guess estimate as an initial input. In Figs. 4-6 we present examples of the results.
We show in Fig. 4 the relative deviation (i.e., the difference between
output and input values divided by the input value) in ![]() and n, as well as
the deviation (i.e., the difference between output and input values) in
and n, as well as
the deviation (i.e., the difference between output and input values) in
![]() as a function of
as a function of
![]() (upper scale) and
(upper scale) and
![]() (bottom scale)
for two galaxies described by n=1 (left) and n=4 (right) Sérsic profiles.
In this synthetic galaxy, the starburst component contaminates
(bottom scale)
for two galaxies described by n=1 (left) and n=4 (right) Sérsic profiles.
In this synthetic galaxy, the starburst component contaminates ![]() 35%.
The last plotted model (
35%.
The last plotted model (
![]() )
corresponds to
)
corresponds to
![]() .
Red solid lines are models with the sky left as a free parameter.
Black solid lines are models with a fixed sky value.
The error bars correspond to the statistical uncertainties estimated by the GALFIT
.
Red solid lines are models with the sky left as a free parameter.
Black solid lines are models with a fixed sky value.
The error bars correspond to the statistical uncertainties estimated by the GALFIT
![]() minimization.
The grey bands indicate deviations of
minimization.
The grey bands indicate deviations of ![]() and
and ![]() in the output
in the output ![]() and n parameters for n=1 and n=4 respectively, and 0.1 mag deviations for
and n parameters for n=1 and n=4 respectively, and 0.1 mag deviations for
![]() in both cases.
Lower and upper dashed-lines are models for which the sky was fixed
to
in both cases.
Lower and upper dashed-lines are models for which the sky was fixed
to
![]() ,
where
,
where ![]() is the sky uncertainty.
We obtain reasonable estimations of the sky level (
is the sky uncertainty.
We obtain reasonable estimations of the sky level (
![]() % sky)
when the portion of sky in the frame is large enough, typically
% sky)
when the portion of sky in the frame is large enough, typically ![]() times the diameter
of the
times the diameter
of the
![]() isophote.
Two independent methods were applied in order to estimate a value of the sky.
In the first, we use the ellipse task in IRAF to calculate an extended profile
of the galaxy to the edge of the frame.
By plotting the flux as a function of radius we can estimate a region where the contribution
of the galaxy is negligible and the background can be considered flat. Thus, the median
and the standard deviation of the outer points are used (e.g. see Pohlen & Trujillo 2006).
The second method is easier and faster; in addition to stars and other background and/or
foreground objects, the entire galaxy is masked out to an ellipse with a flux smaller
than the rms of the background.
Thus, we fit with GALFIT only the sky function to the image obtaining
isophote.
Two independent methods were applied in order to estimate a value of the sky.
In the first, we use the ellipse task in IRAF to calculate an extended profile
of the galaxy to the edge of the frame.
By plotting the flux as a function of radius we can estimate a region where the contribution
of the galaxy is negligible and the background can be considered flat. Thus, the median
and the standard deviation of the outer points are used (e.g. see Pohlen & Trujillo 2006).
The second method is easier and faster; in addition to stars and other background and/or
foreground objects, the entire galaxy is masked out to an ellipse with a flux smaller
than the rms of the background.
Thus, we fit with GALFIT only the sky function to the image obtaining
![]() .
Both estimations agree for our simulations within
.
Both estimations agree for our simulations within ![]() 0.05 counts (
0.05 counts (![]()
![]() sky).
sky).
Figure 5 shows the comparison between the deviations of the output
![]() ,
,
![]() and n parameters as a function of
and n parameters as a function of
![]() (upper scale) and
(upper scale) and
![]() (bottom scale), for three galaxies with different starburst size.
Galaxy with n=1 is to the left while the n=4 galaxy is to the right.
Different line colours were used to indicate galaxies with different synthetic starburst size,
varying between
(bottom scale), for three galaxies with different starburst size.
Galaxy with n=1 is to the left while the n=4 galaxy is to the right.
Different line colours were used to indicate galaxies with different synthetic starburst size,
varying between ![]() 1
1 ![]() and 2
and 2 ![]() (
(
![]() in black,
in black, ![]() 35% in red, and
35% in red, and ![]() 50% in green).
The error bars and the grey bands have the same meaning as in Fig. 4.
50% in green).
The error bars and the grey bands have the same meaning as in Fig. 4.
Finally, in Fig. 6 we show the main output parameters (
![]() ,
,
![]() ,
and n) versus
,
and n) versus
![]() and
and
![]() for a compact synthetic
disc-like object with a starburst occupying
for a compact synthetic
disc-like object with a starburst occupying ![]() 50% (
50% (![]() 1.9
1.9 ![]() )
of the pixels
until the
)
of the pixels
until the
![]() level. The last model (
level. The last model (
![]() )
has
)
has
![]() .
The horizontal dotted line in the
.
The horizontal dotted line in the
![]() plot corresponds to the total luminosity
of the galaxy (host+starburst). Lines as well as deviations and uncertainties have the
same meaning as in Fig. 4.
plot corresponds to the total luminosity
of the galaxy (host+starburst). Lines as well as deviations and uncertainties have the
same meaning as in Fig. 4.
The examples shown in Figs. 4-6 illustrate the existence of two features:
a sudden change of the parameters, i.e. a significant change of the slope (an elbow),
which indicates the region where the starburst becomes practically absent (
![]() ,
indicated by asterisks in the figures), and a range of models (with
,
indicated by asterisks in the figures), and a range of models (with
![]() )
for which the Sérsic parameters are stable within the
uncertainties showed by the grey bands.
)
for which the Sérsic parameters are stable within the
uncertainties showed by the grey bands.
We resume and discuss our results as follows:
![]() Our simulations show that the starburst contamination has been clearly discriminated by
plotting the successive models with different masks, i.e. parameters vs.
Our simulations show that the starburst contamination has been clearly discriminated by
plotting the successive models with different masks, i.e. parameters vs.
![]() .
The sudden change in the main parameters (
.
The sudden change in the main parameters (
![]() ,
,
![]() and n) followed
by a more or less extended stability region give an estimation of the
and n) followed
by a more or less extended stability region give an estimation of the
![]() value.
That change is well determined by the elbow in the plot, as shown in the
Figs. 4-6. The Sérsic parameters are recovered within the
formal errors from
value.
That change is well determined by the elbow in the plot, as shown in the
Figs. 4-6. The Sérsic parameters are recovered within the
formal errors from
![]() .
The parameter uncertainties grow
up when
.
The parameter uncertainties grow
up when
![]() ,
showing no systematic effects.
Models with
,
showing no systematic effects.
Models with
![]() (i.e, with too small a mask) produce large
systematic overestimations in n and luminosity, which also depends on the
starburst luminosity. The condition
(i.e, with too small a mask) produce large
systematic overestimations in n and luminosity, which also depends on the
starburst luminosity. The condition
![]() is a logical
(physical) constraint to the solution, as shown in the Fig. 6 (dotted line);
in a narrow range of fits, where
is a logical
(physical) constraint to the solution, as shown in the Fig. 6 (dotted line);
in a narrow range of fits, where
![]() ,
the luminosity of the host
can be brighter than the whole galaxy.
,
the luminosity of the host
can be brighter than the whole galaxy.
![\begin{figure}
\par\begin{tabular}{l l l l}
\includegraphics[width=8.1cm,clip]{...
...} &
\includegraphics[width=8.1cm,clip]{6152Fg07.eps} \end{tabular} \end{figure}](/articles/aa/full/2007/20/aa6152-06/img66.gif) |
Figure 5:
Relative deviations in |
| Open with DEXTER | |
![]() When we mask the entire starburst, the amount of galaxy pixels with S/N>1 used for
the fit is critical in order to recover the Sérsic parameters with small
uncertainties (see Figs. 4-6).
The errors induced by sky subtraction as well as the random uncertainties estimated
from
When we mask the entire starburst, the amount of galaxy pixels with S/N>1 used for
the fit is critical in order to recover the Sérsic parameters with small
uncertainties (see Figs. 4-6).
The errors induced by sky subtraction as well as the random uncertainties estimated
from
![]() minimization in the model parameters increase with
minimization in the model parameters increase with
![]() ,
those for n=1 models being smaller than those of n=4 models.
,
those for n=1 models being smaller than those of n=4 models.
![]() Besides the starburst contamination, the other possible and critical systematic error source
in fitting Sérsic profiles at very faint levels is the measurement of the correct
sky value.
Relative deviations caused by an erroneous sky subtraction in low n objects are smaller
than in higher n objects. The most affected Sérsic parameter is n.
For low n objects, we estimate uncertainties within 10% in a significant range of
Besides the starburst contamination, the other possible and critical systematic error source
in fitting Sérsic profiles at very faint levels is the measurement of the correct
sky value.
Relative deviations caused by an erroneous sky subtraction in low n objects are smaller
than in higher n objects. The most affected Sérsic parameter is n.
For low n objects, we estimate uncertainties within 10% in a significant range of
![]() for a given combination of model parameters. For high n galaxies that
range could be narrower, and errors within 20% to 30% are expected.
We estimate ranges of, at least,
for a given combination of model parameters. For high n galaxies that
range could be narrower, and errors within 20% to 30% are expected.
We estimate ranges of, at least, ![]() 25-30%
25-30% ![]() in which the parameters are
stable within these relative deviations.
in which the parameters are
stable within these relative deviations.
![]() In order to weight the pixels in the fit (with their own noise) GALFIT makes a model from
the data information, so accurate solutions require accurate noise information,
basically: readnoise, gain, the number of images combined, and sky level.
In our simulations we have shown that fits with both fixed and free sky value are
in good agreement if the portion of sky is large enough, with uncertainties growing up
towards low S/N levels. The
In order to weight the pixels in the fit (with their own noise) GALFIT makes a model from
the data information, so accurate solutions require accurate noise information,
basically: readnoise, gain, the number of images combined, and sky level.
In our simulations we have shown that fits with both fixed and free sky value are
in good agreement if the portion of sky is large enough, with uncertainties growing up
towards low S/N levels. The
![]() minimization uncertainties in
fits with a free sky value are greater than in those with a fixed one.
minimization uncertainties in
fits with a free sky value are greater than in those with a fixed one.
![]() In our simulations all the parameters behave in a similar way for all the starburst sizes
and luminosities considered; e.g, a downward slope followed by a flatter curve.
As shown in Fig. 5 the
In our simulations all the parameters behave in a similar way for all the starburst sizes
and luminosities considered; e.g, a downward slope followed by a flatter curve.
As shown in Fig. 5 the
![]() value is well determined in all cases.
The range where parameters are stable (grey bands in Figs. 4-6) depends
on
value is well determined in all cases.
The range where parameters are stable (grey bands in Figs. 4-6) depends
on
![]() and on the S/N of the fitted portion of the galaxy.
An important result is that our solutions show an acceptable stability in their
parameters in the range
and on the S/N of the fitted portion of the galaxy.
An important result is that our solutions show an acceptable stability in their
parameters in the range
![]() ,
with relative deviations growing as
the mean S/N ratio of the fitted portion of galaxy decreases.
Even when the percentage of masked galaxy is large (
,
with relative deviations growing as
the mean S/N ratio of the fitted portion of galaxy decreases.
Even when the percentage of masked galaxy is large (![]() 1.5
1.5 ![]() ),
we can still find a range of stability,
),
we can still find a range of stability, ![]() 0.4-0.5
0.4-0.5 ![]() ,
with uncertainties
between 10% and 20%. For low n galaxies the portion of galaxy required for a good fit
is smaller than for high n galaxies, which generally show larger random uncertainties
(see Figs. 4-6).
,
with uncertainties
between 10% and 20%. For low n galaxies the portion of galaxy required for a good fit
is smaller than for high n galaxies, which generally show larger random uncertainties
(see Figs. 4-6).
In Paper I we analysed the benefits and drawbacks of fitting a Sérsic law to the starburst-free region of BCDs radial profiles. Here we apply our previous research to fit two-dimensional images with Sérsic profiles. Although it was argued that the Sérsic law provides a reliable description of the host galaxy, we must assess how sensitive the derived two-dimensional Sérsic parameters are to the observational uncertainties.
Regardless of the specific technique used to fit a Sérsic model to BCD host
galaxies, we must be careful about the choice of the fitted data points
(in a radial profile) or number of pixels (in an image), since the Sérsic
parameters could be very sensitive to that choice.
In Paper I we explored the effect of a limited radial interval in a 1D fit and
concluded that accuracy in its selection is crucial
for small radial (
![]() scale lengths)
and surface brightness intervals (typically less than 4 mag). A broad overview of
this problem in the simulations of ideal galaxies has already been presented in
Sect. 4. As was already observed by Makino et al. (1990) for 1D fits,
we find that in 2D fits the shape parameter n is also the
most sensitive and least constrained parameter, especially when the fit is done
on a restricted surface brightness range.
scale lengths)
and surface brightness intervals (typically less than 4 mag). A broad overview of
this problem in the simulations of ideal galaxies has already been presented in
Sect. 4. As was already observed by Makino et al. (1990) for 1D fits,
we find that in 2D fits the shape parameter n is also the
most sensitive and least constrained parameter, especially when the fit is done
on a restricted surface brightness range.
The inner limit of the fitted interval is given by the size and shape
of the mask, as parameterized by
![]() .
Since the starburst emission generally has a steeper light distribution, a small
underestimation of
.
Since the starburst emission generally has a steeper light distribution, a small
underestimation of
![]() will provide significantly higher n values.
will provide significantly higher n values.
Uncertainties in this case can be quantified by means of the dispersion of the output
parameters of fits with masks of different sizes.
We have tested the procedure through our simulations, taking into
account different settings of the input models.
In particular, the relationship between
![]() ,
,
![]() and
and ![]() was studied (see Sect. 4).
In our sample we found that the stability in the parameters is generally
reached when
was studied (see Sect. 4).
In our sample we found that the stability in the parameters is generally
reached when
![]() (see Table 2).
This indicates that these galaxies have extended starburst emission, and thus we have
to take special care with the size and shape of the masks.
The accurate isolation of the starburst emission is the most important strength of the
technique.
(see Table 2).
This indicates that these galaxies have extended starburst emission, and thus we have
to take special care with the size and shape of the masks.
The accurate isolation of the starburst emission is the most important strength of the
technique.
As shown in the simulations (see Sect. 4) the more concentrated the starburst is, the easier it is to find reliable and stable solutions (e.g. Mrk 370, Mrk 36, Tol 127 and Mrk 35).
![\begin{figure}
\par\includegraphics[width=8.2cm,clip]{6152Fg08.eps} \end{figure}](/articles/aa/full/2007/20/aa6152-06/img71.gif) |
Figure 6:
Example of stability plots: |
| Open with DEXTER | |
Table 2: Parameters for the LSB host galaxy derived from the Sérsic fit.
In those galaxies where the star-forming knots are spread out
over the whole galaxy, we could recover information from those inter-knot pixels,
increasing the number of pixels being fitted. Although this could be useful to check
the stability of solutions, those pixels could have a small starburst light contribution.
Thus, an accurate and more reliable solution is obtained when the whole starburst
contamination is completely masked out.
Figure 7 displays an example, using the R-band image of Mrk 86.
An irregular mask derived by our procedure (shown in
white), masks out only the peaks of the main knots. The fitted parameters are
n=1.07,
![]() and
and ![]() =25.86 arcsec.
The contour of an elliptical mask (shown in yellow) including
almost the whole starburst emission is also shown.
Fitting the host galaxy with that mask, n=1.28,
=25.86 arcsec.
The contour of an elliptical mask (shown in yellow) including
almost the whole starburst emission is also shown.
Fitting the host galaxy with that mask, n=1.28,
![]() and
and
![]() arcsec are obtained.
Notice that when fitting a larger fraction of pixels (i.e. when using the irregular
mask) the n value is lower than in the opposite case, but the luminosity is 0.25 mag higher.
Although there seems to be still a small amount of starburst contamination, it is
evident that the host galaxy of Mrk 86 has a disc-like object structure.
Our best fit in the R-band was n=1.02,
arcsec are obtained.
Notice that when fitting a larger fraction of pixels (i.e. when using the irregular
mask) the n value is lower than in the opposite case, but the luminosity is 0.25 mag higher.
Although there seems to be still a small amount of starburst contamination, it is
evident that the host galaxy of Mrk 86 has a disc-like object structure.
Our best fit in the R-band was n=1.02,
![]() and
and
![]() arcsec, by using a bigger irregular mask (derived from the
B-band frame) which isolates the whole starburst emission following its shape.
arcsec, by using a bigger irregular mask (derived from the
B-band frame) which isolates the whole starburst emission following its shape.
As we have already shown in our simulations the uncertainties resulting from noise fluctuation and sky background subtraction are propagated into the structural parameters when we fit a model to the outer, low signal-to-noise regions of a galaxy. In particular, the Sérsic profile has more extended and shallower tails for high values of n. Thus, an over-subtracted sky background will produce an underestimated n value, while an under-subtraction will overestimate n. We expect that the larger the intrinsic n value, the more sensitive it becomes to this error source (see Paper I and Sect. 4).
We analysed the case of Mrk 5 in order to illustrate this error source
and compare it with our previous simulations and with a similar example given in Paper I.
Results are shown in Table 3. Three cases were examined.
First we considered the best sky background subtraction.
In the second, we over-subtracted the sky background by about 3 times
the sky uncertainty, and in the third we under-subtracted it by the same amount.
This is equivalent to fitting two profiles that follow the envelopes
of the error bars considered in Fig. 5 of Paper I.
For each of the three cases we computed the Sérsic parameters for
the final irregular mask (
![]() arcsec).
The B-band image of Mrk 5 has its best-fit n=0.99 for
arcsec).
The B-band image of Mrk 5 has its best-fit n=0.99 for
![]() arcsec (bold row in the Table 3).
By under-subtracting the sky background n goes up to 1.17,
arcsec (bold row in the Table 3).
By under-subtracting the sky background n goes up to 1.17, ![]() increases by 9%, while the total luminosity does not change by more than 0.05
mag. Over-subtracting the sky background by the same amount, n falls to 0.88,
increases by 9%, while the total luminosity does not change by more than 0.05
mag. Over-subtracting the sky background by the same amount, n falls to 0.88,
![]() decreases by 4% and the total luminosity decreases 0.06 mag.
decreases by 4% and the total luminosity decreases 0.06 mag.
In the fitting procedure, GALFIT estimates the statistical uncertainties by using the
covariance matrix of the parameters (see P02 for a detailed description).
Those uncertainties are random errors (Poissonian fluctuations) since GALFIT
assumes that the fitted profile is correct, so these estimated errors are
generally very small compared to non-random errors from other sources.
For our galaxies, these random errors are <1![]() .
.
Galaxies are not perfectly axially symmetric objects.
Since GALFIT does not allow for radial changes in axis ratio and position angle
of a given component, we expect to obtain larger residuals when fitting
regions with twisted or irregular isophotes.
This is a remarkable weaknesses of the method.
Mrk 35 (see Fig. 10) is useful to illustrate this case.
This galaxy shows negative and positive residuals in the border of the mask,
just in the region where isophotes twist.
However, this does not seem to have a great effect on n, ![]() ,
or
,
or
![]() values.
If we observed systematic residuals produced by these effects, we could check whether
they are produced by a real feature (e.g. dust, spiral arms, bars, isophote twists, etc.),
and quantify the changes in the parameters by playing with the ellipticity and the
position angle, i.e., fixing different values as input in the fits, and comparing
its residuals.
values.
If we observed systematic residuals produced by these effects, we could check whether
they are produced by a real feature (e.g. dust, spiral arms, bars, isophote twists, etc.),
and quantify the changes in the parameters by playing with the ellipticity and the
position angle, i.e., fixing different values as input in the fits, and comparing
its residuals.
Table 3:
Columns:
(2) transition radius (arcsec);
(3) masked area relative to
![]() of the galaxy;
(4) Sérsic shape parameter;
(5) effective radius (
of the galaxy;
(4) Sérsic shape parameter;
(5) effective radius (
![]() );
(6) effective surface brightness (mag arcsec-2);
(7) total magnitude of the LSB component derived form the fit (mag);
(8)
);
(6) effective surface brightness (mag arcsec-2);
(7) total magnitude of the LSB component derived form the fit (mag);
(8)
![]() .
In bold the best fitting parameters.
.
In bold the best fitting parameters.
In order to overcome the above problems and to assess the reliability of the fit, we need to carry out some consistency checks.
First, the reliability of the derived Sérsic parameters are assessed by examining
the stability plots. Given their sensitivity to the
![]() range we explore
whether there exists a range in the light profile where the fit is stable
and does not depend on the exact choice of
range we explore
whether there exists a range in the light profile where the fit is stable
and does not depend on the exact choice of
![]() .
The stability criterion is the same as that applied to the simulations in Sect. 4.
Second, as we expect that the old stellar host galaxy has negligible color gradients
(as shown by the observed behaviour in the outer parts, see for example
C01b; Gil de Paz & Madore 2005), both n and
.
The stability criterion is the same as that applied to the simulations in Sect. 4.
Second, as we expect that the old stellar host galaxy has negligible color gradients
(as shown by the observed behaviour in the outer parts, see for example
C01b; Gil de Paz & Madore 2005), both n and ![]() should be the same in
all passbands, while the differences in
should be the same in
all passbands, while the differences in
![]() and
and
![]() reflect the LSB colors.
Finally, the sky background analysis implemented in our simulations (see Sect. 4)
is systematically applied.
reflect the LSB colors.
Finally, the sky background analysis implemented in our simulations (see Sect. 4)
is systematically applied.
![\begin{figure}
\par\includegraphics[width=8.8cm,clip]{6152Fg09.eps} \end{figure}](/articles/aa/full/2007/20/aa6152-06/img88.gif) |
Figure 7: Mrk 86, R band. In white, the mask covering the starburst peaks. In yellow, the contours of the elliptical mask containing most of the starburst emission. |
| Open with DEXTER | |
![\begin{figure}
\par\includegraphics[angle=90,width=6.3cm,clip]{6152Fg10.eps}\end{figure}](/articles/aa/full/2007/20/aa6152-06/img89.gif) |
Figure 8:
Stability in the 2D fit of Mrk 370: the free parameters |
| Open with DEXTER | |
In Fig. 8 we show the three model parameters
(
![]() ,
,
![]() and n) of Mrk 370 for three
bands: B (blue line), V (green line) and R (red line), versus
and n) of Mrk 370 for three
bands: B (blue line), V (green line) and R (red line), versus
![]() .
Each point in the lines corresponds
to one fit by using an elliptical mask with a given
.
Each point in the lines corresponds
to one fit by using an elliptical mask with a given
![]() (and thus,
(and thus,
![]() )
value.
We notice some features: first, there exists a sudden change in the slope of the curves
by increasing the size of the mask. This "elbow'', as shown in the previous simulations,
indicates the region where the starburst becomes practically absent. The second,
these free parameters are quite stable (grey bands)
in the range between
)
value.
We notice some features: first, there exists a sudden change in the slope of the curves
by increasing the size of the mask. This "elbow'', as shown in the previous simulations,
indicates the region where the starburst becomes practically absent. The second,
these free parameters are quite stable (grey bands)
in the range between
![]() and 28 arcsec.
The grey bands correspond to dispersions
and 28 arcsec.
The grey bands correspond to dispersions
![]() ,
,
![]() ,
and
,
and
![]() .
In the case of n and
.
In the case of n and ![]() these bands take into account the dispersion between
filters, which can be explained by differences in image depth and quality.
We refine the mask by using the positive residuals (>
these bands take into account the dispersion between
filters, which can be explained by differences in image depth and quality.
We refine the mask by using the positive residuals (>![]() )
in this range of stability
thus obtaining the final irregular masks (see Sect. 3).
With it, we obtain a better fit, i.e.
)
in this range of stability
thus obtaining the final irregular masks (see Sect. 3).
With it, we obtain a better fit, i.e.
![]() ,
constraining the starburst mask
in size and shape.
We also perform various fits constraining parameters such as c, PA, q, or the
centre coordinates, by varying the input values, and playing with small variations of
the sky background in order to check the stability and find the best
,
constraining the starburst mask
in size and shape.
We also perform various fits constraining parameters such as c, PA, q, or the
centre coordinates, by varying the input values, and playing with small variations of
the sky background in order to check the stability and find the best
![]() and
residuals. We indicate the final best fits by the color dots.
Notice that for the B filter the difference between the elliptical masks fits
(blue line) and the irregular mask fit (blue dot) is quite large.
In a filter where the starburst is more luminous, this result remarks the importance
of a better constraint of the size and the shape of the mask.
and
residuals. We indicate the final best fits by the color dots.
Notice that for the B filter the difference between the elliptical masks fits
(blue line) and the irregular mask fit (blue dot) is quite large.
In a filter where the starburst is more luminous, this result remarks the importance
of a better constraint of the size and the shape of the mask.
The results of the 2D fitting of a Sérsic law to the starburst-free regions
of the galaxy images are presented in Table 2. It is worth
mentioning that, in all cases after the procedure is completed, stable
parameters were obtained.
The consistency checks discussed in Sect. 5.4 were applied systematically to all of the galaxies.
As can be seen in Table 2, the dispersion in n and ![]() between
different filters is always less than 10% except for I Zw 123 (
between
different filters is always less than 10% except for I Zw 123 (![]() 23% in n).
These small discrepancies among
different filters are within the uncertainties expected from our simulations and can also be
explained in terms of the different quality of the data.
For each galaxy, we calculated
23% in n).
These small discrepancies among
different filters are within the uncertainties expected from our simulations and can also be
explained in terms of the different quality of the data.
For each galaxy, we calculated
![]() .
.
We calculate a
![]() value as the radius of a circular
mask with the same number of pixels as that used for the best fit.
In all cases we were able to fit more than 74% of the galaxy pixels. The ratio
value as the radius of a circular
mask with the same number of pixels as that used for the best fit.
In all cases we were able to fit more than 74% of the galaxy pixels. The ratio
![]() varies between 0.70 (Mrk 370R) and 1.73 (I Zw 123V).
To estimate the uncertainties in n,
varies between 0.70 (Mrk 370R) and 1.73 (I Zw 123V).
To estimate the uncertainties in n, ![]() and
and
![]() (here
(here
![]() )
we compute the dispersion between parameters in the
stability range defined for each frame, as well as the difference between the
values obtained when fitting with a fixed sky-background and those obtained by setting the
sky-background level as a free parameter.
)
we compute the dispersion between parameters in the
stability range defined for each frame, as well as the difference between the
values obtained when fitting with a fixed sky-background and those obtained by setting the
sky-background level as a free parameter.
We discuss our results in the following subsections, comparing them with those obtained in Paper I. In Figs. 9 and 10 we show three images for each galaxy: (left) the galaxy, (center) the Sérsic model, and (right) the residual image, all in logarithmic intensity grey scale.
![\begin{figure}
\par\begin{tabular}{c c c}
\includegraphics[width=5.45cm,clip]{61...
...ps} &
\includegraphics[width=5.45cm,clip]{6152Fg22.eps}\end{tabular}\end{figure}](/articles/aa/full/2007/20/aa6152-06/img96.gif) |
Figure 9: The galaxy ( Left) and the Sérsic model ( centre) in logarithmic intensity grey scale. The residual image ( right), in linear grey scale for Tol 127 B, Mrk 314 B, Mrk 36 B, and Mrk 86 B. |
| Open with DEXTER | |
This paper confirms that low n Sérsic models are able to reproduce, within the uncertainties, the surface brightness distribution in these three pass-bands in all galaxies of the sample. This may indicate that, for this sample, the hosts resemble a disc-like - exponential - structure.
We compared our results with those of Paper I.
Figure 11 shows the model parameters, n, ![]() ,
,
![]() ,
and
,
and
![]() as well as
as well as
![]() and the surface
brightness evaluated in
and the surface
brightness evaluated in
![]() ,
extracted by the 2D technique for each galaxy in
the three bands: B (blue filled dots), V (green squares), and R (red
asterisks), versus the 1D values reported in Paper I. The diagonal line in
each plot represents a perfect match between the two sets of values. The main
issues are:
,
extracted by the 2D technique for each galaxy in
the three bands: B (blue filled dots), V (green squares), and R (red
asterisks), versus the 1D values reported in Paper I. The diagonal line in
each plot represents a perfect match between the two sets of values. The main
issues are:
![]() The agreement between the Sérsic parameters in
both studies is fairly good for five of the eight galaxies of the sample.
However, small differences are found for one galaxy (Mrk 86), while for the
other two galaxies, Mrk 5 and I Zw 123, the Sérsic parameters between the
two fitting techniques are clearly in disagreement, especially for the
n shape parameter (see Fig. 11a). In Paper I their host galaxies are
presented as possible spheroidal candidates, being fitted by high n values,
The agreement between the Sérsic parameters in
both studies is fairly good for five of the eight galaxies of the sample.
However, small differences are found for one galaxy (Mrk 86), while for the
other two galaxies, Mrk 5 and I Zw 123, the Sérsic parameters between the
two fitting techniques are clearly in disagreement, especially for the
n shape parameter (see Fig. 11a). In Paper I their host galaxies are
presented as possible spheroidal candidates, being fitted by high n values,
![]() for Mrk 5 and
for Mrk 5 and
![]() for I Zw 123,
while we obtained
for I Zw 123,
while we obtained
![]() for Mrk 5 and
for Mrk 5 and
![]() for I Zw 123.
for I Zw 123.
![]() For all the galaxies, we fitted the images successfully with
smaller
For all the galaxies, we fitted the images successfully with
smaller
![]() than in Paper I (see Fig. 11f).
We can fit the images not only with a higher number of pixels - crucial to
minimize the uncertainties - but with a radial range more extended toward the
centre, still avoiding starburst contamination.
Here, we reproduce an example presented in Paper I (see their Fig. 2):
the stability plots in n,
than in Paper I (see Fig. 11f).
We can fit the images not only with a higher number of pixels - crucial to
minimize the uncertainties - but with a radial range more extended toward the
centre, still avoiding starburst contamination.
Here, we reproduce an example presented in Paper I (see their Fig. 2):
the stability plots in n, ![]() and
and
![]() for Mrk 36 (B band) are shown in Fig. 12 (see caption for details).
From the comparison between both techniques, we identify some differences.
Firstly, the radial range for which the parameters are quite stable is bigger in the 2D case.
Secondly, the final fit isolates the starburst emission more accurately, thus including
more high S/N pixels. Finally, the uncertainties are quite smaller than the 1D case.
for Mrk 36 (B band) are shown in Fig. 12 (see caption for details).
From the comparison between both techniques, we identify some differences.
Firstly, the radial range for which the parameters are quite stable is bigger in the 2D case.
Secondly, the final fit isolates the starburst emission more accurately, thus including
more high S/N pixels. Finally, the uncertainties are quite smaller than the 1D case.
Furthermore, since it was described in Sect. 5.1, n could be poorly
constrained when the fit is done in a restricted surface brightness range.
We can define the surface brightness interval as the difference
between the surface brightness evaluated at
![]() (
(
![]() )
and
the value at S/N=1 (
)
and
the value at S/N=1 (
![]() ).
The surface brightness interval is most cases >4 mag, and >3 mag for the other cases.
Notice that these values are lower limits since GALFIT fits those pixels with S/N<1.
We list in Table 2 both
).
The surface brightness interval is most cases >4 mag, and >3 mag for the other cases.
Notice that these values are lower limits since GALFIT fits those pixels with S/N<1.
We list in Table 2 both
![]() and
and
![]() .
.
By the 2D fitting technique we can model the starburst-free region more easily and with higher accuracy, and improve on the stability of the Sérsic parameters, especially n, by reducing the size of the mask and thus providing a larger range of surface brightness available for fitting (see Fig. 11d).
![\begin{figure}
\par\begin{tabular}{c c c}
\includegraphics[width=5.51cm,clip]{61...
...ps} &
\includegraphics[width=5.51cm,clip]{6152Fg34.eps}\end{tabular}\end{figure}](/articles/aa/full/2007/20/aa6152-06/img101.gif) |
Figure 10: The galaxy ( Left) and the Sérsic model ( centre) in logarithmic intensity grey scale. The residual image ( right) in linear grey scale for Mrk 5 B, Mrk 370 B, I Zw 123 B, and Mrk 35 B. |
| Open with DEXTER | |
![\begin{figure}
\begin{tabular}{l l l}
\par\includegraphics[width=4.65cm,angle=0,...
...ncludegraphics[width=4.70cm,angle=0,clip]{6152Fg40.eps}\end{tabular}\end{figure}](/articles/aa/full/2007/20/aa6152-06/img102.gif) |
Figure 11: Comparison between the Sérsic parameters in the three bands (blue dots = B, green squares = V, and red asterisks = R) derived in this work with those reported in Paper I: a) shape parameter n, b) LSB host total magnitude, c) effective radii (kpc), d) effective surface brightness (mag arcsec-2), e) minimum surface brightness (mag arcsec-2), and f) transition radius (kpc). |
| Open with DEXTER | |
![\begin{figure}
\par\includegraphics[angle=90,width=11.4cm,clip]{6152Fg41.eps} \end{figure}](/articles/aa/full/2007/20/aa6152-06/img103.gif) |
Figure 12:
Stability in the 2D fit of Mrk 36 (B band): the parameters |
| Open with DEXTER | |
![\begin{figure}
\par\includegraphics[width=16.8cm,clip]{6152Fg42.eps} \end{figure}](/articles/aa/full/2007/20/aa6152-06/img104.gif) |
Figure 13:
Comparison between the GALFIT 2D model (panels A) and C)) and the 2D model
generated by using the bmodel task of IRAF from the 1D fit (Paper I)
for Mrk 5 (panels B) and D)). In A) and B) we show the two models, while in C) and D)
we show the residuals down to the
|
| Open with DEXTER | |
A special analysis was devoted to Mrk 5 and I Zw 123 (see Fig. 10),
whose 1D and 2D parameters show the largest difference (see Fig. 11).
1) Mrk 5
By using the bmodel task in IRAF we performed 2D modelling of the radial
Sérsic profiles obtained in Paper I, taking into account only those
isophotes used in the fit.
We have subtracted the resulting models from the galaxy image in
order to obtain the residuals and compare them with those given by GALFIT.
Figure 13 gives models and residual images in a surface
brightness colour scale. The regions shown in grey are pixels masked out from
the fit. Quantitatively, both residuals are quite small along the whole LSB
component. Residual histograms for both models are shown in Fig. 14.
Figure 14(left) presents the GALFIT residual distribution while
Fig. 14(center) shows the residual distribution from the 1D fitting. We
normalize the number of pixels by the total number of pixels above
a given S/N threshold. We present three levels ordered by
increasing total pixel number: S/N=2 (blue), S/N=1 (black) and
![]() (with S/N<1, in red), where
(with S/N<1, in red), where
![]() is the outer limit for the
1D fitting (from Paper I). In Fig. 14 (right) we show the comparison
between both distributions out to
is the outer limit for the
1D fitting (from Paper I). In Fig. 14 (right) we show the comparison
between both distributions out to
![]() .
.
The residuals show a Gaussian distribution centred on 0. As we can observe, by decreasing the S/N threshold the Gaussian becomes broader as we include more low signal-to-noise pixels. As we can see in Fig. 13c, no clear difference is observed between both techniques for the same isophote level. Also, as we showed in Sect. 5.2 (see also Table 3), the sky background uncertainties in the fit can be well determined. Stable solutions are found only among low n values. This way, we are unable to explain the differences on the Sérsic parameters from the 1D and the 2D techniques.
![\begin{figure}
\begin{tabular}{l l l}
\includegraphics[angle=90,width=5.25cm,c...
...ncludegraphics[angle=90,width=5cm,clip]{6152Fg45.eps} \end{tabular} \end{figure}](/articles/aa/full/2007/20/aa6152-06/img105.gif) |
Figure 14: Residual histograms for Mrk 5. Comparison between residuals provided from the 2D model and the 2D model generated from the 1D fit. See text in Sect. 4.3.1 for details. |
| Open with DEXTER | |
On the other hand, the inward extrapolation of the best-fitting 1D Sérsic
model results in significantly higher luminosity than that observed for
the radial profile in the central ![]() 10 arcsec (see Fig. 5 in Paper I).
Our best-fitting 2D Sérsic model does not show this characteristic.
However, if we fit these images with GALFIT, but using the main parameters derived
from the 1D fit, i.e., fixing
10 arcsec (see Fig. 5 in Paper I).
Our best-fitting 2D Sérsic model does not show this characteristic.
However, if we fit these images with GALFIT, but using the main parameters derived
from the 1D fit, i.e., fixing
![]() ,
,
![]() ,
and n, we notice the
same behaviour again.
This fit shows a large negative residual feature inside the entire masked
region, with the LSB component brighter than the actual galaxy light
distribution.
,
and n, we notice the
same behaviour again.
This fit shows a large negative residual feature inside the entire masked
region, with the LSB component brighter than the actual galaxy light
distribution.
2) IZw 123
We analysed the possible differences between both results by inspecting the
residuals and all possible uncertainties in the fit, and we found
possible explanations in terms of both the seeing effects and the
limited radial interval for fitting.
The images of IZw 123 have a FWHM of about 2 arcsec.
In Paper I we fit the radial profile with
![]() ,
n=2.61,
,
n=2.61,
![]() and
and
![]() ,
n=3.01, and
,
n=3.01, and
![]() in B and V bands respectively.
In this work
in B and V bands respectively.
In this work ![]() is 4.59 and 4.11, n 1.58 and 2.20, and
is 4.59 and 4.11, n 1.58 and 2.20, and
![]() 16.08 and 15.46, in B and V respectively.
If we fit the same images in the same conditions but do not use the
convolution in the models,
16.08 and 15.46, in B and V respectively.
If we fit the same images in the same conditions but do not use the
convolution in the models, ![]() goes down to 2.89 and 2.51, n
increases to 2.40 and 3.15, while
goes down to 2.89 and 2.51, n
increases to 2.40 and 3.15, while
![]() decreases to 15.60 and 14.86,
in B and V respectively.
These differences show that seeing convolution of the model is important
when fitting small galaxies observed in poor seeing conditions.
decreases to 15.60 and 14.86,
in B and V respectively.
These differences show that seeing convolution of the model is important
when fitting small galaxies observed in poor seeing conditions.
![\begin{figure}
\par\includegraphics[angle=90,width=7.4cm,clip]{6152Fg46.eps} \end{figure}](/articles/aa/full/2007/20/aa6152-06/img110.gif) |
Figure 15:
I Zw 123 B-band: the free model parameters |
| Open with DEXTER | |
On the other hand, I Zw 123 has the largest
![]() ratio,
i.e., it has the starburst emission with the largest spatial extent, measured in
terms of the host galaxy's structural parameters. If it also has a steep
Sérsic profile and taking into account the results shown in the
simulations (see Sect. 4), the resulting parameters could be very sensitive to
exactly excluding the starburst emission and to the limited sampled area (see also Sect. 5.1).
Figure 15 presents the three model parameters,
n,
ratio,
i.e., it has the starburst emission with the largest spatial extent, measured in
terms of the host galaxy's structural parameters. If it also has a steep
Sérsic profile and taking into account the results shown in the
simulations (see Sect. 4), the resulting parameters could be very sensitive to
exactly excluding the starburst emission and to the limited sampled area (see also Sect. 5.1).
Figure 15 presents the three model parameters,
n, ![]() and
and
![]() ,
as a function of
,
as a function of
![]() in the B band.
There is only a narrow radial interval,
in the B band.
There is only a narrow radial interval,
![]() ,
for which the parameters became reasonably stable, especially for n. Dots with error bars
indicates the final best fits, where
,
for which the parameters became reasonably stable, especially for n. Dots with error bars
indicates the final best fits, where
![]() ,
while asterisks indicates the results from Paper I.
The horizontal dashed-dotted line in the
,
while asterisks indicates the results from Paper I.
The horizontal dashed-dotted line in the
![]() plot indicates the
magnitude of the whole galaxy (host + starburst); host luminosities brighter than that
are physically meaningless.
plot indicates the
magnitude of the whole galaxy (host + starburst); host luminosities brighter than that
are physically meaningless.
Comparing the results from both techniques, we propose our best-fitting 2D Sérsic model as the more physically reliable solution, for the outer regions of the LSB host.
We have presented a new two-dimensional fitting methodology devoted to the characterization of the LSB component in BCD galaxies. The technique is based on the GALFIT algorithm developed by Peng et al. (2002), which permits to fit the whole galaxy image after suitably masking out the pixels contaminated by the starburst.
We described the different steps in our methodology. We carried out a set of fits using synthetic galaxies in order to validate the method and to determine its robustness and estimate the associated uncertainties. The method was applied to the eight BCD galaxies already analysed in Paper I. We fit the same dataset, consisting of deep BVR images, using a Sérsic law. Finally, we analysed our results in terms of the possible error sources and we performed a set of consistency checks comparing the results with those of Paper I. We paid special attention to Mrk 5 and I Zw 123.
The main results of this work can be summarized as follows:
Acknowledgements
Based on observations made at the Nordic Optical Telescope (NOT), in the Spanish Observatory del Roque de los Muchachos of the Instituto de Astrofísica de Canarias and on observations taken at the German/Spanish Calar Alto Observatory. This work has been partially funded by the Spanish DGCyT, grant AYA2004-08260-C03-01. Thanks are given by R.O.A. to Adriana Caldiz and M. Dobrincic for revising the English. R.O.A. thanks R. Sánchez-Janssen for very stimulating discussions and helpful comments. We are sincerely grateful to Dr. Richer for his very detailed comments, suggestions and time which helped us to improve the quality of the manuscript.