A&A 465, 339-344 (2007)
DOI: 10.1051/0004-6361:20066388
H. Socas-Navarro1 - A. Asensio Ramos2 - R. Manso Sainz2
1 - High Altitude Observatory, NCAR![]() , 3080 Center Green Dr, Boulder CO
80301, USA
, 3080 Center Green Dr, Boulder CO
80301, USA
2 -
Instituto de Astrofísica de Canarias, Avda Vía Láctea S/N, La Laguna 38200, Tenerife, Spain
Received 12 September 2006 / Accepted 11 December 2006
Abstract
Context. With the development of new polarimeters for large telescopes, the spectro-polarimetric study of astrophysical bodies is becoming feasible and, indeed, more frequent. In particular, this is permitting the observational study of stellar magnetic fields.
Aims. With the aim to optimize and interpret this kind of observations, we have produced a spectral atlas of circular polarization in a grid of stellar atmospheric models with effective temperatures between 3500 and 10 000 K, surface gravities
![]() ,
metallicities between 10-2 and 1, and magnetic field strengths of 100, 1000 and 5000 G.
,
metallicities between 10-2 and 1, and magnetic field strengths of 100, 1000 and 5000 G.
Methods. We have computed the emergent Stokes I and V flux spectra in LTE of more than 105 spectral lines.
Results. The atlas and several numerical tools are available in electronic format and may be downloaded from http://download.hao.ucar.edu/pub/PSA/. In this paper we review and discuss some of its most relevant features, such as which spectral regions and individual lines harbor the strongest signals, what are interesting lines to observe, how to disentangle field strength from filling factor, etc.
Key words: atlases - stars: atmospheres - stars: magnetic fields - line: formation - polarization - radiative transfer
The development of large-aperture telescopes and high-sensitivity polarimetric instrumentation is providing the Astrophysical community with new tools to explore the universe. Polarimetric observations are opening new and exciting possibilities for the diagnostics of light-matter interaction processes in many different scenarios (see, e.g., the various reviews in Trujillo Bueno et al. 2002).
There are two major reasons why spectral lines produced in stellar atmospheres may become polarized. First, we may have scattering processes in which the photons emitted by the source are deflected towards Earth. Depending on the details of the interaction, one receives light that is (at least in part) linearly polarized in a direction that is closely related to the scattering geometry (and some times other factors, such as the magnetic field). This is obviously of great interest for the detection and characterization of exoplanets (e.g., Keller 2006), protoplanetary and accretion disks (e.g., Donati et al. 2005; Hales et al. 2006; Perrin et al. 2006), binary systems (e.g., Landi degl'Innocenti et al. 1988) etc.
Another source of polarized light is the Zeeman effect that splits the atomic energy sublevels when magnetic fields are present in the spectral line formation region. The strength of the magnetic field required to produce a certain amount of polarization depends on details of the radiative transfer (Zeeman sensitivity of the spectral lines, opacity profile, source function gradient, etc.). Angular integration of a spherically-symmetric emitting source results in circular polarization spectral profiles (linear polarization would cancel out). Analysis of these spectral profiles provides unvaluable clues to study, e.g. magnetic activity in stars (e.g., Wade et al. 2005; Shakhovskoj et al. 2006).
For several decades now, the grid of radiative equilibrium model atmospheres and spectra computed by Kurucz (for an updated reference see Castelli & Kurucz 2003) have been very useful in the preparation and interpretation of stellar observations. We felt that a polarization atlas of the signal emergent from those models, for several magnetic field strengths and metallicities, would also be useful for future observations of stellar magnetic fields. The entire grid of polarized spectra computed in this work is publicly available for download from the following URL: http://download.hao.ucar.edu/pub/PSA/.
The synthetic spectra have been obtained using a compilation of
spectral line data from Kurucz & Bell (1995) between 400 and 1600 nm for
the model with
![]() K and
K and
![]() (hereafter, the
solar-like model), and between 400 and 1000 nm for the rest (if there
is enough interest, we may consider extending the wavelength
range). This is a useful range to consider, as it is accessible to
modern spectro-polarimetric instruments such as MUSICOS
(Donati et al. 1999) or ESPaDOnS (Manset & Donati 2003).
(hereafter, the
solar-like model), and between 400 and 1000 nm for the rest (if there
is enough interest, we may consider extending the wavelength
range). This is a useful range to consider, as it is accessible to
modern spectro-polarimetric instruments such as MUSICOS
(Donati et al. 1999) or ESPaDOnS (Manset & Donati 2003).
Due to insufficient data on partition functions we restricted
ourselves to lines of up to the third ionization stage. Lines of
higher ionization stage have been excluded. The effective
Landé factor (
![]() )
for lines that are not well described by
the LS coupling or for which there is no level configuration
information has been set to zero, so no polarization signal will
appear in these lines
)
for lines that are not well described by
the LS coupling or for which there is no level configuration
information has been set to zero, so no polarization signal will
appear in these lines![]() . Following Casini & Landi Degl'Innocenti (1994), the
H
. Following Casini & Landi Degl'Innocenti (1994), the
H![]() line is assumed to have an effective Landé factor of 1. A
comprehensive list of the lines excluded or computed with zero Landé
factor (35 042 for the solar-like model and 27 188 for the others) is
available for download in electronic format. The total number of lines
considered is 165 501 in the extended range for the solar-like model
and 128 794 for all others. Table 1 lists the
distribution of spectral lines included and excluded in each
wavelength range.
line is assumed to have an effective Landé factor of 1. A
comprehensive list of the lines excluded or computed with zero Landé
factor (35 042 for the solar-like model and 27 188 for the others) is
available for download in electronic format. The total number of lines
considered is 165 501 in the extended range for the solar-like model
and 128 794 for all others. Table 1 lists the
distribution of spectral lines included and excluded in each
wavelength range.
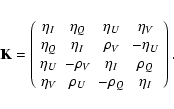
The full polarized radiative transfer vector equation
for a given wavelength is usually written as:
Table 1: Number of lines included and excluded in the syntheses.
The syntheses were carried out using a modified version of the code LILIA (Socas-Navarro 2001). This code was designed for the synthesis and inversion of polarized atomic spectral lines formed in LTE (molecular bands cannot be treated with this code). Solar metal abundances are those from Anders & Grevesse (1989). For all other metallicities, abundances are scaled by a constant factor. Background opacities are obtained with the opacity package used by Shchukina & Trujillo Bueno (2001). The atmosphere is assumed to be one-dimensional and plane-parallel. The formal solution of the polarized transfer equation is based on the Hermitian method of Bellot Rubio et al. (1998). However, a much simpler method may sometimes be used (see the Weakly Polarizing Media approximation below).
The plane-parallel approximation is justified by our choice of
not considering the largest stellar models (![]() between 3.5 and 5). The LTE approximation implicit in the expressions of the source
function and the absorption matrix is justified by the range of
effective temperatures,
between 3.5 and 5). The LTE approximation implicit in the expressions of the source
function and the absorption matrix is justified by the range of
effective temperatures,
![]() between 3500 and 10 000 K.
between 3500 and 10 000 K.
For consistency, we started with the mass scale from the original models
and transformed it into an optical depth scale, using our opacities in
the calculation. The optical depths obtained are the reference height
scale for the radiative transfer. In order to avoid very hot (where
LTE may not be a good approximation for many photospheric lines) or
very large stars (where the spherical geometry may be needed), we
decided to restrict ourselves to a range of effective temperatures
(hereafter
![]() )
between 3500 and 10 000 K and surface gravities
(hereafter
)
between 3500 and 10 000 K and surface gravities
(hereafter ![]() )
between 103.5 and 105. The
mixing-length treatment of these models has been described by
Casteli et al. (1997b, see also Casteli et al. 1997a).
)
between 103.5 and 105. The
mixing-length treatment of these models has been described by
Casteli et al. (1997b, see also Casteli et al. 1997a).
We selected five different representative metallicities, with
abundance ratios (relative to solar) of 1, 10-0.5, 10-1,
10-1.5, and 10-2. For each abundance,
![]() and
and
![]() ,
we computed three different magnetic field strengths of
100 G, 1000 G and 5000 G.
,
we computed three different magnetic field strengths of
100 G, 1000 G and 5000 G.
It is clear that the amount of all possible realizations of magnetic field configurations on the surface of a star cannot be exhausted by any reasonable grid of models; that is certainly not the aim of this work. To find out the particular configuration that best fits some observation, one would need to resort on least-squares inversion methods (such as that of Allende Prieto et al. 2000). Our atlas has been calculated to give a qualitative account of actual observations, as well as to explore possible observational strategies, find the most promissing spectral lines for magnetic field diagnostics, etc. Therefore, we have assumed the simplest possible configuration, given by a monopolar magnetic field pointing radially away from the center and of constant strength.
The spectra are calibrated in flux using a 3-point Gaussian quadrature. We looked at several randomly-chosen models and verified that increasing the quadrature grid to 4 or 5 points did not make any significant difference.
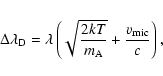
The models used here have a depth-independent microturbulent velocity of 2 km s-1 and a macroturbulence of 1 km s-1. These are roughly representative solar values . In addition to turbulence, other line-broadening mechanisms are taken into account after Gray (1976):
![\begin{figure}
\par\includegraphics[width=9cm,clip]{f1.eps}
\end{figure}](/articles/aa/full/2007/13/aa6388-06/img19.gif) |
Figure 1: Blue continuum spectrum for the solar-like model. The lower panel shows a close-up of the region marked by vertical dotted lines in the upper panel, rescaled to show the discretization of the continuum. Notice, however, in the ordinates scale that this effect is very small. |
| Open with DEXTER | |
 |
(3) |
![\begin{figure}
\par\includegraphics[width=9cm,clip]{f2.eps}
\end{figure}](/articles/aa/full/2007/13/aa6388-06/img35.gif) |
Figure 2: Spectral profile of the Ca II line in the solar-like model, showing some small glitches (marked by the arrows) in the line-to-continuum transition of Stokes I ( upper panel). Stokes V ( lower panel) is much less sensitive to this effect. |
| Open with DEXTER | |
Because the Zeeman splitting increases with wavelength, one might
expect infrared regions to be more promising targets for magnetic
field observations. However, this is not necessarily the
case. Figure 3 shows the total amount of polarization
(in absolute value) measured in each 100 nm interval of the solar-like
model spectrum, i.e.,
![]() .
By far, the blue side of
the spectrum carries a much higher density of polarization signal than
the red or infrared. In fact, for the strongest fields, the region
from 400 to 500 nm exhibits nearly as much signal as the rest of the
spectrum combined (from 500 to 1600 nm). The reason for this is
two-fold. First, the blue region is heavily crowded with a large
number of closely packed spectral lines. This is evident from
Table 1, where we can see that the number of lines per
wavelength interval decreases monotonically towards longer
wavelengths. Second, blue lines are typically much stronger than red
or infrared lines. The degree of polarization produced by a
Zeeman-split line depends not only on the magnetic field and the
component splitting, but also on the line strength.
.
By far, the blue side of
the spectrum carries a much higher density of polarization signal than
the red or infrared. In fact, for the strongest fields, the region
from 400 to 500 nm exhibits nearly as much signal as the rest of the
spectrum combined (from 500 to 1600 nm). The reason for this is
two-fold. First, the blue region is heavily crowded with a large
number of closely packed spectral lines. This is evident from
Table 1, where we can see that the number of lines per
wavelength interval decreases monotonically towards longer
wavelengths. Second, blue lines are typically much stronger than red
or infrared lines. The degree of polarization produced by a
Zeeman-split line depends not only on the magnetic field and the
component splitting, but also on the line strength.
We can see in Fig. 3 the balance among all the
different effects for this model. The amount of Stokes V signal is
largest at 400 nm and decreases monotonically across the visible
spectrum. A minimum is reached between 1200 and 1300 nm, after which
the three curves start to increase again all the way up to
1600 nm. For the stronger fields, the signal drop with wavelength is
considerably more pronounced and the increase after 1300 nm is much
weaker. This is because the amount of polarization produced by a line
increases with the field strength only in the so-called weak-field regime (see, e.g., Landi Degl'Innocenti 1992). This is the regime in
which the Zeeman splitting is smaller than the Doppler width of the
line. If all other parameters are constant, the ratio of Zeeman
splitting to Doppler width increases linearly with wavelength. As we
increase the field strength, red and infrared lines are more likely to
depart from the weak-field regime before blue lines do. In the
saturation regime, the polarization amplitude does not increase with
the magnetic field any more. In summary, observing longer wavelengths
is only advantageous (in terms of polarization amplitude) for
relatively weak fields (![]() 100 G).
100 G).
![\begin{figure}
\par\includegraphics[width=9cm,clip]{f3.eps}
\end{figure}](/articles/aa/full/2007/13/aa6388-06/img38.gif) |
Figure 3: Integrated absolute value of Stokes V (in units of the continuum intensity) over 100 nm bins of the solar-like model. Solid: 100 G. Dashed: 1000 G. Dotted: 5000 G. The scale of the dashed (dotted) curve has been reduced by a factor of 10 (30) in order for all three curves to be plotted together. |
| Open with DEXTER | |
If the magnetic field is not homogeneous and covers only a fraction of the stellar surface, then the Stokes V spectrum will have its overall amplitude decreased according to the filling factor (fractional surface area occupied by the magnetic field). Generally, it is not straightforward to separate the field strength from its filling factor. Figure 3 gives us a clue on how this might be accomplished, since the shapes of the curves for different intrinsic field strengths are clearly different. If one were to take the ratio of polarization signal in the 800 nm to the 400 nm band, this ratio would be larger for the weaker fields and decrease as the field becomes stronger. This is a similar concept to the line-ratio technique used by Stenflo (1973) to propose that the solar magnetic network is actually composed of strong kG fields occupying small filling factors.
There are many other lines that could potentially be used to
disentangle intrinsic field strength from filling
factor. Table 2 lists a number of spectral lines
that have the same line opacity (same lower level excitation potential
and ![]() ). The Fe I lines at 412.180 and 899.956 nm are
particularly promising (see Socas-Navarro et al. 2006), although the disparity
in wavelength may introduce complications (most notably, the
background opacities are sensibly different). There is a number of
Fe I, Ca I, Ti I and Si I that also have
the same Landé factor, and are therefore virtually identical except
for their wavelength. These lines may be useful, for example to
determine accurate atmospheric temperatures through the calculation of
their equivalent width ratio.
). The Fe I lines at 412.180 and 899.956 nm are
particularly promising (see Socas-Navarro et al. 2006), although the disparity
in wavelength may introduce complications (most notably, the
background opacities are sensibly different). There is a number of
Fe I, Ca I, Ti I and Si I that also have
the same Landé factor, and are therefore virtually identical except
for their wavelength. These lines may be useful, for example to
determine accurate atmospheric temperatures through the calculation of
their equivalent width ratio.
Table 2: Compilation of spectral line pairs with identical line opacities.
Table 3: Wavelengths (in nm) exhibiting strongest polarization in the solar-like model. The numbers in parenthesis give the degree of polarization (relative to the local continuum).
Table 3 lists the wavelengths with strongest
polarization signal in the solar-like model. We can see that for weak
fields the strongest signals are in the infrared. As the field
strength increases, most of the infrared lines saturate and the
strongest signals are observed in shorter wavelengths. Note that it is
not straightforward in general to associate specific spectral lines to
those wavelengths because some times (especially in the blue), the
polarization signal arises from a blend of several lines. For example,
the strongest signal in the solar spectrum produced by weak fields
(![]() 100 G) comes from a Fe I line with central wavelength at
1159.358 nm with an effective Landé factor of 2.5. For very strong
fields, on the other hand, the strongest signal comes from a very
crowded region around 448.97 nm. Figure 4 shows the
Stokes V profile in this region. The most conspicuous feature is
produced mostly by an Fe I line at 448.9739 nm (vertical dotted
line), but there are other lines with very close wavelengths that
contribute to it.
100 G) comes from a Fe I line with central wavelength at
1159.358 nm with an effective Landé factor of 2.5. For very strong
fields, on the other hand, the strongest signal comes from a very
crowded region around 448.97 nm. Figure 4 shows the
Stokes V profile in this region. The most conspicuous feature is
produced mostly by an Fe I line at 448.9739 nm (vertical dotted
line), but there are other lines with very close wavelengths that
contribute to it.
The variation with spectral type is shown in Fig. 5 for
![]() .
The later spectral types (left of the figure) have a
very prominent blue side of the spectrum, with a steep decrease
towards the red. Earlier types exhibit a rather flat spectral
dependence, with a minimum around 700 nm. Notice also that there is an
overall decrease of the polarization signal for hotter stars. This is
due to a combination of three different physical effects. First, the
thermal broadening of spectral lines increases with
.
The later spectral types (left of the figure) have a
very prominent blue side of the spectrum, with a steep decrease
towards the red. Earlier types exhibit a rather flat spectral
dependence, with a minimum around 700 nm. Notice also that there is an
overall decrease of the polarization signal for hotter stars. This is
due to a combination of three different physical effects. First, the
thermal broadening of spectral lines increases with
![]() ,
smearing out the polarization signal. Second, the increase in
excitation and ionization state of the atoms in the plasma reduces the
number and strength of spectral lines (especially, the abundant
low-excitation Fe1 lines). This effect is particularly
important in the blue. Finally, if we compute the source function
(S) and its gradient (
,
smearing out the polarization signal. Second, the increase in
excitation and ionization state of the atoms in the plasma reduces the
number and strength of spectral lines (especially, the abundant
low-excitation Fe1 lines). This effect is particularly
important in the blue. Finally, if we compute the source function
(S) and its gradient (
![]() )
and plot the ratio
)
and plot the ratio
![]() in the photosphere as a function of
in the photosphere as a function of
![]() ,
we find that this ratio
has a maximum around 5000 K and then decreases monotonically for
hotter stars.
,
we find that this ratio
has a maximum around 5000 K and then decreases monotonically for
hotter stars.
![\begin{figure}
\par\includegraphics[width=9cm,clip]{f4.eps}
\end{figure}](/articles/aa/full/2007/13/aa6388-06/img42.gif) |
Figure 4: Stokes V signal in the region around 449 nm. This is where the strongest polarization is found for the 5000 G field. The vertical dotted line marks the central wavelength of a strong Fe I transition at 448.9739 nm. The half-amplitude of this profile is approximately 44% of the continuum intensity. |
| Open with DEXTER | |
![\begin{figure}
\par\includegraphics[width=14cm,clip]{f5.eps}
\end{figure}](/articles/aa/full/2007/13/aa6388-06/img43.gif) |
Figure 5: Integrated absolute value of Stokes V (in units of the continuum intensity) over 100 nm bins for varying spectral types and a 1 kG field. |
| Open with DEXTER | |
Stellar polarimetry is becoming increasingly important in Astrophysics and it is now possible to obtain polarized spectra over a broad range of wavelengths (examples are the Narval and Musicos instruments at Pic du Midi, Aurière 2003; or ESPaDOnS at the Canada-France-Hawaii Telescope, Petit et al. 2003), or over a narrower range with very high spatial resolution and large aperture (FORS at the VLT; e.g., Hubrig et al. 2004a,b).
We have used a Stokes synthesis code and a large array of LTE models to produce an atlas of the polarization signal expected from a wide variety of magnetic stars. We hope that this tool will be useful for the planning of future polarimetric observing runs and perhaps for the interpretation of the data, as well.
For example, it may be possible to (coarsely) generalize the popular least-squares deconvolution technique (Donati et al. 1997) to intermediate and strong magnetic regimes. In order to do this, one would take the atlas for the specific star under consideration and add all the spectral lines together, as is usually done when applying least-squares deconvolution, for different magnetic field strengths. By comparing the observed profile to those obtained from the atlas, we may be able to estimate the stellar magnetic field.
In principle, it is conceivable to use the synthesis module developed
here for the application of least-squares inversions (e.g.,
Socas-Navarro 2001; del Toro Iniesta 2003) to stellar spectro-polarimetric
observations. It would be a siginifcant computational undertaking,
however, since this kind of inversions typically requires of the order
of ![]() 100 syntheses (or, if one wishes to use numerical response
functions, this figure would have to be multiplied by the number of
free parameters). An interesting alternative may be the use of
inversions based on Principal Component Analysis combined with a
look-up algorithm (Rees et al. 2000; Socas-Navarro et al. 2001;
Semel et al. 2006). To this aim,
it would be desirable to develop a more refined grid with a better
sampling of the magnetic field and, possibly, a variety of geometries.
100 syntheses (or, if one wishes to use numerical response
functions, this figure would have to be multiplied by the number of
free parameters). An interesting alternative may be the use of
inversions based on Principal Component Analysis combined with a
look-up algorithm (Rees et al. 2000; Socas-Navarro et al. 2001;
Semel et al. 2006). To this aim,
it would be desirable to develop a more refined grid with a better
sampling of the magnetic field and, possibly, a variety of geometries.
A final caveat in using our atlas is that it has been derived from a very simple magnetic toplogy. Active stars are likely to exhibit more complex magnetic structuring. The integration of different field orientations over the stellar disk would result in an overall decrease of the circular polarization signal with respect to the synthetic profiles presented here. However, the relative scaling between different lines and spectral regions should be approximately correct.
Acknowledgements
This work has been partially funded by the Spanish Ministerio de Educación y Ciencia through project AYA2004-05792.
![\begin{displaymath}
{{\rm d}\vec{I}(s) \over {\rm d}s} = - {\bf K}(s) [\vec{I}(s) - \vec{S}(s)] ,
\end{displaymath}](/articles/aa/full/2007/13/aa6388-06/img6.gif)