A&A 465, 35-40 (2007)
DOI: 10.1051/0004-6361:20065920
The soft X-ray cluster-AGN spatial cross-correlation function in the
ROSAT-NEP survey
N. Cappelluti1 - H. Böhringer1 - P. Schuecker1 - E. Pierpaoli2,6 - C. R. Mullis3 - I. M. Gioia4 - J. P. Henry5,1
1 - Max Planck Institute für Extraterrestrische Physik, Postfach 1312,
85741 Garching, Germany
2 - California Institute of Technology, Mail Code 130-33,
Pasadena, CA 91125, USA
3 - Department of Astronomy, University of Michigan, 918 Dennison,
500 Church Street, Ann Arbor, 48109-1042, USA
4 - Istituto di Radioastronomia INAF, via P. Gobetti 101, 40129
Bologna, Italy
5 - Institute for Astronomy, University of Hawai'i, 2680 Woodlawn
Drive, Honolulu, HI 96822, USA
6 - Physics and Astronomy Department, University of Southern California,
Los Angeles, CA 90089-0484, USA
Received 27 June 2006 / Accepted 16 November 2006
Abstract
Context. X-ray surveys facilitate investigations of the environment of AGNs. Deep Chandra observations have revealed that the AGN source surface density rises near clusters of galaxies. The natural extension of this finding is the measurement of spatial clustering of AGNs around clusters and the investigation of relative biasing between active galactic nuclei and galaxies near clusters.
Aims. We aim to measure the correlation length of AGNs around clusters and the average clustering properties of a complete sample of AGNs in a dense environment.
Methods. We present the first measurement of the soft X-ray cluster-AGN cross-correlation function in redshift space using the data of the ROSAT-NEP survey. The survey covers 9  9 deg2 around the North Ecliptic Pole where 442 X-ray sources were detected and almost completely spectroscopically identified.
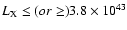
Results. We detected a >3 significant clustering signal on scales s
  50
h70-1 Mpc. We performed a classical maximum-likelihood power-law fit to the data and obtained a correlation length s0 = 8.7
+1.2-0.3
h70-1 Mpc and a slope
50
h70-1 Mpc. We performed a classical maximum-likelihood power-law fit to the data and obtained a correlation length s0 = 8.7
+1.2-0.3
h70-1 Mpc and a slope  = 1.7
+0.2-0.7 (1 errors).
= 1.7
+0.2-0.7 (1 errors).
Conclusions. This is strong evidence that AGNs are good tracers of the large scale structure of the Universe. Our data were compared to the results obtained by cross-correlating X-ray clusters and galaxies. We observe, with a large uncertainty, a similar behaviour of AGN clustering around clusters similar to the clustering of galaxies around clusters.
Key words: galaxies: clusters: general - galaxies: active - X-rays: galaxies:
clusters - cosmology: large-scale structure of Universe - cosmology: dark matter
The current paradigm of galaxy formation assumes that all types of
galaxies reside in dark matter (DM) haloes, and that the properties of
these haloes determine to some extent the properties of the galaxies
inside (White & Rees 1978). In general, the clustering amplitudes of
haloes depend on halo mass. The relation between the clustering
properties of both DM haloes and galaxies (biasing) should thus tell
us something about the physical processes leading to the formation and
evolution of galaxies. Clusters of galaxies are the highest peaks in
the global mass distribution of the Universe and should follow a direct and simple biasing scheme - mainly related to the
underlying primordial Gaussian random field (Kaiser 1987). A simple
means towards a better understanding of galaxy biasing is thus
provided by studies of the relative biasing between galaxies and
clusters of galaxies.
As a first step, previous investigations estimated two-point
statistics like the auto-correlation function (Mullis et al. 2004a;
Gilli et al. 2005; Basilakos et al. 2005; Yang et al. 2006). They
could show that, AGNs trace the underlying cosmic large-scale
structure. In addition, the large-scale structure of X-ray selected
galaxy clusters could be studied in some detail (e.g. Schuecker et al. 2001), but without investigating the link between clusters and AGNs.
In the present paper, we concentrate on the study of the relative
clustering between X-ray selected AGNs and galaxy clusters. Our work
improves on most previous work on the large-scale structure of X-ray
selected AGNs in two important aspects. First, with the exception of
Mullis et al. (2004a), our sample is the only one that is
spectroscopically complete (99.6%). Gilli et al. (2005) used the CDFS
(35%) and the CDFN (50%). The Basilakos et al. (2005) sample had almost no
spectroscopic redshifts. Yang et al. (2006) used the CLASXS sample
(52% complete) and the CDFN (56% complete).
Another motivation for our work is that over the last several years,
X-ray observations revealed that a significant fraction of high-z clusters of galaxies show
overdensities of AGNs in their outskirts (i.e. between 3
h70-1 Mpc and 7
h70-1 Mpc from the center of the cluster) (Henry et al. 1991; Cappi et al. 2001; Ruderman & Ebeling 2005; Cappelluti et al. 2005, and references therein). These overdensities were
however detected in randomly selected archive targeted observations of
galaxy clusters. While these overdensities are highly significant (up
to 8)
when compared to cluster-free fields, the incompleteness
of the samples does not allow one to draw any conclusion about the average
clustering properties of AGNs around clusters. The majority of the
sources making these overdensities have no spectroscopic
identification and therefore any information on their spatial
clustering is lost. More recently Branchesi et al. (2007) showed that
at high-z the source surface density of AGNs significantly increases,
even in the central regions of the clusters. These results imply that
further progress will come from studying the three dimensional spatial
distribution of AGNs around clusters. A natural way to characterize
this specific type of clustering is given by the three-dimensional
cross-correlation of AGNs and galaxy clusters, the computation
of which needs complete redshift information for all objects, which is
rare in X-ray surveys.
In this respect, the ROSAT North Ecliptic Pole (NEP) survey
(Henry et al. 2001, 2006; Voges et al. 2001) is one of the few X-ray surveys covering a sufficiently large volume with an almost complete follow-up
identification of AGNs and clusters (i.e. 440 sources
spectroscopically identified of 442 detected). This survey thus
provides a very useful basis for more precise investigations of the
relative clustering properties of these two types of objects.
We organized the present paper in the following way. In Sect. 2, we
describe the ROSAT-NEP survey data that we use for our investigations
of the spatial distribution of X-ray selected AGNs and galaxy
clusters. For the statistical analysis we estimate their
cross-correlation. A useful estimator for this statistic and the mock
samples needed for its determination are described in Sects. 3 and 4,
respectively. The results are presented in Sect. 5, and are discussed
in Sect. 6. In this paper, we assume a (concordance)
Friedmann-Lemaitre Universe characterized by the Hubble constant given
in units of
 ,
the normalized cosmic matter density
,
the normalized cosmic matter density
 ,
and the
normalized cosmological constant
,
and the
normalized cosmological constant
 .
Unless
otherwise stated, errors are reported at the
.
Unless
otherwise stated, errors are reported at the  confidence level.
The ROSAT NEP survey covers a region of 9
9 deg2around the North Ecliptic Pole (17
 ,
62
,
62
 )
observed with the PSPC
proportional counter as part of the ROSAT All Sky Survey (Henry
et al. 2001; Voges et al. 2001) with a flux limit of
2
10-14 erg cm-2 s-1 in the 0.5-2 keV energy
band. 442 X-ray sources were detected and 440 optically identified.
Spectroscopic redshift information is available for 219 AGNs and 62 clusters of galaxies. The clusters have redshifts
)
observed with the PSPC
proportional counter as part of the ROSAT All Sky Survey (Henry
et al. 2001; Voges et al. 2001) with a flux limit of
2
10-14 erg cm-2 s-1 in the 0.5-2 keV energy
band. 442 X-ray sources were detected and 440 optically identified.
Spectroscopic redshift information is available for 219 AGNs and 62 clusters of galaxies. The clusters have redshifts  0.81 with a median of 0.18 and the AGNs have
3.889 with a median of 0.4 (Fig. 1). For the purpose of this work we selected all
the clusters and the 185 AGNs with
1 (Gioia et al. 2003).
0.81 with a median of 0.18 and the AGNs have
3.889 with a median of 0.4 (Fig. 1). For the purpose of this work we selected all
the clusters and the 185 AGNs with
1 (Gioia et al. 2003).
Such a dataset was used also by Mullis et al. (2004a) for the
calculation of the 3-D auto correlation function of X-ray selected
AGNs. Mullis and collaborators find significant clustering on scales
smaller than  43
h70-1 Mpc with a correlation length of
10.4
h70-1 Mpc, and a slope of the correlation best-fit
power law of = 1.8.
43
h70-1 Mpc with a correlation length of
10.4
h70-1 Mpc, and a slope of the correlation best-fit
power law of = 1.8.
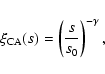
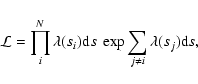
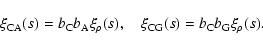
The cross-correlation function
 of clusters and AGNs is
defined by the joint probability of finding, at a distance r, one cluster in the infinitesimal comoving volume element
of clusters and AGNs is
defined by the joint probability of finding, at a distance r, one cluster in the infinitesimal comoving volume element
 and one AGN in the comoving volume element
 ,
,
![\begin{displaymath}%
\delta P=n_{\rm C}~n_{\rm A}~[1+\xi_{\rm CA}(r)]~\delta V_{\rm C}~\delta V_{\rm A},
\end{displaymath}](/articles/aa/full/2007/13/aa5920-06/img21.gif) |
(1) |
where  and
and  are the mean comoving number densities of
clusters and AGNs, respectively. In calculating the differential
cross-correlation in redshift space we used an adapted version of the
Landy-Szalay estimator (Landy & Szalay 1993; see also e.g. Blake et al. 2006),
are the mean comoving number densities of
clusters and AGNs, respectively. In calculating the differential
cross-correlation in redshift space we used an adapted version of the
Landy-Szalay estimator (Landy & Szalay 1993; see also e.g. Blake et al. 2006),
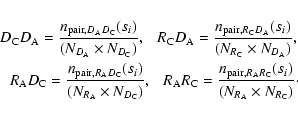
 |
(2) |
where
 ,
,
 ,
,
 and
and
 are
the normalized number of pairs in the ith redshift space
separation s bin for the clusters data-AGN data, cluster
random-AGN data, AGN random-clusters data and clusters random-AGN
random samples, respectively. Using the symbols D and R to represent
the data and random samples, respectively, and C and A to identify
clusters and AGNs, respectively, the normalized pairs are expressed by
are
the normalized number of pairs in the ith redshift space
separation s bin for the clusters data-AGN data, cluster
random-AGN data, AGN random-clusters data and clusters random-AGN
random samples, respectively. Using the symbols D and R to represent
the data and random samples, respectively, and C and A to identify
clusters and AGNs, respectively, the normalized pairs are expressed by
Here,
 are the total numbers
of AGNs and clusters in the data and in the randomly generated
samples, respectively. The quantities
are the total numbers
of AGNs and clusters in the data and in the randomly generated
samples, respectively. The quantities
 represent,
adopting the symbolism used above, the actual number of pairs measured
in the random and data samples as a function of the redshift space
separation si. The distances were computed assuming for the
position of the clusters the centroid of the X-ray emission while for
AGNs the optical positions were adopted. In order to have a good
signal-to-noise ratio (SNR) the data were grouped in logarithmic bins
of
represent,
adopting the symbolism used above, the actual number of pairs measured
in the random and data samples as a function of the redshift space
separation si. The distances were computed assuming for the
position of the clusters the centroid of the X-ray emission while for
AGNs the optical positions were adopted. In order to have a good
signal-to-noise ratio (SNR) the data were grouped in logarithmic bins
of
 Mpc) = 0.15.
![\begin{figure}
\par\includegraphics[height=5.65cm,width=7.1cm,clip]{5920fig1a.ps...
...{5mm}
\includegraphics[height=5.55cm,width=7.1cm,clip]{5920fig1b.ps}\end{figure}](/articles/aa/full/2007/13/aa5920-06/Timg33.gif) |
Figure 1:
Top panel: the redshift distribution of the AGNs in the NEP survey ( shaded histogram) and of the randomly generated AGNs with the same selection
effects ( filled histogram). Bottom panel: the redshift distribution of the galaxy clusters in the NEP survey ( shaded histogram) and of randomly generated clusters ( filled histogram). The deviations at low z between
the data and the random sample are mainly caused by the NEP supercluster of galaxies (Mullis et al. 2001). |
| Open with DEXTER |
Equation (2) indicates that an accurate estimate of the
distribution function of the random samples is crucial in order to
obtain a reliable estimate of
.
Several effects must be taken
into account when generating a sample of objects in a flux limited survey.
Simulated AGNs were randomly placed within the ROSAT NEP survey area.
In order to reproduce the flux distribution of the real sample, we followed
the method of Mullis et al. (2004a). In practice, since the cumulative AGN
 source count distribution can be described by a power law,
 ,
with
,
with
 ,
the differential probability scales as
,
the differential probability scales as
 .
Using a transformation method (e.g. Press et al. 1986, Chap. 7) we see that the
random flux above a certain X-ray flux
.
Using a transformation method (e.g. Press et al. 1986, Chap. 7) we see that the
random flux above a certain X-ray flux
 is distributed as
 ,
where p is a random number uniformly
distributed between 0 and 1 and
= 2
10-14 erg cm-2 s-1, i.e. the flux limit of the NEP survey. All random AGNs
with a flux lower than the flux limit map (see Fig. 4 in Henry et al. 2006) at the source position were excluded. In order to assign a redshift to these "sources'' we computed the predicted redshift distribution at the position of each accepted source. Once the flux limit
at the position where the source was randomly placed is known,
and denoting with
,
where p is a random number uniformly
distributed between 0 and 1 and
= 2
10-14 erg cm-2 s-1, i.e. the flux limit of the NEP survey. All random AGNs
with a flux lower than the flux limit map (see Fig. 4 in Henry et al. 2006) at the source position were excluded. In order to assign a redshift to these "sources'' we computed the predicted redshift distribution at the position of each accepted source. Once the flux limit
at the position where the source was randomly placed is known,
and denoting with  the luminosity function,
then the number of sources per redshift interval dz is given by
the luminosity function,
then the number of sources per redshift interval dz is given by
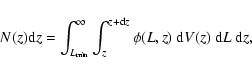 |
(3) |
where
 is the minimum luminosity observable at redshift z
with a local flux limit
and dV(z) the differential comoving volume
element. The k-correction does not play any role in the calculations
since we assumed an average spectral index
is the minimum luminosity observable at redshift z
with a local flux limit
and dV(z) the differential comoving volume
element. The k-correction does not play any role in the calculations
since we assumed an average spectral index  = 2
(as in Mullis et al. 2004a) for all AGNs. For the luminosity function
we took the luminosity-dependent density evolution
(LDDE) best fit model of Hasinger et al. (2005).
A redshift was then randomly assigned to each source via Monte Carlo
integration of the predicted redshift distribution. For galaxy clusters
we applied the same procedure assuming a slope of the
distribution of
= 2
(as in Mullis et al. 2004a) for all AGNs. For the luminosity function
we took the luminosity-dependent density evolution
(LDDE) best fit model of Hasinger et al. (2005).
A redshift was then randomly assigned to each source via Monte Carlo
integration of the predicted redshift distribution. For galaxy clusters
we applied the same procedure assuming a slope of the
distribution of
 = 1.3, as luminosity function an A-B evolving Schechter model (Rosati et al. 2002)
with the parameters obtained by Mullis et al. (2004b) and using a sensitivity map specific for NEP clusters (Henry et al. 2006). Since for clusters of galaxies the k-correction is not negligible, we assigned to the random
clusters an intrinsic spectrum according to a MEKAL spectral model with a plasma temperature
= 1.3, as luminosity function an A-B evolving Schechter model (Rosati et al. 2002)
with the parameters obtained by Mullis et al. (2004b) and using a sensitivity map specific for NEP clusters (Henry et al. 2006). Since for clusters of galaxies the k-correction is not negligible, we assigned to the random
clusters an intrinsic spectrum according to a MEKAL spectral model with a plasma temperature  = 3 keV and a metallicity
 .
We also applied to
a "size-correction'' according to the results
of Henry et al. (2006) in order to compensate for the missing flux in the X-ray photometry
aperture and the variation of the angular dimensions of the object with z.
Such a procedure was repeated until we populated the survey volume with 37 200 random AGNs and 12 600 random clusters (i.e. 200 times more objects
than in the real data sample). The redshift distribution of the random
cluster and AGN samples are plotted in Fig. 1 together
with the real data.
To obtain a realistic estimate of the uncertainties of the cross correlations
we used the bootstrap resampling technique described by e.g. Ling et al. (1986).
.
We also applied to
a "size-correction'' according to the results
of Henry et al. (2006) in order to compensate for the missing flux in the X-ray photometry
aperture and the variation of the angular dimensions of the object with z.
Such a procedure was repeated until we populated the survey volume with 37 200 random AGNs and 12 600 random clusters (i.e. 200 times more objects
than in the real data sample). The redshift distribution of the random
cluster and AGN samples are plotted in Fig. 1 together
with the real data.
To obtain a realistic estimate of the uncertainties of the cross correlations
we used the bootstrap resampling technique described by e.g. Ling et al. (1986).
![\begin{figure}
\par\includegraphics[height=5.65cm,width=7.1cm,clip]{5920fig2.ps}\end{figure}](/articles/aa/full/2007/13/aa5920-06/Timg47.gif) |
Figure 2:
The cluster-AGN soft X-ray cross correlation function plus one.
The error bars are quoted at 1 level. The dashed line represents the best fit
maximum-likelihood power-law fit s0=8.7
+1.2-0.3
h70-1 Mpc and
= 1.7
+0.2-0.7. The shaded region illustrates the 1 confidence
region of the power-law fit in the distance range in which it was performed. |
| Open with DEXTER |
We present the spatial cross-correlation function between clusters and AGNs in
Fig. 2. A positive clustering signal is detected in the
distance interval  50
h70-1 Mpc. In order to test the strength of
the clustering we performed a canonical power-law fit,
50
h70-1 Mpc. In order to test the strength of
the clustering we performed a canonical power-law fit,
 |
(4) |
with s0 and
as free parameters.
The fit can be performed using the
coarsely binned data in Fig. 2 and minimizing the  statistics. However, this approach is extremely sensitive to the size and
distribution of the bins. In order to overcome this problem we performed a standard maximum likelihood power-law fit to unbinned data.
The comoving separation s was parsed in very small
bins so that there are either 0 or 1 data pairs for
any given interval. In this regime Poisson probabilities are appropriate.
In order to perform the fit, we need to find the predicted probability distribution of
the cluster-AGN pairs for each value of
and s0.
We calculated the number of predicted pairs by replacing
statistics. However, this approach is extremely sensitive to the size and
distribution of the bins. In order to overcome this problem we performed a standard maximum likelihood power-law fit to unbinned data.
The comoving separation s was parsed in very small
bins so that there are either 0 or 1 data pairs for
any given interval. In this regime Poisson probabilities are appropriate.
In order to perform the fit, we need to find the predicted probability distribution of
the cluster-AGN pairs for each value of
and s0.
We calculated the number of predicted pairs by replacing
 in Eq. (2)
with the model given by Eq. (4) and using
in Eq. (2)
with the model given by Eq. (4) and using
 (hereinafter
 )
as variable.
We can then use the separations of all the N cluster-AGN pairs to form a likelihood function.
This is defined as the product of the probabilities of having exactly one pair
in the interval ds at each separation si of the N pairs times the probability of having no
pairs in all the other differential intervals. This holds for all s in a chosen range (
sa-sb), in our case where
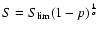
can be reasonably represented by a power law. Assuming Poisson probabilities we thus obtain the likelihood
)
as variable.
We can then use the separations of all the N cluster-AGN pairs to form a likelihood function.
This is defined as the product of the probabilities of having exactly one pair
in the interval ds at each separation si of the N pairs times the probability of having no
pairs in all the other differential intervals. This holds for all s in a chosen range (
sa-sb), in our case where
can be reasonably represented by a power law. Assuming Poisson probabilities we thus obtain the likelihood
 |
(5) |
where
 is the expected number of pairs in the interval ds, and the index j runs over all the elements ds that do not contain pairs. We then define the usual
quantity
is the expected number of pairs in the interval ds, and the index j runs over all the elements ds that do not contain pairs. We then define the usual
quantity
 and drop the terms independent of model parameters (see e.g.
Schuecker & Boehringer 1998; Croft et al. 1997) leading to
and drop the terms independent of model parameters (see e.g.
Schuecker & Boehringer 1998; Croft et al. 1997) leading to
![\begin{displaymath}%
S=2\int_{s_{a}}^{s_{b}}\lambda(s)~{\rm d}s-2\sum_{i}^{N}\ln[\lambda(s_{i})].
\end{displaymath}](/articles/aa/full/2007/13/aa5920-06/img56.gif) |
(6) |
In order to check in which range of separations we can conduct our analysis,
we transformed the angular separations between clusters and AGNs into an average redshift space
separation. We assumed that all the sources were at
 = 0.38 (i.e. the median redshift of the cluster and AGN sample).
The result is plotted in Fig. 3. As one can see there are no real pairs
with separation <2
h70-1 Mpc. For this reason we decided not to consider points
at a separation lower than 2.5
h70-1 Mpc. These points in the cross-correlation function
are mainly introduced by the parameters
,
in Eq. (2) which could have smaller
separations than the real data since the random sample includes neither the extended emission of the clusters nor the broadening due to the PSF of pointlike sources. This prevents us also from overestimating the correlation length
introduced by the amplification bias (see e.g. Vikhlinin & Forman 1995).
For this reason and since on scales larger than 50
h70-1 Mpc there is no
evidence of signal, the fit was performed over the distance range 2.5-50
h70-1 Mpc.
In Fig. 4 we show the results of the
maximum-likelihood power-law fit to
for the ROSAT NEP survey. The 1, 2 and 3
were obtained at
= 0.38 (i.e. the median redshift of the cluster and AGN sample).
The result is plotted in Fig. 3. As one can see there are no real pairs
with separation <2
h70-1 Mpc. For this reason we decided not to consider points
at a separation lower than 2.5
h70-1 Mpc. These points in the cross-correlation function
are mainly introduced by the parameters
,
in Eq. (2) which could have smaller
separations than the real data since the random sample includes neither the extended emission of the clusters nor the broadening due to the PSF of pointlike sources. This prevents us also from overestimating the correlation length
introduced by the amplification bias (see e.g. Vikhlinin & Forman 1995).
For this reason and since on scales larger than 50
h70-1 Mpc there is no
evidence of signal, the fit was performed over the distance range 2.5-50
h70-1 Mpc.
In Fig. 4 we show the results of the
maximum-likelihood power-law fit to
for the ROSAT NEP survey. The 1, 2 and 3
were obtained at  levels of 2.3, 6.2 and 11.8 from the minimum value of S. The best fit parameters obtained are s0 = 8.7
+1.2-0.3
h70-1 Mpc and
= 1.7
+0.2-0.7 where the uncertainty is at the 1 confidence level.
With
fixed to 1.8 (i.e. a typical value found in galaxy-galaxy correlation functions)
we find
levels of 2.3, 6.2 and 11.8 from the minimum value of S. The best fit parameters obtained are s0 = 8.7
+1.2-0.3
h70-1 Mpc and
= 1.7
+0.2-0.7 where the uncertainty is at the 1 confidence level.
With
fixed to 1.8 (i.e. a typical value found in galaxy-galaxy correlation functions)
we find
 Mpc; a similar value was obtained by extending the fitting region to 60
h70-1 Mpc and restricting it to the 2.5-40
h70-1 Mpc.
Mpc; a similar value was obtained by extending the fitting region to 60
h70-1 Mpc and restricting it to the 2.5-40
h70-1 Mpc.
![\begin{figure}
\par\includegraphics[height=5.85cm,width=7.3cm,clip]{5920fig3.ps}\end{figure}](/articles/aa/full/2007/13/aa5920-06/Timg60.gif) |
Figure 3:
The distribution of the angular radial separations
translated into redshift space distances at
= 0.38. |
| Open with DEXTER |
![\begin{figure}
\par\includegraphics[height=5.35cm,width=6.95cm,clip]{5920fig4.ps}\end{figure}](/articles/aa/full/2007/13/aa5920-06/Timg61.gif) |
Figure 4:
The 1,
2
and 3
confidence contours
in the
 space for the power-law fit to
for two interesting
parameters. The cross represents the best fit values. space for the power-law fit to
for two interesting
parameters. The cross represents the best fit values. |
| Open with DEXTER |
The integral constraint (Peebles 1980), which is a systematic shift
in correlation functions introduced by the limited volume observed,
was computed following the
prescription of Roche et al. (1993). This can be obtained numerically with a fit by
assuming that the correlation function is represented by a power law of fixed
index (here we used = 1.7) on all scales sampled by the survey.
The underestimate of
due to the integral constraint is
found to be of the order of 2%.
In order to determine the stability of these results the procedure was
repeated first by separating the field in two subfields twice, the
North and South, and West and East parts of the survey. The
fluctuations due to sample variance are found to be smaller than the
typical amplitude of the uncertainties. A similar result is obtained
by recomputing the
for clusters with  0.18
(i.e. the cluster median redshift) and z>0.18. The dependence of
on the cluster X-ray luminosity (
0.18
(i.e. the cluster median redshift) and z>0.18. The dependence of
on the cluster X-ray luminosity ( )
was evaluated,
dividing the cluster sample into two subsamples with
)
was evaluated,
dividing the cluster sample into two subsamples with
 h70-2 erg s-1.
Though no significant
dependent behaviour was detected,
we cannot yet conclude that there is no luminosity or redshift
dependent cross-correlation length because of the statistics of
the sub-samples. The stability of the result was also checked by
fitting the data with the likelihood estimator used by Mullis
et al. (2004a), returning no significant deviations from our results at
a 1-2 level.
h70-2 erg s-1.
Though no significant
dependent behaviour was detected,
we cannot yet conclude that there is no luminosity or redshift
dependent cross-correlation length because of the statistics of
the sub-samples. The stability of the result was also checked by
fitting the data with the likelihood estimator used by Mullis
et al. (2004a), returning no significant deviations from our results at
a 1-2 level.
We presented here the first direct evidence of spatial clustering of soft X-ray
selected AGNs around X-ray selected clusters of galaxies. Indirect evidence
was presented by Henry et al. (1991), Cappi et al. (2001),
Cappelluti et al. (2005) (and references therein). These authors found
significant X-ray point source overdensities (about a factor 2) around distant
clusters of galaxies when compared to cluster-free fields. If the
overdensities were at the cluster redshift they would arise at scales
smaller than 7
h70-1 Mpc. Since the correlation function is proportional
to
 ,
a
= 1 implies an overdensity of a factor of 2 with respect to a randomly distributed field.
We can conclude that, since the correlation length found in this work
reflects the scale of the overdensities known up to now, we observe a physical
overdensity (of at least a factor of 2) of AGNs around clusters between 2 and 8
h70-1 Mpc from the center of the clusters.
,
a
= 1 implies an overdensity of a factor of 2 with respect to a randomly distributed field.
We can conclude that, since the correlation length found in this work
reflects the scale of the overdensities known up to now, we observe a physical
overdensity (of at least a factor of 2) of AGNs around clusters between 2 and 8
h70-1 Mpc from the center of the clusters.
Because of the shallowness of the NEP survey, the AGN surface density
(i.e. <30 deg2 in the central region) does not allow detection of such a correlation via overdensity analysis since it
would be dominated by small number statistics. From our results we expect to detect
AGN overdensities on scales <7-8
h70-1 Mpc from the center of clusters. At
0.18 (i.e. the
median z of the cluster sample of the NEP survey) these overdensities arise on scales
of 0.6 deg-2 which are easily resolved by the NEP survey.
However, to significantly detect these overdensity on single clusters,
a large number of sources is necessary to disentangle real overdensities
from shot noise. This problem could be easily resolved
by high angular resolution telescopes like Chandra and partially by XMM-Newton.
In this direction deep and wide ![[*]](/icons/foot_motif.gif) Chandra and XMM-Newton surveys like COSMOS,
which will return an AGN surface density of up to 2700 deg-2,
would allow seeing in a 0.015 deg2 region (i.e. the size of an ACIS-I chip) a population of at least 40 AGNs belonging to the cluster environment (i.e. assuming an average overdensity of a factor 2, we expect 40 sources belonging
to the cluster and 40 to the background).
As an example, at the limiting flux of the C-COSMOS survey, the AGN population of a cluster at z = 1 would be observed with a 0.5-2 keV limiting luminosity
Chandra and XMM-Newton surveys like COSMOS,
which will return an AGN surface density of up to 2700 deg-2,
would allow seeing in a 0.015 deg2 region (i.e. the size of an ACIS-I chip) a population of at least 40 AGNs belonging to the cluster environment (i.e. assuming an average overdensity of a factor 2, we expect 40 sources belonging
to the cluster and 40 to the background).
As an example, at the limiting flux of the C-COSMOS survey, the AGN population of a cluster at z = 1 would be observed with a 0.5-2 keV limiting luminosity
 1042 erg s-1.
At z = 1 the size of an ACIS chip (i.e. 8 arcmin) corresponds to a linear dimension
of 4
h70-1 Mpc. Having 40 AGNs in a sphere with this radius corresponds to a space density of AGN with
1042 erg s-1.
At z = 1 the size of an ACIS chip (i.e. 8 arcmin) corresponds to a linear dimension
of 4
h70-1 Mpc. Having 40 AGNs in a sphere with this radius corresponds to a space density of AGN with
 of 0.15
h703 Mpc-3.
According to the result presented here,
clusters of galaxies could be detected by AGN overdensities (rather than
galaxy overdensities) if the depth of the survey provides
an AGN surface density sufficient to overcome the Poisson noise on the AGN number.
In general, in order to understand the galaxy evolution in dense environments
the measure of cross correlation between clusters and different kind of galaxies is an important tool. We already know that infrared dusty galaxies avoid dense environments,
therefore showing a large cross-correlation length and a weak clustering signal in the small
separations region (Sánchez et al. 2005).
We also know that blue galaxies avoid low-z rich clusters cores (Butcher & Oemler 1984).
It is therefore important to compare the cluster-AGN cross correlation length to that of
clusters and different galaxy types.
Mo et al. (1993) computed the cross-correlation function of Abell clusters
and QDOT IRAS galaxies. They found an average correlation length and
a slope in agreement with the results presented here. Moreover
Lilje & Efstathiou (1988) showed that the cross-correlation function of Abell clusters with Lick galaxies is positive on scales 29
h70-1 Mpc with a slope
of 0.15
h703 Mpc-3.
According to the result presented here,
clusters of galaxies could be detected by AGN overdensities (rather than
galaxy overdensities) if the depth of the survey provides
an AGN surface density sufficient to overcome the Poisson noise on the AGN number.
In general, in order to understand the galaxy evolution in dense environments
the measure of cross correlation between clusters and different kind of galaxies is an important tool. We already know that infrared dusty galaxies avoid dense environments,
therefore showing a large cross-correlation length and a weak clustering signal in the small
separations region (Sánchez et al. 2005).
We also know that blue galaxies avoid low-z rich clusters cores (Butcher & Oemler 1984).
It is therefore important to compare the cluster-AGN cross correlation length to that of
clusters and different galaxy types.
Mo et al. (1993) computed the cross-correlation function of Abell clusters
and QDOT IRAS galaxies. They found an average correlation length and
a slope in agreement with the results presented here. Moreover
Lilje & Efstathiou (1988) showed that the cross-correlation function of Abell clusters with Lick galaxies is positive on scales 29
h70-1 Mpc with a slope
 2.2 and a correlation length of 12.6
h70-1 Mpc. These results are also in
agreement within 1
with our findings on AGNs. These
first comparisons suggest that AGNs are clustered around
galaxy clusters just like galaxies.
As a final check we compared our
to the X-ray cluster-galaxy cross-correlation
function (hereinafter CGCCF) computed by Sánchez et al. (2005).
They used the X-ray selected clusters of the REFLEX survey (Böhringer et al. 2002)
and the galaxies from the APM survey (Maddox et al. 1990) limited to bj = 20.5 mag.
They found that the CGCCF behaves like a broken power-law with a cut-off
distance of 2
h70-1 Mpc with a steeper slope at small distances.
We can define the following approximate biasing relations:
2.2 and a correlation length of 12.6
h70-1 Mpc. These results are also in
agreement within 1
with our findings on AGNs. These
first comparisons suggest that AGNs are clustered around
galaxy clusters just like galaxies.
As a final check we compared our
to the X-ray cluster-galaxy cross-correlation
function (hereinafter CGCCF) computed by Sánchez et al. (2005).
They used the X-ray selected clusters of the REFLEX survey (Böhringer et al. 2002)
and the galaxies from the APM survey (Maddox et al. 1990) limited to bj = 20.5 mag.
They found that the CGCCF behaves like a broken power-law with a cut-off
distance of 2
h70-1 Mpc with a steeper slope at small distances.
We can define the following approximate biasing relations:
 |
(7) |
Here
 is the autocorrelation of matter,
 and
and  are the bias factors relative to galaxies, AGNs and clusters, respectively.
By dividing the two equations we can then derive
are the bias factors relative to galaxies, AGNs and clusters, respectively.
By dividing the two equations we can then derive
 .
In order to perform this operation, several effects must be taken in account.
The ratio
is plotted in Fig. 5 as a function of
the distance from the center of the cluster. The shaded region shows the value of our
measurement that implies that
= 1 when taking into account the difference between real and
redshift space measurements discussed in the previous paragraph.
The ratio is consistent with 1 on almost all scales. We cannot exclude,
within the errors, different values of the relative bias. Our data suggest an average relative bias consistent with unity
but allow an upper limit of 6 (at 1)
at separations s<50
h70-1 Mpc. For separations s>10
h70-1 Mpc no lower limits larger than zero can be given. On
larger scales the error increases thus it is difficult to draw any conclusion. At large separations
the power-law shape of
.
In order to perform this operation, several effects must be taken in account.
The ratio
is plotted in Fig. 5 as a function of
the distance from the center of the cluster. The shaded region shows the value of our
measurement that implies that
= 1 when taking into account the difference between real and
redshift space measurements discussed in the previous paragraph.
The ratio is consistent with 1 on almost all scales. We cannot exclude,
within the errors, different values of the relative bias. Our data suggest an average relative bias consistent with unity
but allow an upper limit of 6 (at 1)
at separations s<50
h70-1 Mpc. For separations s>10
h70-1 Mpc no lower limits larger than zero can be given. On
larger scales the error increases thus it is difficult to draw any conclusion. At large separations
the power-law shape of
 becomes uncertain, this makes a comparison of our data
with those of Sánchez et al. (2005) less meaningful.
We cannot exclude a significant antibiasing of AGNs when compared to galaxies, especially
at low separations.
Though the amplitude of the uncertainties of our data still allows a fluctuation in the relative
biasing of more than a factor of 2, we can conclude with a precision of 1
that the
probability for a galaxy to become an AGN is constant in the range of separations sampled in
this work and that AGNs can be considered as a tracer of the dark matter distribution
as are galaxies. New deep and wide field surveys
such as XMM-COSMOS (Hasinger et al. 2006; Cappelluti et al. 2007) and Chandra-COSMOS (P.I.: Martin Elvis) with
their spectroscopically identified >2000 AGNs and 100 clusters
will improve the precision of this work and will allow us to investigate the
behaviour of AGNs in the inner regions of the clusters. In this region the observations
suggest that the AGN source density is affected by other physical effects
such as merging (Ruderman & Ebeling 2005; Branchesi et al. 2006) or ram pressure phenomena.
becomes uncertain, this makes a comparison of our data
with those of Sánchez et al. (2005) less meaningful.
We cannot exclude a significant antibiasing of AGNs when compared to galaxies, especially
at low separations.
Though the amplitude of the uncertainties of our data still allows a fluctuation in the relative
biasing of more than a factor of 2, we can conclude with a precision of 1
that the
probability for a galaxy to become an AGN is constant in the range of separations sampled in
this work and that AGNs can be considered as a tracer of the dark matter distribution
as are galaxies. New deep and wide field surveys
such as XMM-COSMOS (Hasinger et al. 2006; Cappelluti et al. 2007) and Chandra-COSMOS (P.I.: Martin Elvis) with
their spectroscopically identified >2000 AGNs and 100 clusters
will improve the precision of this work and will allow us to investigate the
behaviour of AGNs in the inner regions of the clusters. In this region the observations
suggest that the AGN source density is affected by other physical effects
such as merging (Ruderman & Ebeling 2005; Branchesi et al. 2006) or ram pressure phenomena.
![\begin{figure}
\par\includegraphics[height=5.65cm,width=7.1cm,clip]{5920fig5.ps}\end{figure}](/articles/aa/full/2007/13/aa5920-06/Timg78.gif) |
Figure 5:
The ratio between the observed ROSAT NEP
and the best fit
 obtained by Sánchez et al. (2005). Errors are quoted at the 1 level. The shaded region shows the expected level of
= 1 if the cross-correlation functions were compared in the same space.
obtained by Sánchez et al. (2005). Errors are quoted at the 1 level. The shaded region shows the expected level of
= 1 if the cross-correlation functions were compared in the same space. |
| Open with DEXTER |
We derived for the first time the soft X-ray spatial cross-correlation
function between clusters and AGNs using the data of the ROSAT
NEP survey. A strong clustering signal was detected on scale s< 50
h70-1 Mpc. The best power-law fit parameters are
s0 = 8.7
+1.2-0.3
h70-1 Mpc and
= 1.7
+0.2-0.7. In this work we observed that the
source density of AGNs is higher near clusters than in the field. This
result confirms earlier findings of overdensities of AGNs around
clusters reported by many authors and improves the evidence
connecting the overdensities to the large scale structure of the
Universe. We also derived the relative bias between AGNs and galaxies
which is consistent with one on almost all scales investigated
here. This result still allows, within the errors, a factor of 2 fluctuation. New wide field surveys (such as XMM-COSMOS) performed
with the new generation X-ray telescopes will be useful to enlarge the
statistics, to better understand the physics of AGNs in clusters and
to extend the analysis to the inner regions of clusters.
Acknowledgements
N.C. thanks Günther Hasinger for useful discussions, and
Marica Branchesi for advanced communication of her results.
E.P. is an ADVANCE fellow (NSF grant AST-0340648), also supported by
NASA grant NAG5-11489. J.P.H. thanks the Alexander von Humboldt Foundation
for support to visit the MPE. We also thank the anonymous referee for her/his
useful comments and suggestions.
In memory of Peter Schuecker.
- Basilakos, S., Plionis,
M., Georgakakis, A., & Georgantopoulos, I. 2005, MNRAS, 356,
183 [NASA ADS] (In the text)
- Blake, C., Pope, A., Scott,
D., & Mobasher, B. 2006, MNRAS, 368, 732 [NASA ADS] (In the text)
- Böhringer, H.,
Collins, C. A., Guzzo, L., et al. 2002, ApJ, 566, 93 [NASA ADS] [CrossRef] (In the text)
- Branchesi, M., Gioia, I.
M., Fanti, C., Fanti, R., & Perley, R. 2006, A&A, 446,
97 [NASA ADS] [CrossRef] [EDP Sciences] (In the text)
- Branchesi, M., Gioia, I.
M., Fanti, C., Fanti, R., & Cappelluti, N. 2007, A&A, 462,
449 [NASA ADS] [CrossRef] [EDP Sciences] (In the text)
- Butcher, H., &
Oemler, A., Jr. 1984, ApJ, 285, 426 [NASA ADS] [CrossRef] (In the text)
- Cappelluti, N., Cappi,
M., Dadina, M., et al. 2005, A&A, 430, 39 [NASA ADS] [CrossRef] [EDP Sciences] (In the text)
- Cappelluti, N., et al.
2007, ApJS, [astro-ph/0701196]
(In the text)
- Cappi, M., Mazzotta,
P., Elvis, M., et al. 2001, ApJ, 548, 624 [NASA ADS] [CrossRef] (In the text)
- Croft, R. A. C., Dalton,
G. B., Efstathiou, G., Sutherland, W. J., & Maddox, S. J. 1997,
MNRAS, 291, 305 [NASA ADS] (In the text)
- Croft, R. A. C., Dalton,
G. B., & Efstathiou, G. 1999, MNRAS, 305, 547 [NASA ADS] (In the text)
- Hasinger, G., Miyaji, T.,
& Schmidt, M. 2005, A&A, 441, 417 [NASA ADS] [CrossRef] [EDP Sciences] (In the text)
- Hasinger, G., et al.
2006, ApJS, [astro-ph/0612311]
(In the text)
- Gilli, R., Daddi, E.,
Zamorani, G., et al. 2005, A&A, 430, 811 [NASA ADS] [CrossRef] [EDP Sciences] (In the text)
- Gioia, I. M., Henry, J.
P., Mullis, C. R., et al. 2003, ApJS, 149, 29 [NASA ADS] [CrossRef] (In the text)
- Henry, J. P., &
Briel, U. G. 1991, A&A, 246, L14 [NASA ADS]
- Henry, J. P., Gioia, I.
M., Mullis, C. R., et al. 2001, ApJ, 553, L109 [NASA ADS] [CrossRef] (In the text)
- Henry, J. P., Mullis, C.
R., Voges, W., et al. 2006, ApJS, 162, 304 [NASA ADS] [CrossRef] (In the text)
- Kaiser, N. 1987, MNRAS, 227,
1 [NASA ADS] (In the text)
- Landy, S. D., & Szalay,
A. S. 1993, ApJ, 412, 64 [NASA ADS] [CrossRef] (In the text)
- Lilje, P. B., &
Efstathiou, G. 1988, MNRAS, 231, 635 [NASA ADS] (In the text)
- Ling, E. N., Barrow,
J. D., & Frenk, C. S. 1986, MNRAS, 223, 21P [NASA ADS] (In the text)
- Maddox, S. J.,
Efstathiou, G., Sutherland, W. J., & Loveday, J. 1990, MNRAS,
242, 43P [NASA ADS] (In the text)
- Mo, H. J., Peacock, J. A.,
& Xia, X. Y. 1993, MNRAS, 260, 121 [NASA ADS] (In the text)
- Mullis, C. R., Henry, J.
P., Gioia, I. M., et al. 2001, ApJ, 553, L115 [NASA ADS] [CrossRef] (In the text)
- Mullis, C. R., Henry, J.
P., Gioia, I. M., et al. 2004a, ApJ, 617, 192 [NASA ADS] [CrossRef] (In the text)
- Mullis, C. R.,
Vikhlinin, A., Henry, J. P., et al. 2004b, ApJ, 607, 175 [NASA ADS] [CrossRef] (In the text)
- Peebles, P. J. E. 1980,
The large-scale structure of the universe (Princeton, N.J.:
Princeton University Press)
(In the text)
- Press, W. H., Teukolsky, S.
A., Vetterling, W. T., & Flannery, B. P. 1986, Numerical
Recipes in Fortran (Cambrige University Press)
(In the text)
- Roche, N., Shanks, T.,
Metcalfe, N., & Fong, R. 1993, MNRAS, 263, 360 [NASA ADS] (In the text)
- Rosati, P., Borgani, S.,
& Norman, C. 2002, ARA&A, 40, 539 [NASA ADS] (In the text)
- Ruderman, J. T., &
Ebeling, H. 2005, ApJ, 623, L81 [NASA ADS] [CrossRef] (In the text)
- Sánchez, A. G.,
Lambas, D. G., Böhringer, H., & Schuecker, P. 2005, MNRAS,
362, 1225 [NASA ADS] (In the text)
- Schuecker, P., &
Boehringer, H. 1998, A&A, 339, 315 [NASA ADS] (In the text)
- Schuecker, P.,
Böhringer, H., Guzzo, L., et al. 2001, A&A, 368, 86 [NASA ADS] [CrossRef] [EDP Sciences] (In the text)
- Vikhlinin, A., & Forman,
W. 1995, ApJ, 455, L109 [NASA ADS] [CrossRef] (In the text)
- Voges, W., Henry, J. P.,
Briel, U. G., et al. 2001, ApJ, 553, L119 [NASA ADS] [CrossRef] (In the text)
- White, S. D. M., &
Rees, M. J. 1978, MNRAS, 183, 341 [NASA ADS] (In the text)
- Yang, Y., Mushotzky, R. F.,
Barger, A. J., & Cowie, L. L. 2006, ApJ, 645, 68 [NASA ADS] [CrossRef] (In the text)
Copyright ESO 2007
![\begin{figure}
\par\includegraphics[height=5.65cm,width=7.1cm,clip]{5920fig1a.ps...
...{5mm}
\includegraphics[height=5.55cm,width=7.1cm,clip]{5920fig1b.ps}\end{figure}](/articles/aa/full/2007/13/aa5920-06/img33.gif)
![\begin{figure}
\par\includegraphics[height=5.65cm,width=7.1cm,clip]{5920fig2.ps}\end{figure}](/articles/aa/full/2007/13/aa5920-06/img47.gif)
![\begin{figure}
\par\includegraphics[height=5.85cm,width=7.3cm,clip]{5920fig3.ps}\end{figure}](/articles/aa/full/2007/13/aa5920-06/img60.gif)
![\begin{figure}
\par\includegraphics[height=5.35cm,width=6.95cm,clip]{5920fig4.ps}\end{figure}](/articles/aa/full/2007/13/aa5920-06/img61.gif)
![\begin{figure}
\par\includegraphics[height=5.65cm,width=7.1cm,clip]{5920fig5.ps}\end{figure}](/articles/aa/full/2007/13/aa5920-06/img78.gif)