A&A 464, 451-464 (2007)
DOI: 10.1051/0004-6361:20054708
RASS-SDSS galaxy cluster survey
VII. On the cluster mass-to-light ratio and the halo
occupation distribution
P. Popesso1 - A. Biviano2 - H. Böhringer3 - M. Romaniello1
1 - European Southern Observatory, Karl Scharzschild Strasse 2, 85748 Garching, Germany
2 - INAF - Osservatorio Astronomico di Trieste, via G.B. Tiepolo 11, 34131 Trieste, Italy
3 - Max-Planck-Institut für Extraterrestrische Physik, 85748 Garching, Germany
Received 16 December 2005 / Accepted 8 June 2006
Abstract
Aims. We explore the mass-to-light ratio in galaxy clusters and its relation to the cluster mass.
Methods. We study the relations among the optical luminosity (
 ), the cluster mass (M200) and the number of cluster galaxies within r200 (
 )
in a sample of 217 galaxy clusters with confirmed 3D overdensity. We correct for projection effect, by determining the galaxy surface number density profile in our cluster sample. This is best fitted by a cored King profile in low and intermediate mass systems. The core radius decreases with cluster mass, and, for the highest mass clusters, the profile is better represented by a generalized King profile or a cuspy Navarro, Frenk & White profile.
)
in a sample of 217 galaxy clusters with confirmed 3D overdensity. We correct for projection effect, by determining the galaxy surface number density profile in our cluster sample. This is best fitted by a cored King profile in low and intermediate mass systems. The core radius decreases with cluster mass, and, for the highest mass clusters, the profile is better represented by a generalized King profile or a cuspy Navarro, Frenk & White profile.
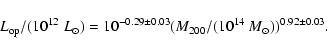
Results. We find a very tight proportionality between
and
,
which, in turn, links the cluster mass-to-light ratio to the Halo Occupation Distribution
vs. M200. After correcting for projection effects, the slope of the
 and
and
 relations is found to be
 ,
close, but still significantly less than unity. We show that the non-linearity of these relations cannot be explained by variations of the galaxy luminosity distributions and of the galaxy M/L with the cluster mass.
,
close, but still significantly less than unity. We show that the non-linearity of these relations cannot be explained by variations of the galaxy luminosity distributions and of the galaxy M/L with the cluster mass.
Conclusions. We suggest that the nonlinear relation between number of galaxies and cluster mass reflects an underlying nonlinear relation between number of subhaloes and halo mass.
Key words: galaxies: clusters: general - galaxies: luminosity function, mass function
Clusters of galaxies are the most massive gravitationally bound
systems in the universe. The cluster mass function and its evolution
provide constraints on the evolution of large-scale structure and
important cosmological parameters such as
 and
and  .
Cluster mass-to-light ratios (M/L hereafter) provide one of the
most robust determination of
in connection with the
observed luminosity density in the Universe via the Oort (1958)
method. In this method, a fundamental assumption is that the average
M/L of clusters is a fair representation of the universal value.
For this reason, many works have focused on the dependence of the
cluster M/L on the mass of the systems. In general, M/L has been
found to increase with the cluster mass. Assuming a power-law relation
.
Cluster mass-to-light ratios (M/L hereafter) provide one of the
most robust determination of
in connection with the
observed luminosity density in the Universe via the Oort (1958)
method. In this method, a fundamental assumption is that the average
M/L of clusters is a fair representation of the universal value.
For this reason, many works have focused on the dependence of the
cluster M/L on the mass of the systems. In general, M/L has been
found to increase with the cluster mass. Assuming a power-law relation
 ,
and adopting the usual scaling relations
between mass and X-ray temperature or velocity dispersion, when
needed, most authors have found
,
and adopting the usual scaling relations
between mass and X-ray temperature or velocity dispersion, when
needed, most authors have found  in the range 0.2-0.4, in both
optical and near-infrared bands, and over a large mass range (Adami et al. 1998a; Bahcall & Comerford 2002; Girardi et al. 2002; Lin et al. 2003, 2004; Rines et al. 2004; Ramella et al. 2004; see however
Kochanek et al. 2003, for a discordant result). Why does the cluster
M/L increase with the mass? Based on the results of numerical
simulations, Bahcall & Comerford (2002) have proposed that the trend
of M/L with mass is caused by the stellar populations of galaxies in
more massive systems being older than the stellar populations of
galaxies in less massive systems. In this scenario, the slope of the
M/L-M relation should be steeper in the B and V bands, dominated
by the young stellar populations, than at longer wavelengths,
eventually becoming flat in the infrared K band, dominated by the
light of the old stellar population. Such a scenario is not
consistent with the results of the semi-analytical modeling of
Kauffmann et al. (1999), where the M/L is predicted to increase
with mass with approximately the same slope in the B and Iband. Also observationally, the slope of the M/L-M relation is found
to be the same in different bands, the B-band (Girardi et al. 2002)
the V-band (Bahcall & Comerford 2002), the R-band (Adami et al. 1998a; Popesso et al. 2005b, 2007) and the K-band (Lin et al. 2003, 2004; Rines et al. 2004; Ramella et al. 2004). An
alternative interpretation of the increasing M/L with system mass is
provided by Springel & Hernquist (2003). They analyze the star
formation efficiency within halos extracted from cosmological
simulations, with masses in the range 108-
in the range 0.2-0.4, in both
optical and near-infrared bands, and over a large mass range (Adami et al. 1998a; Bahcall & Comerford 2002; Girardi et al. 2002; Lin et al. 2003, 2004; Rines et al. 2004; Ramella et al. 2004; see however
Kochanek et al. 2003, for a discordant result). Why does the cluster
M/L increase with the mass? Based on the results of numerical
simulations, Bahcall & Comerford (2002) have proposed that the trend
of M/L with mass is caused by the stellar populations of galaxies in
more massive systems being older than the stellar populations of
galaxies in less massive systems. In this scenario, the slope of the
M/L-M relation should be steeper in the B and V bands, dominated
by the young stellar populations, than at longer wavelengths,
eventually becoming flat in the infrared K band, dominated by the
light of the old stellar population. Such a scenario is not
consistent with the results of the semi-analytical modeling of
Kauffmann et al. (1999), where the M/L is predicted to increase
with mass with approximately the same slope in the B and Iband. Also observationally, the slope of the M/L-M relation is found
to be the same in different bands, the B-band (Girardi et al. 2002)
the V-band (Bahcall & Comerford 2002), the R-band (Adami et al. 1998a; Popesso et al. 2005b, 2007) and the K-band (Lin et al. 2003, 2004; Rines et al. 2004; Ramella et al. 2004). An
alternative interpretation of the increasing M/L with system mass is
provided by Springel & Hernquist (2003). They analyze the star
formation efficiency within halos extracted from cosmological
simulations, with masses in the range 108-
 ,
and
find that the integrated star formation efficiency decreases with
increasing halo mass by a factor 5-10 over the cluster mass
range. This scenario is investigated by Lin et al. (2003), who convert
the 2MASS K-band cluster luminosities into cluster stellar
masses. They find that the fraction of mass in stars is a decreasing
function of the cluster mass (
,
and
find that the integrated star formation efficiency decreases with
increasing halo mass by a factor 5-10 over the cluster mass
range. This scenario is investigated by Lin et al. (2003), who convert
the 2MASS K-band cluster luminosities into cluster stellar
masses. They find that the fraction of mass in stars is a decreasing
function of the cluster mass (
 ).
).
In this paper we address the above issues by studying M/L for a
sample of 217 clusters, which span the entire cluster mass range. In
particular, we study the relations among the cluster optical
luminosity
,
the mass M200, and the number of cluster
galaxies
,
within the virial radius r200. We find a very
tight relation between
and
,
which links the
 relation (and therefore, the cluster M/L), to the
Halo Occupation Distribution (HOD hereafter)
relation (and therefore, the cluster M/L), to the
Halo Occupation Distribution (HOD hereafter)
 .
The
HOD is a powerful tool for describing galaxy bias and modelling galaxy
clustering (e.g. Ma & Fry 2000; Peacock & smith 2000; Seljak 2000;
Scoccimarro et al. 2001; Berlind & Weinberg 2002). It characterizes
the bias between galaxies and mass in terms of the probability
distribution P(N|M) that a halo of virial mass M contains Ngalaxies of a given type, together with relative spatial and velocity
distributions of galaxies and dark matter within halos. The HOD is a
fundamental prediction of galaxy formation theory (e.g. Kauffmann et al. 1997, 1999; White et al. 2001; Yoshikawa et al. 2001; Berlind et al. 2003; Kravtsov et al. 2004; Zheng et al. 2005) and it can be extremely useful to compare
the observational results with the theoretical models.
.
The
HOD is a powerful tool for describing galaxy bias and modelling galaxy
clustering (e.g. Ma & Fry 2000; Peacock & smith 2000; Seljak 2000;
Scoccimarro et al. 2001; Berlind & Weinberg 2002). It characterizes
the bias between galaxies and mass in terms of the probability
distribution P(N|M) that a halo of virial mass M contains Ngalaxies of a given type, together with relative spatial and velocity
distributions of galaxies and dark matter within halos. The HOD is a
fundamental prediction of galaxy formation theory (e.g. Kauffmann et al. 1997, 1999; White et al. 2001; Yoshikawa et al. 2001; Berlind et al. 2003; Kravtsov et al. 2004; Zheng et al. 2005) and it can be extremely useful to compare
the observational results with the theoretical models.
This paper is organized as follows. In Sect. 2 we describe our
dataset. In Sect. 3 we describe the methods we use to calculate
several cluster properties, like the characteristic radius, the virial
mass, the optical luminosity, and the number density profile of
cluster galaxies. In Sect. 4 we analyze the
and the
relations, and find that the number of galaxies per
given halo mass decreases as the halo mass increases. In Sect. 5 we
seek a physical explanation of this trend by comparing our
results with theoretical predictions. In Sect. 6 we provide
our conclusions.
Throughout this paper, we use H0=70 km s-1 Mpc-1 in a
flat cosmology with
 and
and
 (e.g. Tegmark et al. 2004).
2 The data
The optical data used in this paper are taken from the Sloan Digital
Sky Survey (SDSS, Fukugita 1996; Gunn et al. 1998; Lupton et al. 1999;
York et al. 2000; Hogg et al. 2001; Eisenstein et al. 2001; Smith et al. 2002; Strauss et al. 2002; Stoughton et al. 2002; Blanton et al. 2003, and Abazajian et al. 2003). The SDSS consists of an imaging
survey of  steradians of the northern sky in the five passbands
u, g, r ,i, z, in the entire optical range. The imaging survey is
taken in drift-scan mode. The imaging data are processed with a
photometric pipeline (PHOTO, Lupton et al. 2001) specially written for
the SDSS data. For each cluster we defined a photometric galaxy
catalog as described in Sect. 3 of Popesso et al. (2004; see also
Yasuda et al. 2001). For the analysis in this paper we use only SDSS
Model magnitudes. The discussion about completeness limits in
magnitude and surface brightness of the SDSS galaxy photometric sample
can be found in Popesso et al. (2005a,b, Papers II and IV of this
series).
steradians of the northern sky in the five passbands
u, g, r ,i, z, in the entire optical range. The imaging survey is
taken in drift-scan mode. The imaging data are processed with a
photometric pipeline (PHOTO, Lupton et al. 2001) specially written for
the SDSS data. For each cluster we defined a photometric galaxy
catalog as described in Sect. 3 of Popesso et al. (2004; see also
Yasuda et al. 2001). For the analysis in this paper we use only SDSS
Model magnitudes. The discussion about completeness limits in
magnitude and surface brightness of the SDSS galaxy photometric sample
can be found in Popesso et al. (2005a,b, Papers II and IV of this
series).
The spectroscopic component of the survey is carried out using two
fiber-fed double spectrographs, covering the wavelength range
3800-9200 Å, over 4098 pixels. They have a resolution
 varying between 1850 and 2200, and together
they are fed by 640 fibers, each with an entrance diameter of 3 arcsec. The fibers are manually plugged into plates inserted into the
focal plane; the mapping of fibers to plates is carried out by a
tiling algorithm (Blanton et al. 2003) that optimizes observing
efficiency in the presence of large-scale structure.
varying between 1850 and 2200, and together
they are fed by 640 fibers, each with an entrance diameter of 3 arcsec. The fibers are manually plugged into plates inserted into the
focal plane; the mapping of fibers to plates is carried out by a
tiling algorithm (Blanton et al. 2003) that optimizes observing
efficiency in the presence of large-scale structure.
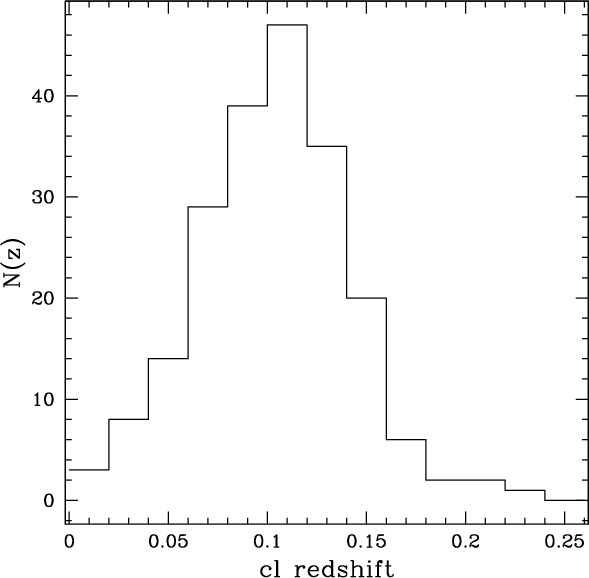
 |
Figure 1:
Redshift distribution of the cluster sample used in this paper. |
| Open with DEXTER |
In this paper we use a combined sample of X-ray selected galaxy
clusters and optically selected systems. The X-ray selected clusters
are taken from the RASS-SDSS galaxy cluster catalog of Popesso et al. (2005b, hereafter Paper III), which comprises 130 systems selected
mainly from the REFLEX and NORAS X-ray cluster catalogs. The optically
selected clusters are taken from Popesso et al. (2007), who selected
a subsample of 130 Abell clusters with confirmed 3-dimensional galaxy
overdensity in the third release of the SDSS galaxy spectroscopic
catalog. The two samples overlap with 43 clusters. The combined sample
with the exclusion of the double detections comprises 217 clusters and
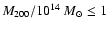
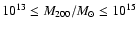
covers the entire range of masses and X-ray/optical luminosities, from
very low-mass and X-ray/optical faint groups (
 )
to
very massive and X-ray/optical bright clusters (
)
to
very massive and X-ray/optical bright clusters (
 ). The cluster sample comprises only nearby systems at the
mean redshift of 0.1. The redshift distribution of the cluster sample
is shown in Fig. 1.
). The cluster sample comprises only nearby systems at the
mean redshift of 0.1. The redshift distribution of the cluster sample
is shown in Fig. 1.
In this section we explain the methods used to calculate the cluster
properties as the characteristic radius, the virial mass, the optical
luminosity and the parameters of the radial profile of the cluster
galaxies.
Here we describe the methods by which we measure the characteristic
cluster radii r200 and mass M200. r200 and M200 are
the radius and the mass, respectively, where the mass density of the
system is 200 times the critical density of the Universe and it is
considered as a robust measure of the virial radius of the cluster.
Estimates of cluster velocity dispersion, mass, and characteristic
radius requires knowledge of the redshifts of its member galaxies. We have
used the redshifts provided in the SDSS spectroscopic catalog.
Cluster members are selected following the method of Adami et al. (1998a) or Girardi et al. (1993), depending on whether the mean
cluster redshift
 is known in advance (from previous
studies) or not, respectively. Girardi et al. (1993) method requires
in fact that a preliminary cut be done in the line-of-sight velocity
space,
is known in advance (from previous
studies) or not, respectively. Girardi et al. (1993) method requires
in fact that a preliminary cut be done in the line-of-sight velocity
space,  km s-1 around
 ,
before searching
for significant weighted-gaps in the velocity distribution. On the
other hand, the density-gap technique of Adami et al. does not require
such a preliminary cut. If
is known
already, we select among the groups identified by the gapping
technique that one closest in velocity space to
,
otherwise we select the most populated one. After the initial group
selection, we apply the interloper-removal method of Katgert et al. (2004; see Appendix A in that paper for more details) on the
remaining galaxies, using the X-ray center when available, or else
the position of the brightest cluster galaxy on the cluster
colour-magnitude sequence.
,
before searching
for significant weighted-gaps in the velocity distribution. On the
other hand, the density-gap technique of Adami et al. does not require
such a preliminary cut. If
is known
already, we select among the groups identified by the gapping
technique that one closest in velocity space to
,
otherwise we select the most populated one. After the initial group
selection, we apply the interloper-removal method of Katgert et al. (2004; see Appendix A in that paper for more details) on the
remaining galaxies, using the X-ray center when available, or else
the position of the brightest cluster galaxy on the cluster
colour-magnitude sequence.
The virial analysis (see, e.g., Girardi et al. 1998) is then performed
on the clusters with at least 10 member galaxies. The velocity dispersion
is computed on the cluster members, using the biweight estimator
(Beers et al. 1990). The virial masses are corrected for the surface
pressure term (The & White 1986) by adopting a profile of Navarro et al. (1996, 1997, NFW hereafter) with a concentration parameter, c,
that depends on the initial estimate of the cluster virial mass
itself. The c-mass relation is given by
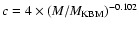 where the slope of the relation is taken from
Dolag et al. (2004), and the normalization
where the slope of the relation is taken from
Dolag et al. (2004), and the normalization
 from Katgert et al. (2004). The clusters in our
sample span a range
from Katgert et al. (2004). The clusters in our
sample span a range
 -6.
-6.
Correction for the surface pressure term requires knowledge of the
r200 radius, for which we adopt the Carlberg et al. (1997)
definition (see Eq. (8) in that paper) as a first guess. After the
virial mass is corrected for the surface pressure term, we refine our
r200 estimate using the virial mass density itself. Let
 be the virial mass (corrected for the surface term) contained in a volume
of radius equal to a chosen observational aperture,
be the virial mass (corrected for the surface term) contained in a volume
of radius equal to a chosen observational aperture,
 .
The
radius r200 is then given by:
.
The
radius r200 is then given by:
![\begin{displaymath}r_{200} \equiv r_{\rm ap} ~ [\rho_{\rm vir}/(200 \rho_{\rm c})]^{1/2.4}
\end{displaymath}](/articles/aa/full/2007/11/aa4708-05/img41.gif) |
(1) |
where
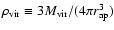 and
and
 is the critical density at redshift z in the adopted cosmology. The
exponent in Eq. (1) is the one that describes the average
cluster mass density profile near r200, as estimated by Katgert
et al. (2004) for an ensemble of 59 rich clusters.
is the critical density at redshift z in the adopted cosmology. The
exponent in Eq. (1) is the one that describes the average
cluster mass density profile near r200, as estimated by Katgert
et al. (2004) for an ensemble of 59 rich clusters.
A NFW profile is used to interpolate (or, in a few cases, extrapolate)
the virial mass
from
to r200, yielding
M200. As before, we scale the concentration parameter of the used
NFW profile according to a preliminary estimate of the mass of the
system. From M200 the final estimate of r200 is obtained,
using the definition of M200 itself.
The total optical luminosity of a cluster has to be computed after the
subtraction of the foreground and background galaxy contamination. We
consider two different approaches to the statistical subtraction of
the galaxy background. We compute the local background number counts
in an annulus around the cluster and a global background number counts
from the mean of the magnitude number counts determined in five
different SDSS sky regions, randomly chosen, each with an area of 30
 .
In our analysis we show the results obtained using the
optical luminosity estimated with the second method. The optical
luminosity is then computed within r200 following the
prescription of Popesso et al. (2004). The reader is referred to that
paper for a detailed discussion about the comparison between optical
luminosities calculated with different methods. To avoid selection
effects due to the slightly different redshifts of the clusters, the
optical luminosity has been calculated in the same absolute magnitude
range for all the clusters. The adopted range has been varied to check
the robustness of the results of the regression analyses.
.
In our analysis we show the results obtained using the
optical luminosity estimated with the second method. The optical
luminosity is then computed within r200 following the
prescription of Popesso et al. (2004). The reader is referred to that
paper for a detailed discussion about the comparison between optical
luminosities calculated with different methods. To avoid selection
effects due to the slightly different redshifts of the clusters, the
optical luminosity has been calculated in the same absolute magnitude
range for all the clusters. The adopted range has been varied to check
the robustness of the results of the regression analyses.
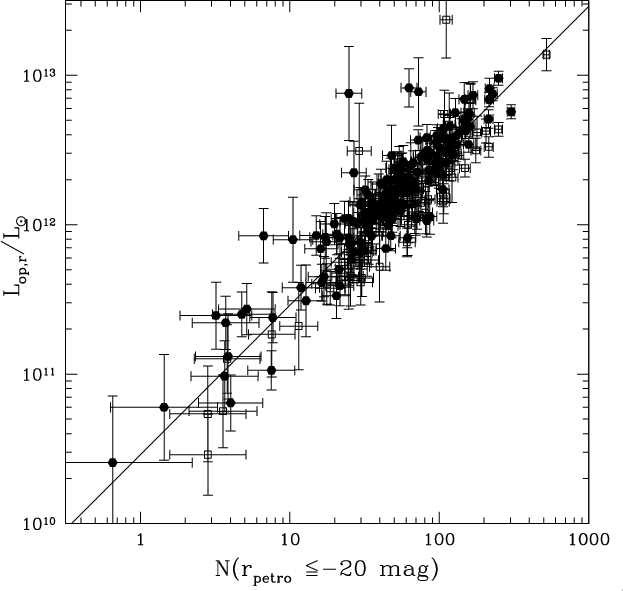
 |
Figure 2:
Relation between the optical luminosity calculated in the SDSS r band
within r200 and the number of cluster galaxies contributing to
.
The solid line is the best fit line with slope
 . . |
| Open with DEXTER |
3.3 Number density profiles and projection effects
The observed cluster optical luminosity,
,
is contributed not
only by galaxies within the virial sphere of radius r200, but
also by galaxies outside the virial sphere yet within the cylinder of
same radius. It is therefore necessary to correct the observed optical
luminosity for the contribution of cluster galaxies outside the virial
sphere (the following analysis is based on photometric data and the
field galaxies contribution is removed statistically as described in
the previous section).
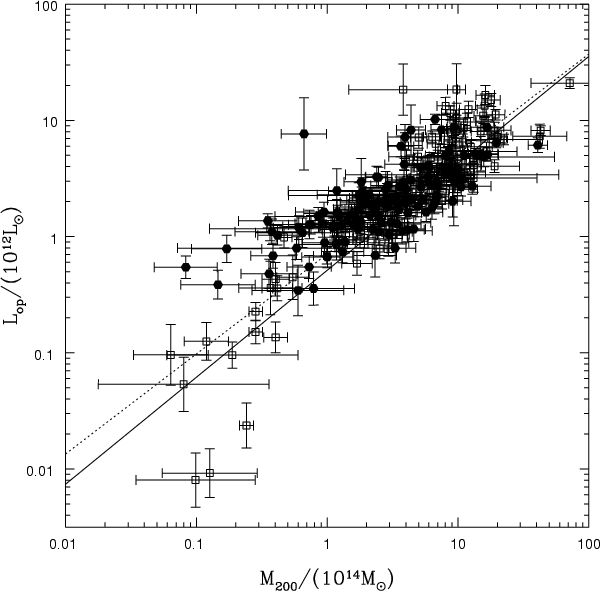
Figure 2 shows the proportionality between the cluster r-band
optical luminosity within r200 and the number of cluster galaxies
(
), contributing to the luminosity itself, i.e. the
background-subtracted galaxy counts within the same radius, down to
the magnitude limit used to estimate
.
Because of the strict
proportionality between
and
,
we can use the ratio
between the number of cluster galaxies within the cylindrical volume
and the number of galaxies within the virial sphere, to correct the
observed
for the contribution of cluster galaxies outside the
virial sphere. In order to estimate this ratio, we build the surface
number density profiles of our clusters, and fit them with two
widely-used analytical functions, the King (1962) cored profile, and
the NFW cuspy profile. The 3D and projected King profiles are given
by, respectively:
 |
(2) |
and:
 |
(3) |
where  is the core radius and
 is the
normalization (see also Sarazin 1980). The NFW profile in 3D is given by:
is the
normalization (see also Sarazin 1980). The NFW profile in 3D is given by:
 |
(4) |
where  is the characteristic radius (
 with cthe concentration parameter) and
  is the normalization. The
projected surface density profile is then obtained from an integration
of the three-dimensional profile (see Bartelmann et al. 1996).
is the normalization. The
projected surface density profile is then obtained from an integration
of the three-dimensional profile (see Bartelmann et al. 1996).
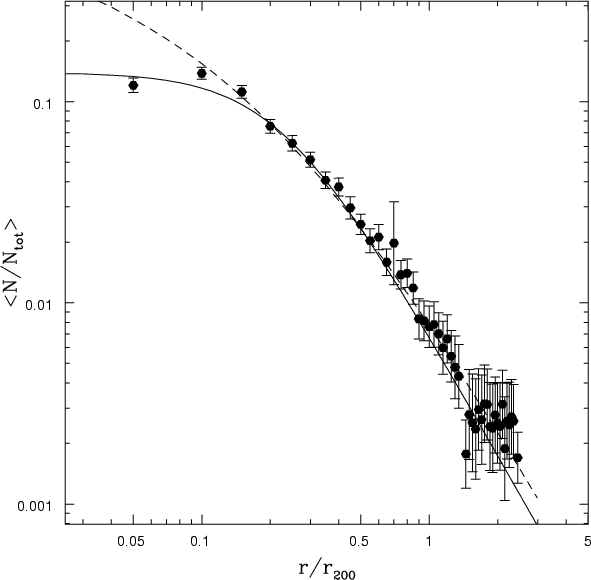
As a first step we explore the the mean surface density galaxy
distribution within our cluster sample, by stacking the projected
galaxy distributions of the individual systems. Note that in this
analysis we only consider the clusters with available X-ray centers,
in order to reduce possible mis-centering when adopting the positions
of brightest cluster galaxies as cluster centers (not all brightest
cluster galaxies lie at centers of their parent clusters, see, e.g.,
Lin & Mohr 2004). The clustercentric distances are rescaled to the
cluster r200 before the stacking. The cluster galaxy
distributions are normalized to the total number of galaxies within
r200, after subtraction of the mean background galaxy density,
evaluated within the 2.5-
 annulus. Figure 3
shows the stacked surface density profile of all the 217 clusters. The
best fit is given by a King profile with core radius
annulus. Figure 3
shows the stacked surface density profile of all the 217 clusters. The
best fit is given by a King profile with core radius
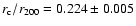 ,
while a NFW profile provides a poor fit
near the centre. We then split our sample of clusters in 6 mass bins:
,
while a NFW profile provides a poor fit
near the centre. We then split our sample of clusters in 6 mass bins:
 ,
,
 ,
,
 ,
,
 ,
,
 ,
and
,
and
 .
Each bin contains at least 10
clusters.
.
Each bin contains at least 10
clusters.
 |
Figure 3:
The stacked mean surface number density profile of all the
cluster galaxies with magnitude r < -18.5. The solid curve is
the best fit King profile, the dashed curve is the best fit NFW
profile. |
| Open with DEXTER |
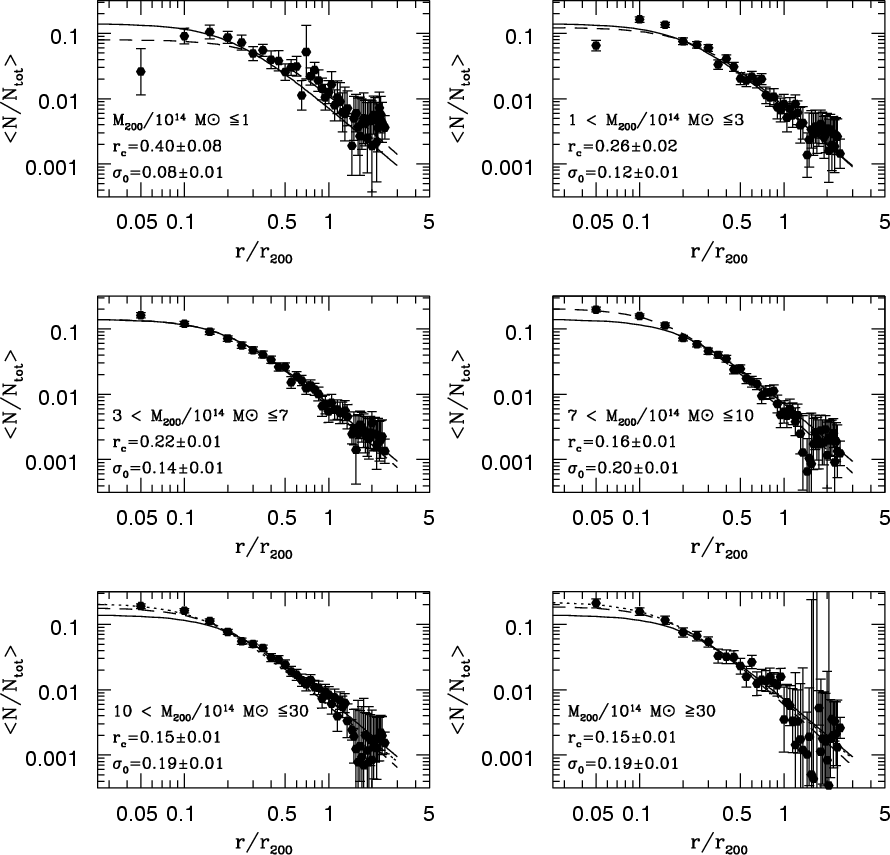
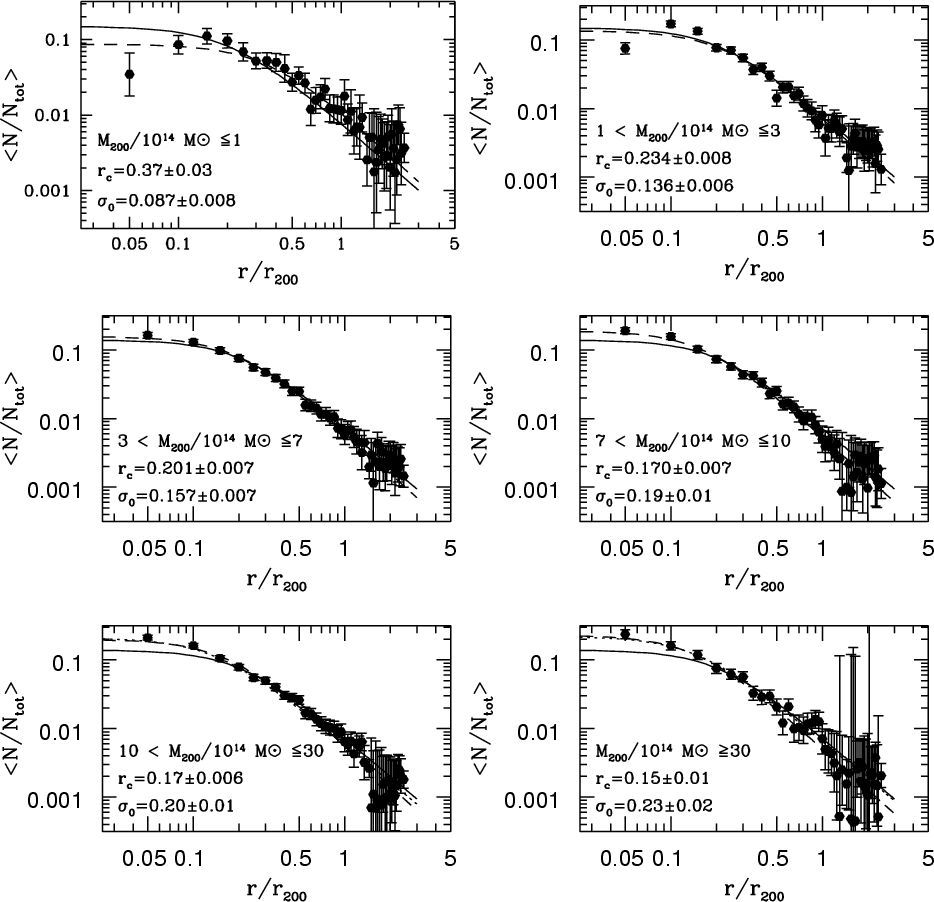
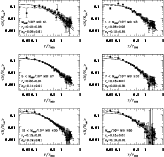 |
Figure 4:
The stacked surface number density profiles of clusters in different
cluster mass bins. The individual cluster profiles are obtained by
considering all the galaxies with
 .
The dashed
curve in each panel is the King profile that provides the best-fit to
the surface density profile shown in that same panel, while the solid
curve is the King profile that provides the best-fit to the mean
stacked surface density profile (same as the solid line in
Fig. 3). The dotted line in the bottom panels (corresponding
to the highest-mass bin clusters) is the best fit provided by a
generalized King profile. .
The dashed
curve in each panel is the King profile that provides the best-fit to
the surface density profile shown in that same panel, while the solid
curve is the King profile that provides the best-fit to the mean
stacked surface density profile (same as the solid line in
Fig. 3). The dotted line in the bottom panels (corresponding
to the highest-mass bin clusters) is the best fit provided by a
generalized King profile. |
| Open with DEXTER |
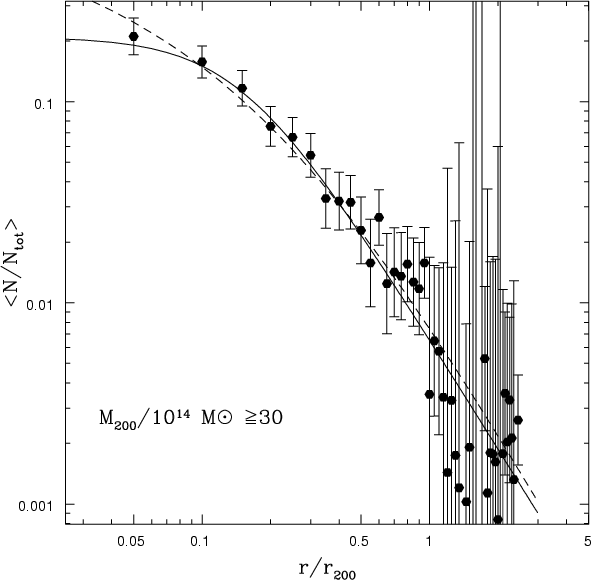
Figure 4 shows the surface density profiles in each cluster
mass bin. The solid line in each plot shows the King profile that
provides the best-fit to the surface density profile of all galaxies
in all clusters, already shown in Fig. 3. The dashed line in
each panel is the best-fit King profile for the surface density
profile of each cluster mass bin. The NFW profiles provide poor fits
for most cluster mass bins, and are not plotted. From
Fig. 4 one can clearly see how the cluster galaxy
distribution changes with cluster mass. The surface density profiles
become steeper near the centre as the cluster mass increases. Note
that the surface number density profile in the low mass bin
(
)
is not completely consistent with
a King profile since it shows a deficit of galaxies near the
center. The core radius is quite large,
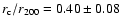 .
The
core radius becomes smaller as the cluster mass increases, and it is
.
The
core radius becomes smaller as the cluster mass increases, and it is
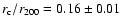 for clusters in the mass interval
.
In the last two mass bins, the
galaxy distributions become so concentrated that the simple King
profile no longer provides a good fit, and a generalized King
profile is needed, of the form:
for clusters in the mass interval
.
In the last two mass bins, the
galaxy distributions become so concentrated that the simple King
profile no longer provides a good fit, and a generalized King
profile is needed, of the form:
 |
(5) |
The dotted lines in the panels of Fig. 4 corresponding to
the highest cluster mass bins, show the best fit given by the
generalized King profile, where
 .
Finally, in the
highest mass bin (
.
Finally, in the
highest mass bin (
 )
the projected NFW
profile also provides a good fit to the galaxy distributions. This is
shown in Fig. 5, where the best-fit generalized King profile
is shown as a solid curve, and the best-fit NFW profile is shown as a
dashed curve. In this case, the best-fit value of the NFW
concentration parameter is
)
the projected NFW
profile also provides a good fit to the galaxy distributions. This is
shown in Fig. 5, where the best-fit generalized King profile
is shown as a solid curve, and the best-fit NFW profile is shown as a
dashed curve. In this case, the best-fit value of the NFW
concentration parameter is
 ,
and is consistent with the
value found for the dark matter distribution in similarly massive
clusters (e.g. Biviano & Girardi 2003; Katgert et al. 2004).
,
and is consistent with the
value found for the dark matter distribution in similarly massive
clusters (e.g. Biviano & Girardi 2003; Katgert et al. 2004).
Lin et al. (2004) perform the same analysis on a smaller sample of 93
X-ray selected clusters observed in the 2 MASS all sky survey. Their
conclusion is that the surface density profile of cluster galaxies is
consistent with a NFW profile with concentration parameter
 .
They study the galaxy distribution in 2 mass bins with
mean mass
.
They study the galaxy distribution in 2 mass bins with
mean mass
 for the groups, and
 ,
for the massive clusters, and
claim that the spatial profiles are consistent with the mean profile
in both mass bins. However, by fitting their data (taken from Fig. 8
of Lin et al. 2004) with both a King, a generalized King, and a NFW
profile, we find that a King profile provides the best fit, in
agreement with our findings.
,
for the massive clusters, and
claim that the spatial profiles are consistent with the mean profile
in both mass bins. However, by fitting their data (taken from Fig. 8
of Lin et al. 2004) with both a King, a generalized King, and a NFW
profile, we find that a King profile provides the best fit, in
agreement with our findings.
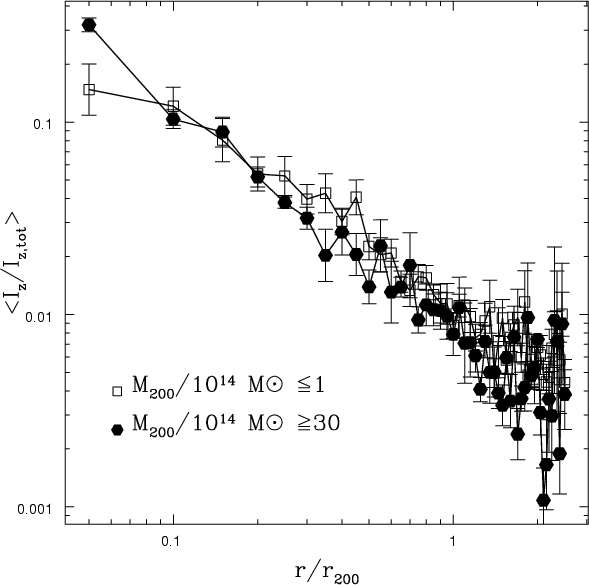
Our results are further supported by the analysis of the surface
brightness profile of our clusters. Figure 6 shows
the composite surface brightness profile of two cluster subsamples:
the low-mass systems with
 and the
high-mass clusters with
and the
high-mass clusters with
 .
The
profile of the low-mass objects displays a core, and is less centrally
concentrated than that of the high-mass clusters which is in fact
rather cuspy. As expected, due to the presence of the Brightest
Cluster Galaxies at the center of the systems, the luminosity profiles
are generally more cuspy than the density profiles in the same cluster
mass bins (Adami et al. 2001).
.
The
profile of the low-mass objects displays a core, and is less centrally
concentrated than that of the high-mass clusters which is in fact
rather cuspy. As expected, due to the presence of the Brightest
Cluster Galaxies at the center of the systems, the luminosity profiles
are generally more cuspy than the density profiles in the same cluster
mass bins (Adami et al. 2001).
In stacking clusters, we have assumed circularity, because the
number of galaxies per cluster is generally too small to allow a
precise determination of individual cluster shapes and orientations.
Adami et al. (1998b) have shown that enforcing circularity could
create a central artificial cusp in the number density profile of the
stacked cluster. However, lower mass clusters are more elongated than
higher mass clusters (see Fasano et al. 1993; de Theije et al. 1995;
Plionis et al. 2004), so the effect of assuming circularity should
lead to more cuspy density profiles for lower mass clusters, which is
opposite to what we find. Indeed, the effect reported by Adami et
al. does not seem to be strong enough to account for the differences
seen in the density profiles of the stacked clusters of different
masses (compare Fig. 4 with Fig. 7 in Adami et al. 1998b).
 |
Figure 5:
The surface number density profile of all the cluster galaxies with
r < -18.5 in the highest of our considered cluster mass
bins. The solid curve is the best fit provided by the generalized King
profile. The dashed curve is the best fit provided by the NFW profile.
Both profiles are consistent with the data. |
| Open with DEXTER |
 |
Figure 6:
Composite surface brightness profile of two cluster samples: the
low mass systems at
(empty squares)
and the massive clusters at
(filled dots). |
| Open with DEXTER |
Hence we conclude that there is a significant variation of the number
density and luminosity density profiles of clusters, as a function of
cluster mass, with higher mass clusters displaying more concentrated
profiles. As a consequence, also the correction needed to convert the
number of galaxies contained in the cylindrical volume to that in the
virial sphere depends on the cluster mass. Using the volume and the
surface density King profile given in Eqs. (2) and (3),
respectively, we estimate that the ratio between the number of
galaxies in the virial sphere of radius r200 and the number of
galaxies actually observed in the cylinder of same radius is
0.69-0.76 for clusters in the lowest-mass bin, 0.78-0.80 for
clusters in the 1-
 mass bin, 0.81 in the
3-
mass bin, 0.81 in the
3-
 mass bin, and 0.85 in the highest mass
bins.
mass bin, and 0.85 in the highest mass
bins.
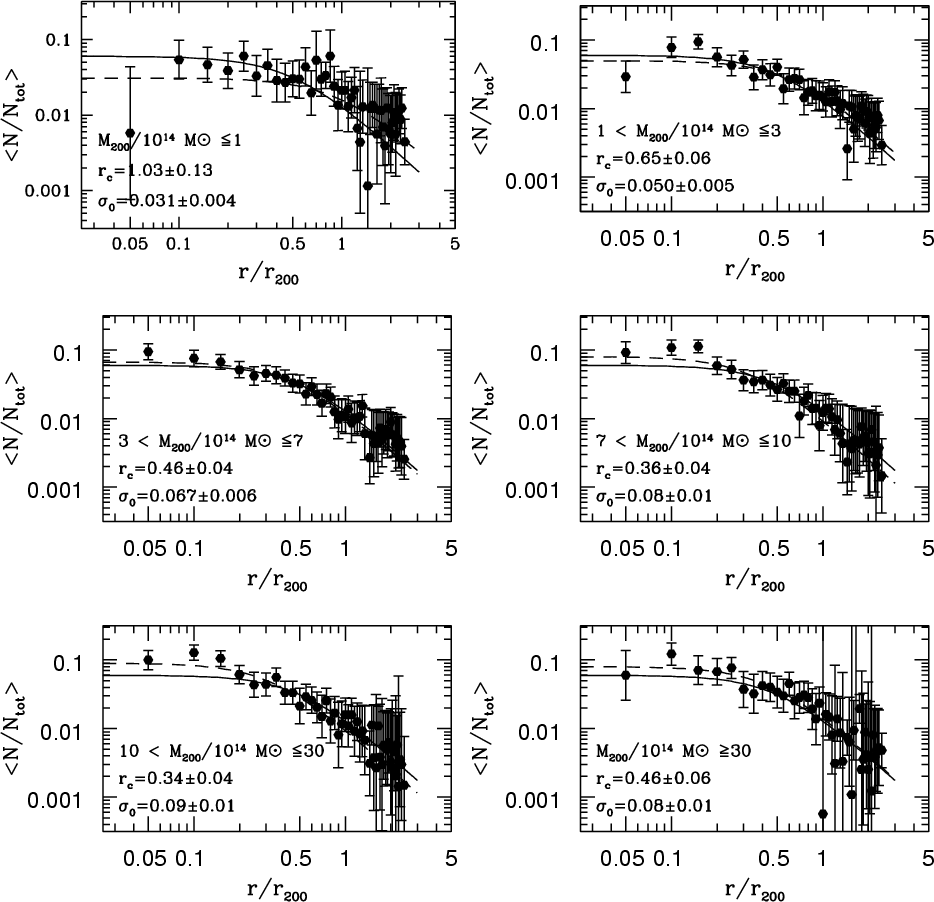
We performed the same analysis separately for the red (early-type) and
blue (late-type) cluster galaxy populations. The colour separation
between the two population is based on the SDSS galaxy color u-r(Strateva et al. 2001; Popesso et al. 2006). For both the red and the
blue galaxy populations, the core radius of the best-fit King profile
monotonically decreases from the low-mass systems to the more massive
clusters (see Figs. 7 and 8).
Since there is a significant mass-dependence of the number density
profiles, a mass-dependent deprojection correction needs to be
applied to the observed values of
.
In the following, we
only consider the deprojection-corrected values of
,
obtained
by adopting the correction factors per mass bin derived above.
4 The
-
M200 and the
-
M200 relations
In Fig. 9 we show the r-band
relation after
correcting
for the projection effects (see
Sect. 3.3). The solid line in the figure is the best-fit
linear regression in logarithmic space, and the dotted line is the
best-fit we would have obtained had
not been corrected for
the projection effects. The best-fit relation for the corrected
is:
 |
(6) |
The slope of this relation is steeper than the slope of the
uncorrected relation, which is
 .
The two values are
anyhow marginally consistent within
.
The two values are
anyhow marginally consistent within  .
As a consequence,
also the M/L-M relation is flatter. The slope of the corrected
relation is
.
As a consequence,
also the M/L-M relation is flatter. The slope of the corrected
relation is
 instead of
 for the uncorrected
relation. Remarkably, we find that the slopes of the best-fit L-Mand M/L-M relations do not depend on the chosen photometric SDSS
band.
for the uncorrected
relation. Remarkably, we find that the slopes of the best-fit L-Mand M/L-M relations do not depend on the chosen photometric SDSS
band.
Due to the strict proportionality observed between the cluster optical
luminosity and the number of cluster galaxies (see Fig. 2),
it is clear that the
relation is strictly connected
to the
relation. In other words, the cluster
mass-to-light ratio M/L is strictly related to the Halo Occupation
Number  of the Halo Occupation Distribution (HOD)
 .
It is then useful to study the cluster M/L in terms of
the HOD since this allows an easier comparison with the predictions of
models of structure formation.
.
It is then useful to study the cluster M/L in terms of
the HOD since this allows an easier comparison with the predictions of
models of structure formation.
We study the HOD with two approaches. First we use the
calculated using the photometric data (
 ), by summing the
background-subtracted cluster number counts used to calculate
.
As a second approach we estimate the number of
spectroscopically-confirmed cluster members (
), by summing the
background-subtracted cluster number counts used to calculate
.
As a second approach we estimate the number of
spectroscopically-confirmed cluster members (
 ). Both
estimates are corrected for projection effects in the same way as we
did for
.
Both
and
are computed down to
the same absolute magnitude, in order to allow comparison of the two
estimates. The SDSS spectroscopic and photometric catalogs have two
different apparent magnitude limits (r= 17.77 for the spectroscopic
catalog and
). Both
estimates are corrected for projection effects in the same way as we
did for
.
Both
and
are computed down to
the same absolute magnitude, in order to allow comparison of the two
estimates. The SDSS spectroscopic and photometric catalogs have two
different apparent magnitude limits (r= 17.77 for the spectroscopic
catalog and  mag for the photometric one). We apply an
absolute magnitude cut of
mag for the photometric one). We apply an
absolute magnitude cut of
 ,
which allows us to sample
the cluster luminosity function (LF hereafter) down to M*+2(Popesso et al. 2005a). With such a cut,
can be measured
for a significant fraction of our cluster sample, those 90 clusters
for which
is brighter than the apparent magnitude limit
of r= 17.77.
,
which allows us to sample
the cluster luminosity function (LF hereafter) down to M*+2(Popesso et al. 2005a). With such a cut,
can be measured
for a significant fraction of our cluster sample, those 90 clusters
for which
is brighter than the apparent magnitude limit
of r= 17.77.
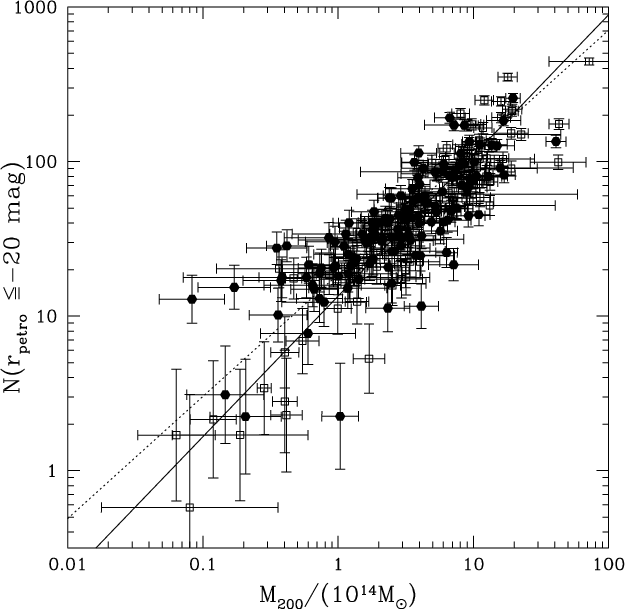
In Fig. 10 we show the
relation, using
 .
We also plot the
best fit relations
.
We also plot the
best fit relations
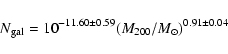 |
(7) |
for
,
and
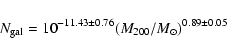 |
(8) |
for
 .
The two estimates of the halo
occupation number
are consistent, while the different
normalizations reflect the incompleteness of the spectroscopic samples
(see Popesso et al. 2006). The orthogonal scatter in both relations
is 35%, and M200 can be predicted from
with an
accuracy of 55%.
.
The two estimates of the halo
occupation number
are consistent, while the different
normalizations reflect the incompleteness of the spectroscopic samples
(see Popesso et al. 2006). The orthogonal scatter in both relations
is 35%, and M200 can be predicted from
with an
accuracy of 55%.
Had we not corrected
for the projection effects, we would
have underestimated the slope for the
relation,
obtaining
 .
Clearly, applying an average, mass
independent, correction to the observed value of
and
leads to underestimate the slope of the considered relations.
.
Clearly, applying an average, mass
independent, correction to the observed value of
and
leads to underestimate the slope of the considered relations.
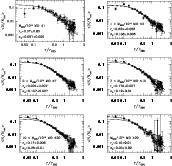 |
Figure 7:
The stacked surface number density profile of
the red cluster galaxies with
magnitude r < -18.5, separately for clusters of different masses.
The meaning of the lines is the same as in Fig. 4. |
| Open with DEXTER |
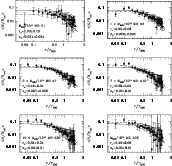 |
Figure 8:
The stacked surface number density profile of
the blue cluster galaxies with
magnitude r < -18.5, separately for clusters of different masses.
The meaning of the lines is the same as in Fig. 4. |
| Open with DEXTER |
 |
Figure 9:
relation. The optical luminosity is
calculated within r200 and is corrected for contamination due to
projection effect. The empty squares in the plot are the X-ray
selected clusters. The filled points are the optically selected
clusters. The solid line in the plot is the best fit line of the
corrected
relation. The dashed line is the best fit
line of the uncorrected
relation. |
| Open with DEXTER |
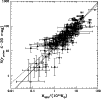 |
Figure 10:
relation. The number of cluster galaxies is
calculated within r200 and is corrected for contamination due to
projection effect. The empty squares in the plot are the X-ray
selected clusters. The filled points are the optically selected
clusters. The solid line in the plot is the best fit line of the
corrected
relation. The dashed line is the best fit
line of the uncorrected
relation. |
| Open with DEXTER |
We check also if different cluster selection techniques introduce
biases in our analysis. For this purpose we perform the same analysis
separately on the optically and X-ray selected cluster samples,
respectively. The observed best fit values are consistent within the
statistical errors. Moreover, we perform the analysis by adopting
different magnitude cuts to check for vatiation of the Halo Occupation
number in different magnitude regimes. We consider the following
magnitude cuts: -20, -17 and -16 mag in the i band. While the
normalization of the relation is obviously changing, the best fit
values of the Halo Occupation number are cosistent within the errors
in all the magniture ranges.
 |
Figure 11:
Relation between the i band Petrosian absolute magnitude and the galaxy
stellar mass. The galaxy stellar masses are taken by Kauffmann et al. (2003). |
| Open with DEXTER |
The Halo Occupation Number
has been measured with several
different methods in the literature. Most of these come from assuming
a form of the HOD, and adjusting the parameters until the prediction
from the halo model matches the observed galaxy clustering
(e.g. Seljak et al. 2004; Peacock & Smith 2000; Yang et al. 2003;
Zehavi et al. 2004; Magliocchetti & Porciani 2003). Pisani et al. (2003) used the velocity dispersion in the groups of the Zwicky
catalog and obtained
 ,
while Marinoni & Hudson
(2002) used the LF of the Nearby Optical Galaxy sample and obtained
,
while Marinoni & Hudson
(2002) used the LF of the Nearby Optical Galaxy sample and obtained
 .
.
Many other works in the literature used an approach similar to ours.
Kochanek et al. (2003) used a sample of clusters identified in the
2MASS all sky survey, and obtained
 on a sample
of 84 clusters. Lin et al. (2004) used a sample of 93 X-ray clusters
observed in 2MASS, and found
on a sample
of 84 clusters. Lin et al. (2004) used a sample of 93 X-ray clusters
observed in 2MASS, and found
 .
Similar results
were obtained by Yang et al. (2005) who used a large sample of groups
identified in the 2-degree Field Galaxy Redshift Survey.
.
Similar results
were obtained by Yang et al. (2005) who used a large sample of groups
identified in the 2-degree Field Galaxy Redshift Survey.
With the exclusion of Kochanek et al. (2003), all other studies agree
on the fact that the exponent in the N-M relation, and consequently
in the L-M relation, is not consistent with unity (see Lin et al.
2004, for a discussion about the discrepancy with the results of
Kochanek et al. 2003). However, with the mass-dependent correction
applied to our clusters to clean the N-M (L-M) relation from
projection effects, the estimated value of
becomes closer to
unity. Nevertheless, a direct proportionality between cluster mass and
number of cluster galaxies is still excluded by our analysis at the
 2-
level.
2-
level.
In this section we investigate whether the lack of galaxies observed
in the high-mass systems is related to a different shape of the LFs of
clusters of different masses. The universality of the cluster LF
has been analysed in two papers of the RASS-SDSS Galaxy Cluster Survey
Series (Popesso et al. 2005a, 2006). When measured
within the cluster virial radius (r200), the shape of the LF does
not change from cluster to cluster both at the faint and at the bright
end (Popesso et al. 2006). Moreover, we observed that the cluster to
cluster variations of the LF found in the literature are due to choice
of a fixed metric apertures for all the systems. This is due to the
fact that fraction of dwarf galaxies in clusters is an increasing
function of the clustercentric distance (see also Durret et al. 2002). To keep under control also the possible dependence between
the shape of the LF and the cluster mass, we divided our cluster
sample (with mass ranges from
to
 )
in three mass bins (
,
)
in three mass bins (
,
 and
and
 ). To increase the
statistics and study the average luminosity distribution of the
galaxies in each mass bin, we have used the SDSS photometric data to
compute a composite luminosity function (LF) by stacking the
individual cluster LFs calculated within r200. The individual LFs
are obtained by subtracting the field number counts calculated within
an annulus around the cluster (0.2 deg with), from the number counts
in the cluster region, as described in Popesso et al. (2005a).
Following previous works, we exclude from the individual cluster LFs
the Brightest Cluster Galaxies (BCGs). The composite LF in each
mass bin is calculated by following the prescriptions of Colless
(1989; see also Popesso et al. 2005a for more details about this
method). We require at least 10 clusters contributing to each
magnitude bin of the composite LF. This requirement is fulfilled at
magnitudes brighter than the absolute magnitude limit
). To increase the
statistics and study the average luminosity distribution of the
galaxies in each mass bin, we have used the SDSS photometric data to
compute a composite luminosity function (LF) by stacking the
individual cluster LFs calculated within r200. The individual LFs
are obtained by subtracting the field number counts calculated within
an annulus around the cluster (0.2 deg with), from the number counts
in the cluster region, as described in Popesso et al. (2005a).
Following previous works, we exclude from the individual cluster LFs
the Brightest Cluster Galaxies (BCGs). The composite LF in each
mass bin is calculated by following the prescriptions of Colless
(1989; see also Popesso et al. 2005a for more details about this
method). We require at least 10 clusters contributing to each
magnitude bin of the composite LF. This requirement is fulfilled at
magnitudes brighter than the absolute magnitude limit
 mag in all the cluster mass bins considered, while 95% of our
clusters have magnitude limits brighter than -18.25 mag in the i
band. Thus, we consider galaxies down to 5.5 mag fainter than the
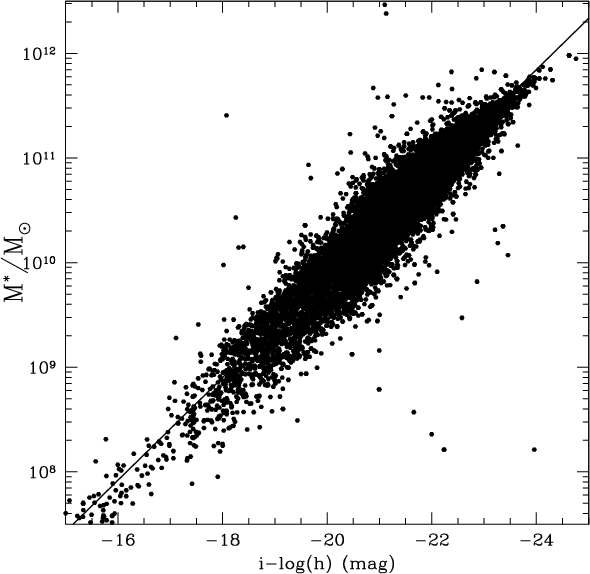
cluster M* in this SDSS band (Popesso et al. 2006). Moreover, we
use the stellar masses estimated by Kauffmann et al. (2003) for the
DR2 spectroscopic sample to evaluate the stellar mass range sampled
within this magnitude limit. As shown in Fig. 11, although the
scatter is large (0.18 dex), the magnitude cut at -16.7 mag
corresponds roughly to a galaxy stellar mass of
mag in all the cluster mass bins considered, while 95% of our
clusters have magnitude limits brighter than -18.25 mag in the i
band. Thus, we consider galaxies down to 5.5 mag fainter than the
cluster M* in this SDSS band (Popesso et al. 2006). Moreover, we
use the stellar masses estimated by Kauffmann et al. (2003) for the
DR2 spectroscopic sample to evaluate the stellar mass range sampled
within this magnitude limit. As shown in Fig. 11, although the
scatter is large (0.18 dex), the magnitude cut at -16.7 mag
corresponds roughly to a galaxy stellar mass of
 .
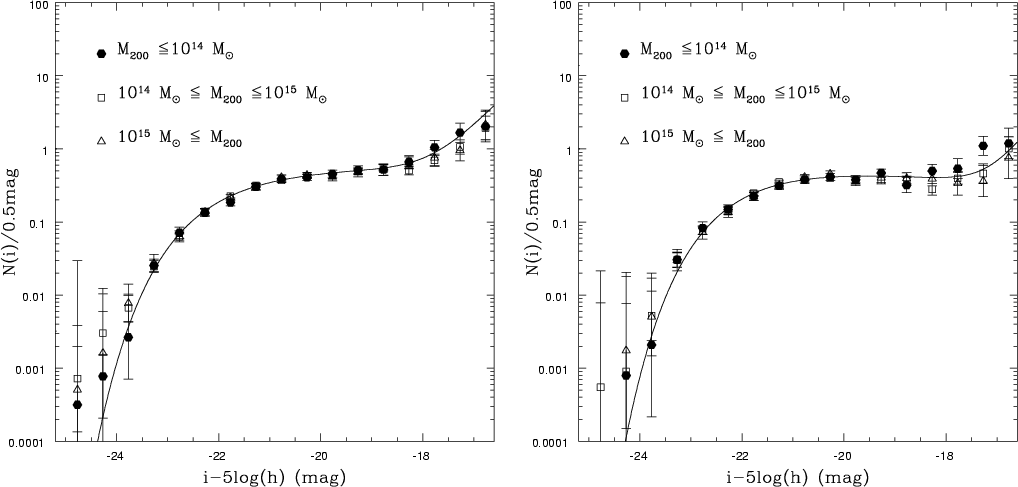
As in Sect. 3.3, we distinguish between early
and late type galaxies using a SDSS color cut at
u-r = 2.22. In
Fig. 12 we show the composite LF for the whole (left panel)
and the red (right panel) cluster galaxies populations. In both panel
the filled points are the low-mass clusters (
), the empty squares the intermediate-mass systems (
)
and the empty triangles are the
high-mass clusters (
). The different
mass-bin LFs are renormalized so as to ease the comparisons among
them. The solid lines in the panels are the best fits obtained in
Popesso et al. (2006) from the X-ray selected RASS-SDSS galaxy
clusters for the corresponding whole and red cluster galaxy
populations. From Fig. 12 it is clear that, at
magnitudes brither than -16.7 mag (alternatively, for galaxy stellar
masses above
), there are no significant differences
among the LFs in the different mass bins. Moreover, the best fit of
the composite LF of the X-ray selected RASS-SDSS sample provides a
very good fit to any of the considered LFs. We conclude that the
cluster LF does not depend on the cluster mass. This conclusion is
consistent with our previous findings (Popesso et al. 2006).
.
As in Sect. 3.3, we distinguish between early
and late type galaxies using a SDSS color cut at
u-r = 2.22. In
Fig. 12 we show the composite LF for the whole (left panel)
and the red (right panel) cluster galaxies populations. In both panel
the filled points are the low-mass clusters (
), the empty squares the intermediate-mass systems (
)
and the empty triangles are the
high-mass clusters (
). The different
mass-bin LFs are renormalized so as to ease the comparisons among
them. The solid lines in the panels are the best fits obtained in
Popesso et al. (2006) from the X-ray selected RASS-SDSS galaxy
clusters for the corresponding whole and red cluster galaxy
populations. From Fig. 12 it is clear that, at
magnitudes brither than -16.7 mag (alternatively, for galaxy stellar
masses above
), there are no significant differences
among the LFs in the different mass bins. Moreover, the best fit of
the composite LF of the X-ray selected RASS-SDSS sample provides a
very good fit to any of the considered LFs. We conclude that the
cluster LF does not depend on the cluster mass. This conclusion is
consistent with our previous findings (Popesso et al. 2006).
 |
Figure 12:
The composite LF for the whole ( left panel) and the red
( right panel) cluster galaxy populations. In both panels the filled
points are the low-mass clusters (
),
the empty squares the intermediate-mass systems (
 )
and the empty triangles are the
high-mass clusters ( )
and the empty triangles are the
high-mass clusters (
 ). The different
mass-bin LFs are renormalized so as to ease the comparisons among
them. The solid lines in the panels are the best fits obtained in
Popesso et al. (2006) from the X-ray selected RASS-SDSS galaxy
clusters for the corresponding whole and red cluster galaxy
populations. ). The different
mass-bin LFs are renormalized so as to ease the comparisons among
them. The solid lines in the panels are the best fits obtained in
Popesso et al. (2006) from the X-ray selected RASS-SDSS galaxy
clusters for the corresponding whole and red cluster galaxy
populations. |
| Open with DEXTER |
The previous analysis is based on LFs with the BCGs excluded. Here we
examine to what extent can the BCG luminosities be considered the
high-end tail extension of the overall cluster LFs. This has been
shown not to be the case by previous investigations
(e.g. Schechter 1976; Bhavsar & Barrow 1985). The Schechter function
was generally found to provide a good fit to the observed galaxy
magnitude distribution as long as the very brightest galaxies, the cD
galaxies, were excluded from the fit (Schechter 1976). The exceptional
luminosities of these galaxies have often been interpreted as arising
from special processes that are not common to all galaxies, and are
particularly effective at the bottom of cluster potential wells.
Nevertheless, Lugger (1986) did not find significantly different
best-fits to the observed cluster galaxy LFs using Schechter
functions, when BCGs were or were not included in the sample.
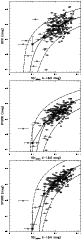 |
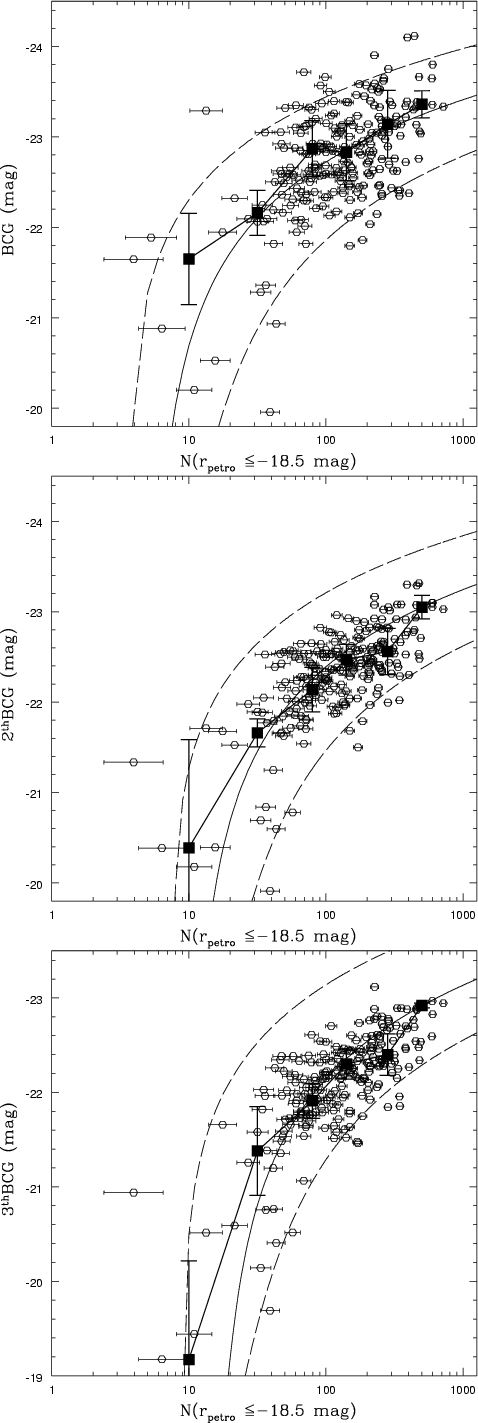
Figure 13:
Upper panel: the magnitude of the BCGs (empty squares) within
r200 as a function of the number of cluster galaxies within the
same radius, and with
 mag. The solid line in the plot
shows the expected BCG magnitude as estimated from the best-fitting
composite LF, as a function of the cluster normalization. The dashed
lines are the statistical uncertainties in the relation represented by
the solid line. The filled squares are the median magnitudes per bin
of
.
Middle panel: same as the left panel, but for the
second brightest cluster galaxies. Bottom panel: same as the left
panel, but for the third brightest cluster galaxies.
mag. The solid line in the plot
shows the expected BCG magnitude as estimated from the best-fitting
composite LF, as a function of the cluster normalization. The dashed
lines are the statistical uncertainties in the relation represented by
the solid line. The filled squares are the median magnitudes per bin
of
.
Middle panel: same as the left panel, but for the
second brightest cluster galaxies. Bottom panel: same as the left
panel, but for the third brightest cluster galaxies. |
| Open with DEXTER |
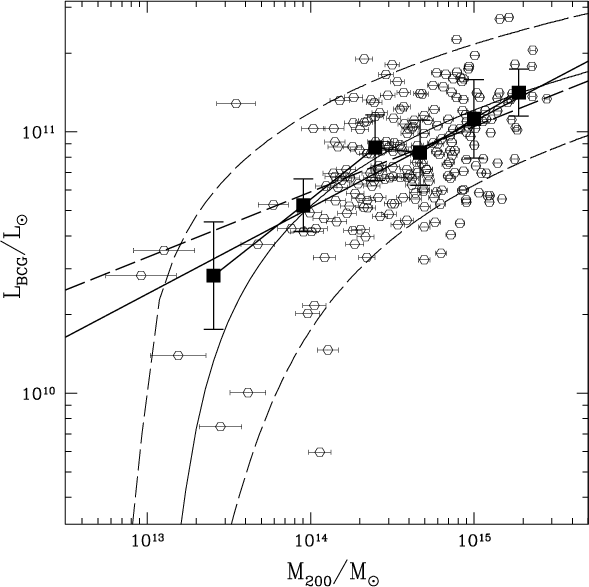
 |
Figure 14:
The relation between BCG luminosity and cluster mass for our
cluster sample. Cluster masses are computed from
s using our
derived HOD. The solid line in the plot is the best-fit line obtained
with an orthogonal linear regression,
 ,
and the dashed line is Lin & Mohr's (2004)
relation. Other symbols have the same meaning as in the
Fig. 13. ,
and the dashed line is Lin & Mohr's (2004)
relation. Other symbols have the same meaning as in the
Fig. 13. |
| Open with DEXTER |
Following Colless (1989), we normalize the cluster LFs to the number of
cluster galaxies in a common magnitude region (
mag in
the present case, see Popesso et al. 2005a for details). Given the
number of cluster galaxies in that magnitude region and the best-fit
Schechter function of the composite LF, it is possible to calculate
the magnitude Mr of the nth brightest cluster member as the
magnitude corresponding to N(Mr)=n, where N(Mr) is the
analytical form of the cluster integral LF. For this we use the
best-fit obtained with a composite of two Schechter functions, after
excluding the BCGs.
The left panel of Fig. 13 shows the magnitude of the brightest
spectroscopically-confirmed cluster members within r200, as a
function of the number of cluster galaxies within r200 and with
mag. The solid line shows the expected magnitude of the
brightest galaxies, as estimated from the best-fit LF, vs. the cluster
normalization. The dashed line are the statistical uncertainties in
the location of the brightest cluster member. Clearly, the estimated
magnitudes of the 1st ranked galaxies are consistent with the
observed values, as can be judged by considering the median of the
1st-ranked galaxy magnitudes per
bin (filled squares in
the plot), and by the fact that 95% of the BCGs lie within the
statistical uncertainties of the expected relation. The middle and the
right panel of Fig. 13 are similar to the left panel, but for
the 2nd and 3rd brightest cluster galaxies respectively.
Again, the agreement between the expected and observed magnitudes is
extremely good, and the similarity of these three plots argues
against the BCG magnitudes being an anomaly of the cluster LF.
The reason why our result disagrees with previous findings (Postman &
Lauer 1995) must be related to the use of a double (instead of a
single) Schechter function for the fit of the observed LF, which
allows a better representation of the LF bright end. This was first
pointed out by Biviano et al. (1995) in their study of the Coma
cluster LF (see also Thompson & Gregory 1993). The deviation of
the cluster LF from a single Schecter function was also found in the
clusters extracted from the N-body simulations combined with
semi-analytical models analysed by Diaferio et al. (1999). They
interpreted the LF shape as the effect of the large merger
cross-section of the bright and massive central galaxies.
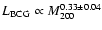
Our result is in agreement with the recent findings of Lin & Mohr
(2004) and Yang et al. (2005) of a tight correlation between the BCG
luminosity and the cluster mass. In particular, in the mass range
 ,
,
 .
The excellent agreement between Lin & Mohr's
result and ours is demonstrated in Fig. 14. There we show the
relation between the BCG luminosity and the cluster mass of our
cluster sample, where we transformed the cluster
into
cluster masses using the HOD we derived in Sect. 4. The
solid line in the plot is the best-fit obtained with an orthogonal
linear regression,
,
and it is
in excellent agreement with the Lin & Mohr (2004) relation (the
dashed line in the plot).
.
The excellent agreement between Lin & Mohr's
result and ours is demonstrated in Fig. 14. There we show the
relation between the BCG luminosity and the cluster mass of our
cluster sample, where we transformed the cluster
into
cluster masses using the HOD we derived in Sect. 4. The
solid line in the plot is the best-fit obtained with an orthogonal
linear regression,
,
and it is
in excellent agreement with the Lin & Mohr (2004) relation (the
dashed line in the plot).
The elliptical galaxies are the dominant population in clusters and
therefore any variation of their mass-to-light ratio as a function of
the cluster mass could contribute to affecting the slope of the N-Mand the L-M relations. Thus, one could still have a constant ratio
between the total cluster mass and the total mass in galaxies, even
for
 (see Sect. 4), if galaxies of given
luminosity have higher masses in higher-mass clusters.
(see Sect. 4), if galaxies of given
luminosity have higher masses in higher-mass clusters.
To investigate whether elliptical galaxies in high mass clusters have
a higher average M/L than their counterparts in low mass systems, we
determine the fundamental plane (FP hereafter) of ellipticals as
traced by the spectroscopic members of each cluster within
r200. The FP relates the effective radius of the luminosity
distribution of ellipticals,  ,
with their internal velocity
dispersion,
,
with their internal velocity
dispersion,  ,
and their surface brightness (Djorgovsky &
Davis 1987). If the virial radius of ellipticals is linearly
proportional to
and their internal velocity dispersion to
the virial value, the FP effectively can be used to constrain
the mass-to-light ratio of elliptical galaxies.
,
and their surface brightness (Djorgovsky &
Davis 1987). If the virial radius of ellipticals is linearly
proportional to
and their internal velocity dispersion to
the virial value, the FP effectively can be used to constrain
the mass-to-light ratio of elliptical galaxies.
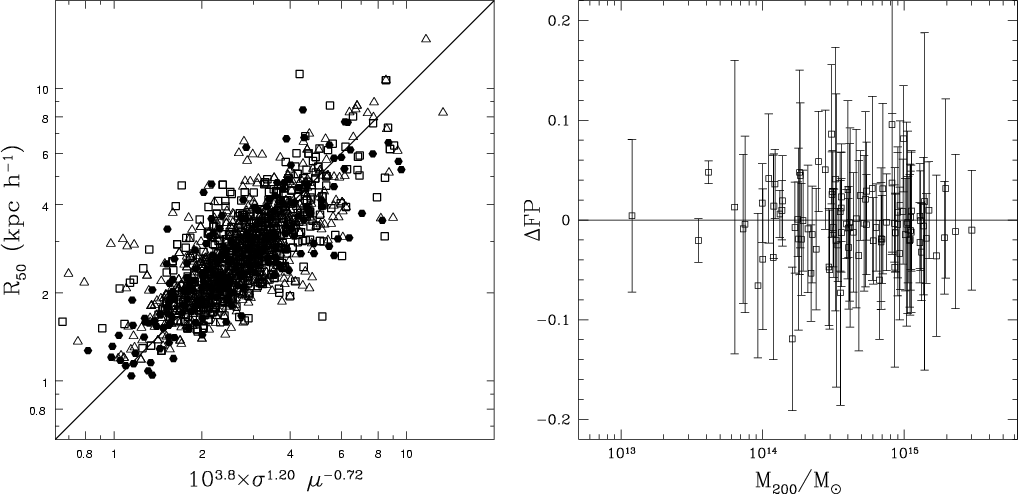
For this analysis, as before, we have divided our cluster sample in
three subsamples of low-, intermediate-, and high-mass. Ellipticals
are identified within each cluster using the selection criteria of
Bernardi et al. (2003a). As a measure of the effective radius we use
the Petrosian radius r50, which encloses 50% of the total
Petrosian luminosity, multiplied by the square root of the ratio b/aof the lengths of the minor and major axes of the observed surface
brightness profile. The SDSS spectroscopic catalog contains a measure
of the line of sight velocity dispersion which has been corrected for
aperture effects as in Bernardi et al. (2003a). In what follows, we
show the best correlation between the variables ,
and
![$\mu=-2.5 \log[(L/2)/r_{\rm e}^2]$](/articles/aa/full/2007/11/aa4708-05/img118.gif) in the SDSS r-band. Data are fitted with
the ODRPACK routine (Akritas
in the SDSS r-band. Data are fitted with
the ODRPACK routine (Akritas  Bershady 1996).
The left-hand side panel of Fig. 15 shows the best-fit FP
relating the three variables ,
and  ;
our result is
consistent with Bernardi et al. (2003b). The different symbols in
the plot indicate elliptical galaxies of clusters in different mass
bins. We do not find any variation of the best-fit FP for
the different mass samples. In the right panel of the same figure we
show the mean residuals from the FP of the elliptical populations of
individual clusters as a function of the cluster masses. The scatter
around the FP is 10% as in Bernardi et al. (2003b) and the
mean residual is consistent with zero independent of the cluster mass.
;
our result is
consistent with Bernardi et al. (2003b). The different symbols in
the plot indicate elliptical galaxies of clusters in different mass
bins. We do not find any variation of the best-fit FP for
the different mass samples. In the right panel of the same figure we
show the mean residuals from the FP of the elliptical populations of
individual clusters as a function of the cluster masses. The scatter
around the FP is 10% as in Bernardi et al. (2003b) and the
mean residual is consistent with zero independent of the cluster mass.
Any variation of the average mass-to-light ratio of the ellipticals
would result in a variation of their FP. The constancy of the FP
across the cluster mass range therfore implies a constant
mass-to-light ratio of the cluster ellipticals.
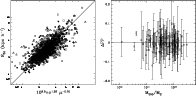 |
Figure 15:
Left panel: the best-fit FP of cluster ellipticals,
relating their internal velocity dispersions
(), effective radii (), and surface brightnesses
within
(). The different symbols in the plot indicate
elliptical galaxies of clusters in different mass bins. The
right-hand side panel shows the mean residuals from the global FP
of the elliptical populations of individual clusters as a
function of the cluster mass. |
| Open with DEXTER |
Using a large sample of galaxy clusters we have shown that the number
of galaxies per unit mass is lower in clusters of higher masses,
i.e. the slope of the relation
is
at the 2.5
level. Our result is thus in agreement with
previous findings (see, e.g., Lin et al. 2004, and references therein)
although we find a somewhat steeper N-M relation (
closer to
unity), because of our mass-dependent correction for projection
effects.
From the theoretical point of view,
is expected. On one
hand, hierarchical models of structure formation predict a universal
mass distributions of the subhalos (see, e.g., De Lucia et al. 2004;
and Gao et al. 2004), independent of the mass of the parent halo. As
a consequence, the number of subhalos is directly proportional to the
parent halo mass (
 ). On the other hand, including baryons
in the simulations leads to a decreasing number of galaxies per given
mass in halos of higher masses (i.e.
,
see, e.g.,
Benson et al. 2000a,b; White et al. 2001; Berlind et al. 2003),
and of an increasing M/L as a function of mass (e.g. Kauffmann
et al. 1999). This could happen as the consequence of a decreasing
efficiency of gas cooling and star formation (see, e.g.,
Springel &
Hernquist 2003; Berlind et al. 2003; Borgani et al. 2004; Kravtsov et al. 2004), or because of an increased merger rate (White et al. 2001),
or of an increased destruction rate of galaxies (Lin et al. 2003), as
the mass of the parent halo increases.
). On the other hand, including baryons
in the simulations leads to a decreasing number of galaxies per given
mass in halos of higher masses (i.e.
,
see, e.g.,
Benson et al. 2000a,b; White et al. 2001; Berlind et al. 2003),
and of an increasing M/L as a function of mass (e.g. Kauffmann
et al. 1999). This could happen as the consequence of a decreasing
efficiency of gas cooling and star formation (see, e.g.,
Springel &
Hernquist 2003; Berlind et al. 2003; Borgani et al. 2004; Kravtsov et al. 2004), or because of an increased merger rate (White et al. 2001),
or of an increased destruction rate of galaxies (Lin et al. 2003), as
the mass of the parent halo increases.
Although we observe
as predicted, a deeper look at other
properties of our clusters seems to be at odds with theoretical
predictions. If mergers and/or tidal effects are responsible for
reducing the number of galaxies per given mass in clusters of higher
masses, we expect to see these processes to leave an imprint into the
cluster LFs. Instead, we find that the LF is universal, with no
dependence on the cluster mass. Our result is at odds with Lin et al. (2004). The reason for this difference is unclear, but it could
be related to the different photometric bands (Lin et al. use the
K-band), although it is difficult to see why the LFs of clusters of
different masses should look identical in four SDSS photometric bands
and different in the K-band.
Another result argues against galaxy-destruction via tidal stripping
being more efficient in higher mass clusters. Higher mass clusters are
characterized by a more concentrated number density profile (see
Sect. 3.3) and a less concentrated mass density profile
(NFW, Katgert et al. 2004; Pratt & Arnaud 2005) near the centre. If
anything, this is consistent with a picture where galaxies are more
likely to survive near the centre of higher mass clusters, while
galaxies in lower-mass clusters are destroyed when crossing the
cluster core, because of the efficient tidal stripping resulting from
a more concentrated halo mass profile.
A lower efficiency of star formation in galaxies of higher mass
clusters would also lead to observing
in the HOD. A
consequence of this process should be visible in a decreased M/L for
the galaxies of higher mass clusters, as compared to the galaxies of
lower mass clusters. We have explored this possibility by the analysis
of the FP of cluster ellipticals. No evidence for a variation of the
FP as a function of cluster mass was found. This result argues for a
constant M/L and hence a similar star formation efficiency of
cluster ellipticals in clusters of different masses, in agreement
with the predictions of Diaferio et al. (2001), based on numerical
simulations combined with semi-analytical models of galaxy formation.
Note, however, that Springel et al. (2001) have argued that even
heavily stripped cluster galaxies obey the Faber-Jackson relation,
since the internal velocity dispersion of a stripped subhalo remains
relatively stable until it is fully disrupted. Hence the constancy of
the FP does not rule out the possibility of subhalos stripping.
Bahcall & Comerford (2002) have suggested that the observed
increasing M/L of clusters as a function of cluster masses is a
consequence of a higher fraction of galaxies with evolved stellar
populations in higher mass clusters. There is no evidence for this in
our data (Popesso et al. 2005e). Moreover,
Bahcall & Comerford's
prediction that M/L vs. M would become flatter when the
photometric band is moved to longer wavelengths, is also ruled out by
our data, where we see that the relation does not change by changing
the SDSS photometric band, in agreement with the results of numerical
simulations combined with semi-analytical modelling (Kauffmann et al.
1999).
How can we, then, reconcile the observed N-M with the predictions for
a universal subhalo mass distribution? It is hard to find physical
processes capable of reducing the number of observed galaxies per
given mass, while at the same time leaving the subhalo mass
distribution, the galaxy LF, and the average galaxy mass-to-light
ratios unchanged. Hence, the most likely explanation is that the mass
distribution of the subhalos is not universal and the observed
for galaxies simply reflect an underlying
for
subhalos.
Our correction for projection effects does work in the sense of
changing the observed
of the
closer to
unity. The resulting
is still found to be below unity, but
the significance of this is not overwhelming (2.5level). Hence it is well possible that other insofar unapplied
corrections, or, perhaps, an improved correction for the projection
effects, could make
consistent with unity, thus reconciling
theory and observations.
We have studied the L-M and the N-M relations in the 4 SDSS bands
g, r, i, z for a sample of 217 galaxy clusters with confirmed 3D
overdensity in the SDSS DR3 spectroscopic catalog. All the quantities
are measured within the characteristic cluster radius r200. We
have remarked upon the direct connection between the two relations due
to the proportionality of the cluster optical luminosity and the
number of cluster galaxies.
We have studied the galaxy surface number density profile in five bins
of cluster mass and discovered that the profile has a strong
dependence on the cluster mass. In the low and intermediate mass
systems the best fit is provided by a King profile. The core radius of
the best fit decreases as a function of the cluster mass, while the
central galaxy density increases. In the highest mass bins a more
concentrated generalized King profile or a cuspy NFW profile provide
the best fits. Using the best fit profile in each mass bin, we have
converted the observed number of cluster galaxies to the value within
the virial sphere. Since clusters of different masses exhibit
different surface density profiles, the deprojection correction
decreases with the cluster mass. Applying this mass-dependent
correction affects the L-M and N-M relations, by increasing the
slope of these relations to the value of
.
Similarly, the
slope of the M/L-M relation also is affected and becomes
.
Hence, neglecting the dependence of the deprojection
correction on the cluster mass leads one to underestimate the slope
of the
and
relations. Despite the
deprojection correction, the derived N-M and the L-M relations are
still only marginally consistent with unity, at the 2.5
level,
i.e. direct proportionality between cluster mass and number of cluster
galaxies is not supported.
We have compared the properties of our clusters with the prediction of
the hierarchical models of structure formation. These models naturally
predict that
with
.
This result is
generally interpreted as an indication that the galaxies in the low
mass systems are older and more luminous per unit mass than the
galaxies in high mass clusters. As a consequence, variations of the
shape of the cluster LF and of the elliptical FP with the cluster mass
are also expected. Such predicted variations are however not seen in
our data. Not only we have found the LF to be the same for clusters of
different masses, but we also proved that this universal LF can be
used to accurately predict the magnitudes of the three brightest
cluster galaxies, given the LF-normalization of the clusters in which
they are located. In other words, the BCG magnitudes are consistent
with being drawn from the best-fit magnitude distribution of other
cluster galaxies. Moreover we have shown that the FP of cluster
ellipticals has the same slope in all the clusters and does not depend
on the cluster mass.
From the observational point of view, the mean cluster luminosity
function and the N-M or the L-M relation determine completely the
luminosity distribution of cluster galaxies. The mean cluster LF
constrains with high accuracy the shape of the luminosity distribution
in clusters, while the N-M relation, calculated in a given magnitude
range, fixes the normalization of the LF as a function of the cluster
mass. Forthcoming cosmological models of galaxy formation should aim
at reproducing this characteristic of the cluster galaxy population,
in order to understand the processes of galaxy formation and evolution
in the cluster enviroment.
Acknowledgements
We thank the referee, Christophe Adami, for the useful comments which
helped in improving the paper. We acknowledge useful discussions with
Stefano Borgani and Simon White. Funding for the creation and
distribution of the SDSS Archive has been provided by the Alfred
P. Sloan Foundation, the Participating Institutions, the National
Aeronautics and Space Administration, the National Science Foundation,
the US Despartment of Energy, the Japanese Monbukagakusho, and the
Max Planck Society. The SDSS Web site is http://www.sdss.org/. The
SDSS is managed by the Astrophysical Research Consortium (ARC) for the
Participating Institutions. The Participating Institutions are The
University of Chicago, Fermilab, the Institute for Advanced Study, the
Japan Participation Group, The Johns Hopkins University, Los Alamos
National Laboratory, the Max-Planck-Institute for Astronomy (MPIA),
the Max-Planck-Institute for Astrophysics (MPA), New Mexico State
University, University of Pittsburgh, Princeton University, the United
States Naval Observatory, and the University of Washington.
-
Abazajian, K., Adelman, J., Agueros, M., et al. 2003, AJ, 126, 2081 [NASA ADS] [CrossRef]
(Data Release One)
(In the text)
- Adami, C.,
Mazure, A., Biviano A., Katgert, P., & Rhee, G. 1998a, A&A,
331, 493 [NASA ADS] (In the text)
- Adami, C.,
Mazure, A., Katgert, P., & Biviano A. 1998b, A&A, 336,
63 [NASA ADS] (In the text)
- Adami, C.,
Mazure, A., Ulmer, M. P., Savine, C. 2001, A&A, 371, 11 [NASA ADS] [CrossRef] [EDP Sciences] (In the text)
- Akritas, M.
G., & Bershady, M. A. 1996, ApJ, 470, 706 [NASA ADS] [CrossRef] (In the text)
- Bahcall, N.
A., & Comerford, J. M. 2002, ApJ, 565, L5 [NASA ADS] [CrossRef] (In the text)
-
Bartelmann, M. 1996, A&A, 313, 697 [NASA ADS] (In the text)
- Beers, T. C.,
Flynn, K., & Gebhardt 1990, AJ, 100, 32 [NASA ADS] [CrossRef] (In the text)
- Benson, A.
J., Baugh, C. M., Cole, S., Frenk, C. S., & Lacey, C. G. 2000a,
MNRAS, 316, 107 [NASA ADS] (In the text)
- Benson, A.
J., Cole, S., Frenk, C. S., Baugh, C. M., & Lacey, C. G. 2000b,
MNRAS, 311, 793 [NASA ADS]
- Berlind, A.
A., & Weinberg, D. H. 2002, ApJ, 575, 587 [NASA ADS] [CrossRef] (In the text)
- Berlind, A.
A., Weinberg, D. H., Benson, A. J., et al. 2003, ApJ, 593, 1 [NASA ADS] [CrossRef] (In the text)
- Bernardi,
M., Sheth, R. K., Annis, J., et al. 2003a, AJ, 125, 1817 [NASA ADS] [CrossRef] (In the text)
- Bernardi,
M., Sheth, R. K., Annis, J., et al. 2003b, AJ, 125, 1866 [NASA ADS] [CrossRef] (In the text)
- Bhavsar S.
P., & Barrow, J. D 1985, MNRAS, 213, 857 [NASA ADS] (In the text)
- Biviano A.,
Durret F., Gerbal D., et al. 1995, A&A, 297, 610 [NASA ADS] (In the text)
- Biviano, A.,
& Girardi, M. 2003, ApJ, 585, 205 [NASA ADS] [CrossRef] (In the text)
- Blanton, M.
R., Lupton, R. H., Maley, F. M., et al. 2003, AJ, 125, 2276 [NASA ADS] [CrossRef] (Tiling
Algorithm)
(In the text)
- Borgani, S.,
Murante, G., Springel, V., et al. 2004, MNRAS, 348, 1078 [NASA ADS] (In the text)
- Carlberg,
R. G., Yee, H. K., & Ellingson, E. 1997, ApJ, 478, 462 [NASA ADS] [CrossRef] (In the text)
- Colless, M.
1989, MNRAS, 237, 799 [NASA ADS] (In the text)
- De Lucia, G.,
Kauffmann, G., Springel, V., et al. 2004, MNRAS, 348, 333 [NASA ADS] (In the text)
- de Theije,
P. A. M., Katgert, P., & van Kampen, E. 1995, MNRAS, 273,
30 [NASA ADS] (In the text)
- Diaferio,
A., Kauffmann, G., Balogh, M. L., et al. 2001, MNRAS, 323, 999 [NASA ADS] (In the text)
- Diaferio,
A., Kauffmann, G., Colberg, J. M., & White, S. D. M. 1999,
MNRAS, 307, 537 [NASA ADS] (In the text)
- Dolag, K.,
Bartelmann, M., Perrotta, F., et al. 2004, A&A, 416, 853 [NASA ADS] [CrossRef] [EDP Sciences] (In the text)
-
Djorgovski S., & Davis M. 1987, ApJ, 313, 59 [NASA ADS] [CrossRef]
- Durret, F.,
Adami, C., & Lobo, C. 2002, A&A, 393, 439 [NASA ADS] [CrossRef] [EDP Sciences] (In the text)
-
Eisenstein, D. J., Annis, J., Gunn, J. E., et al. 2001, AJ, 122,
2267 [NASA ADS] [CrossRef] (In the text)
- Fasano, G.,
Pisani, A., Vio, R., & Girardi, M. 1993, ApJ, 416, 546 [NASA ADS] [CrossRef] (In the text)
- Fukugita,
M., Ichikawa, T., & Gunn, J. E. 1996, AJ, 111, 1748 [NASA ADS] [CrossRef] (In the text)
- Gao, L., White, S. D.
M., Jenkins, A., et al. 2004, MNRAS, 355, 819 [NASA ADS] (In the text)
- Girardi, M.,
Biviano, A., Giuricin, G., et al. 1995, ApJ, 438, 527 [NASA ADS] [CrossRef] (In the text)
- Girardi, M.,
Giuricin, G., Mardirossian F., et al. 1998, ApJ, 505, 74 [NASA ADS] [CrossRef] (In the text)
- Girardi, M.,
Manzato, P., Mezzetti, M., et al. 2002, ApJ, 569, 720 [NASA ADS] [CrossRef] (In the text)
- Gunn, J. E., Carr,
M. A., Rockosi, C. M., et al 1998, AJ, 116, 3040 [NASA ADS] [CrossRef] (SDSS Camera)
(In the text)
- Hogg, D. W.,
Finkbeiner, D. P., Schlegel, D. J., & Gunn, J. E. 2001, AJ,
122, 2129 [NASA ADS] [CrossRef] (In the text)
- Katgert, P.,
Biviano, A., & Mazure, A. 2004, ApJ, 600, 657 [NASA ADS] [CrossRef] (In the text)
-
Kauffmann, G., Nusser, A., & Steinmetz, M. 1997, MNRAS, 286,
795 [NASA ADS] (In the text)
-
Kauffmann, G., Colberg, J. M., Diaferio, A., & White, Simon D.
M. 1999, MNRAS, 303, 188 [NASA ADS] (In the text)
-
Kauffmann, G., Heckman, T. M., White, S. D. M., et al. 2003, MNRAS,
341, 33 [NASA ADS] (In the text)
- King, I. 1962, AJ,
67, 274 [NASA ADS] [CrossRef] (In the text)
- Kochanek,
C. S., White, M., Huchra, J., et al. 2003, ApJ, 585, 161 [NASA ADS] [CrossRef] (In the text)
- Kravtsov,
A. V., Berlind, A. A., Wechsler, R. H., et al. 2004, ApJ, 609,
35 [NASA ADS] [CrossRef] (In the text)
- Lin, Y.-T., Mohr, J.
J., & Stanford, S. A. 2003, ApJ, 591, 749 [NASA ADS] [CrossRef] (In the text)
- Lin Y. T., & Mohr
J. J. 2004, ApJ, 617, 879 [NASA ADS] [CrossRef] (In the text)
- Lin Y. T., Mohr J.
J., & Stanford, S. A. 2004, ApJ, 610, 745 [NASA ADS] [CrossRef]
- Lugger, P. M.
1986, ApJ, 303, 535 [NASA ADS] [CrossRef] (In the text)
- Lupton, R. H.,
Gunn, J. E., & Szalay, A. S. 1999, AJ, 118, 1406 [NASA ADS] [CrossRef] (In the text)
- Lupton, R.,
Gunn, J. E., Ivezic, Z., et al. 2001, in Astronomical Data Analysis
Software and Systems X, ed. F. R. Harnden, Jr., F. A. Primini,
& H. E. Payne (San Francisco: Astr. Soc. Pac.), ASP Conf. Ser.,
238, 269 [arXiv:astro-ph/0101420]
(In the text)
- Ma, C., & Fry, J.
N. 2000, ApJ, 538, L107 [NASA ADS] [CrossRef] (In the text)
-
Magliocchetti, M., & Porciani, C. 2003, MNRAS, 346, 186 [NASA ADS] (In the text)
- Marinoni,
C., & Hudson, M. J 2002, ApJ, 569, 101 [NASA ADS] [CrossRef] (In the text)
- Navarro, J.
F., Frenk, C. S., & White, S. D. M. 1996, ApJ, 462, 563 [NASA ADS] [CrossRef] (In the text)
- Navarro, J.
F., Frenk, C. S., & White, S. D. M. 1997, ApJ, 490, 493 [NASA ADS] [CrossRef] (In the text)
- Oort, J H 1958, in
La structure et l'évolution de l'univers, ed. R. Stoopes
(Brussels: Solvay Inst), 163
(In the text)
- Peacock, J.
A., & Smith, R. E. 2000, MNRAS, 318, 1144 [NASA ADS] (In the text)
- Pisani, A.,
Ramella, M., & Geller, M. J. 2003, AJ, 126, 1677 [NASA ADS] [CrossRef] (In the text)
- Plionis, M.,
Basilakos, S., & Tovmassian, H. M. 2004, MNRAS, 352, 1323 [NASA ADS] (In the text)
- Popesso, P.,
Böhringer, H., Brinkmann J., et al. 2004, A&A, 423, 449 [NASA ADS] [CrossRef] [EDP Sciences]
(Paper I)
(In the text)
- Popesso,
P., Biviano, A., Böhringer, H., et al. 2005a, A&A, 433,
415 [NASA ADS] [CrossRef] [EDP Sciences] (Paper II)
(In the text)
- Popesso,
P., Biviano, A., Böhringer, H., & Romaniello, M. 2005b,
A&A, 433, 431 [NASA ADS] [CrossRef] [EDP Sciences] (Paper III)
(In the text)
- Popesso, P.,
Biviano, A., Böhringer, H., & Romaniello, M. 2006,
A&A, 445, 29 [NASA ADS] [CrossRef] [EDP Sciences] (Paper IV)
(In the text)
- Popesso,
P., Biviano, A., Böhringer, H., & Romaniello, M. 2007,
A&A, 461, 397 [NASA ADS] [CrossRef] [EDP Sciences] (Paper V)
(In the text)
- Postman M.,
& T. Lauer 1995, ApJ, 440, 28 [NASA ADS] [CrossRef] (In the text)
- Pratt G. W.,
& Arnaud M. 2005, A&A, 429, 791 [NASA ADS] [CrossRef] [EDP Sciences] (In the text)
- Rines, K.,
Geller, M. J., Diaferio, A., et al. 2004, AJ, 128, 1078 [NASA ADS] [CrossRef] (In the text)
- Ramella, M.,
Boschin, W., Geller, M. J., Mahdavi, A., & Rines, K. 2004, AJ,
in press [arXiv:astro-ph/0407640]
- Sarazin, C.
L. 1988, X-Ray Emission from Clusters of Galaxies, British Astron.
Assoc. J., 98, 212
-
Schechter, P. 1976, ApJ, 203, 297 [NASA ADS] [CrossRef] (In the text)
-
Scoccimarro, R., Sheth, R. K., Hui, L., et al. 2001, ApJ, 546,
20 [NASA ADS] [CrossRef] (In the text)
- Seljak, U.
2000, MNRAS, 318, 203 [NASA ADS] (In the text)
- Smith, J. A.,
Tucker, D. L., Kent, S. M., et al. 2002, AJ, 123, 2121 [NASA ADS] [CrossRef] (In the text)
- Springel,
V., & Hernquist, L. 2003, MNRAS, 339, 312 [NASA ADS] (In the text)
- Springel,
V., White, S. D. M., Tormen, G., & Kauffmann, G. 2001, MNRAS,
328, 726 [NASA ADS] (In the text)
-
Stoughton, C., Lupton, R. H., Bernardi, M., et al. 2002, AJ, 123,
485 [NASA ADS] [CrossRef] (In the text)
- Strateva,
I., Ivezic, Z., Knapp, G., et al. 2001, AJ, 122, 1861 [NASA ADS] [CrossRef] (In the text)
- Strauss, M.
A., Weinberg, D. H., Lupton, R. H., et al. 2002, AJ, 124, 1810 [NASA ADS] [CrossRef] (In the text)
- Tegmark, M.,
Strauss, M., Blanton, M., et al. 2004, PhRvD
(In the text)
- The L. S., &
White, S. D. M. 1986, AJ, 92, 1248 [NASA ADS] [CrossRef] (In the text)
- Thompson,
L. A., & Gregory, S. A. 1993, AJ, 106, 2197 [NASA ADS] [CrossRef] (In the text)
- White, M.,
Hernquist, L., & Springel, V. 2001, ApJ, 550, 129 [NASA ADS] [CrossRef] (In the text)
- Yang, X., Mo, H.
J., & van den Bosch, F. C. 2003, MNRAS, 339, 1057 [NASA ADS] (In the text)
- Yasuda, N.,
Fukugita, M., Narayanan, V. K., et al. 2001, AJ, 122, 1104 [NASA ADS] [CrossRef] (In the text)
-
Yoshikawa, K., Taruya, A., Jing, Y. P., & Suto, Y. 2001, ApJ,
558, 520 [NASA ADS] [CrossRef] (In the text)
- York, D. G.,
Adelman, J., Anderson, J. E., et al. 2000, AJ, 120, 1579 [NASA ADS] [CrossRef] (In the text)
- Zehavi, I.,
Weinberg, D. H., Zheng, Z., et al. 2004, ApJ, 608, 16 [NASA ADS] [CrossRef] (In the text)
- Zheng Z., Berlind
A. A., Weinberg D. H., et al. 2005
[arXiv:astro-ph/0408564]
(In the text)
Copyright ESO 2007