 |
Figure 1: Redshift distribution of the cluster sample used in this paper. |
| Open with DEXTER | |
In the text
 |
Figure 2:
Relation between the optical luminosity calculated in the SDSS r band
within r200 and the number of cluster galaxies contributing to
|
| Open with DEXTER | |
In the text
 |
Figure 3: The stacked mean surface number density profile of all the cluster galaxies with magnitude r < -18.5. The solid curve is the best fit King profile, the dashed curve is the best fit NFW profile. |
| Open with DEXTER | |
In the text
 |
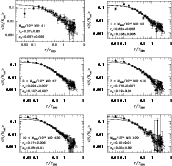
Figure 4:
The stacked surface number density profiles of clusters in different
cluster mass bins. The individual cluster profiles are obtained by
considering all the galaxies with
|
| Open with DEXTER | |
In the text
 |
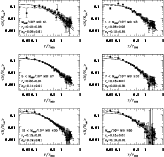
Figure 5: The surface number density profile of all the cluster galaxies with r < -18.5 in the highest of our considered cluster mass bins. The solid curve is the best fit provided by the generalized King profile. The dashed curve is the best fit provided by the NFW profile. Both profiles are consistent with the data. |
| Open with DEXTER | |
In the text
 |
Figure 6:
Composite surface brightness profile of two cluster samples: the
low mass systems at
|
| Open with DEXTER | |
In the text
 |
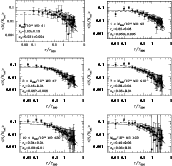
Figure 7: The stacked surface number density profile of the red cluster galaxies with magnitude r < -18.5, separately for clusters of different masses. The meaning of the lines is the same as in Fig. 4. |
| Open with DEXTER | |
In the text
 |
Figure 8: The stacked surface number density profile of the blue cluster galaxies with magnitude r < -18.5, separately for clusters of different masses. The meaning of the lines is the same as in Fig. 4. |
| Open with DEXTER | |
In the text
 |
Figure 9:
|
| Open with DEXTER | |
In the text
 |
Figure 10:
|
| Open with DEXTER | |
In the text
 |
Figure 11: Relation between the i band Petrosian absolute magnitude and the galaxy stellar mass. The galaxy stellar masses are taken by Kauffmann et al. (2003). |
| Open with DEXTER | |
In the text
 |
Figure 12:
The composite LF for the whole ( left panel) and the red
( right panel) cluster galaxy populations. In both panels the filled
points are the low-mass clusters (
|
| Open with DEXTER | |
In the text
 |
Figure 13:
Upper panel: the magnitude of the BCGs (empty squares) within
r200 as a function of the number of cluster galaxies within the
same radius, and with
|
| Open with DEXTER | |
In the text
 |
Figure 14:
The relation between BCG luminosity and cluster mass for our
cluster sample. Cluster masses are computed from
|
| Open with DEXTER | |
In the text
 |
Figure 15:
Left panel: the best-fit FP of cluster ellipticals,
relating their internal velocity dispersions
( |
| Open with DEXTER | |
In the text