A&A 463, 853-860 (2007)
DOI: 10.1051/0004-6361:20065384
A new (2+1)D cluster finding algorithm based on photometric redshifts:
large scale structure in the Chandra deep field south
D. Trevese1 - M. Castellano1 - A. Fontana2 - E. Giallongo2
1 - Dipartimento di Fisica, Universitá di Roma "La Sapienza'', P.le A. Moro 2, 00185 Roma, Italy
2 -
INAF - Osservatorio Astronomico di Roma, via di Frascati 33, 00040 Monte Porzio Catone, Italy
Received 7 April 2006 / Accepted 24 November 2006
Abstract
Aims. We study galaxy clustering and explore the dependence of galaxy properties on the the environment up to a redshift z  1, on the basis of a deep multi-band survey in the Chandra Deep Field South.
Methods. We have developed a new method which combines galaxy angular positions and photometric redshifts to estimate the local galaxy number-density. This allows both the detection of overdensities in the galaxy distribution and the study of the properties of the galaxy population as a function of the environmental density.
Results. We detect two moderate overdensities at z
0.7 and z
1 previously identified spectroscopically. We find that the fraction of red galaxies within each structure increases with volume density, extending to z
1 previous results. We measure "red sequence'' slopes consistent with the values found in X-ray selected clusters, supporting the notion that the mass-metallicity relation hold constant up to z 1.
Conclusions. Our method based on photometric redshifts allows to extend structure detection and density estimates up to the limits of photometric surveys, i.e. considerably deeper than spectroscopic surveys. Since X-ray cluster detection at high redshift is presently limited to massive relaxed structures, galaxy volume density based on photometric redshift appears as a valuable tool in the study of galaxy evolution.
Key words: galaxies: clusters: general - galaxies: evolution - galaxies: formation - galaxies: distances and redshifts - cosmology: large-scale structure of Universe
In recent years deep multi-band galaxy surveys, together with the development of
reliable population syntheses, and models for galaxy formation/evolution
which incorporate feedback from the galactic environment,
have determined a dramatic increase of our understanding of the
observed average evolution of the galaxy population in cosmic time.
On the other end, clusters and groups of galaxies are the ideal laboratories
where it is possible to study the environmental effects, which cause the differences of
the distribution of galactic types from the average (Carlberg et al. 2001; Gomez et al. 2003). For this reason finding
overdense regions at high redshift plays a central role in
understanding galaxy formation and evolution.
Unbiased samples of clusters and groups of galaxies can be obtained from 3D spectroscopic surveys, where the ability of a Friend of Friend (FOF) method (Huchra & Geller 1982)
to find over-densities is only limited by the uncertainty caused by the
galaxy velocity dispersion. However, spectroscopic surveys
reach limits of about 5 mag brighter than photometric ones, as e.g. in the SDSS survey
(York et al. 2000), so that complete spectroscopic galaxy redshift surveys of large areas of the sky are not available at the boundary of the visible Universe.
To minimize the effect of the background/foreground
objects in the detection of galaxy overdensities, two-dimensional (2D) surveys,
which are deeper, require additional a priori assumptions on either galaxy luminosity
function (LF), as in the Matched Filter algorithm (Postman et al. 1996) or the presence
of a red sequence (Gladders et al. 1998). Biases produced by these
assumptions can hardly be evaluated for at high redshift.
Multi-band photometric surveys are able to provide redshifts for large statistical samples of
galaxies at the deepest observational limits, though with a lower accuracy
(
 0.05) as compared with spectroscopic ones (
0.001)
(Fontana et al. 2000; Bell et al. 2004).
Various algorithms exist to evaluate photometric redshifts. They can rely on the position in a multi-dimensional
colour space respect to galaxies of known redshift (Connolly et al. 1995). Alternatively it is possible to fit the observed
SED with either empirical (Lanzetta et al. 1996) or theoretical templates (Giallongo et al. 1998).
Photometric redshifts have been successfully used to trace the evolution in cosmic time
of the average galaxy population (Poli et al. 2003; Giallongo et al. 2005).
However, the present accuracy of photometric redshifts leaves no room for standard FOF methods.
In fact, the linking distance
0.05) as compared with spectroscopic ones (
0.001)
(Fontana et al. 2000; Bell et al. 2004).
Various algorithms exist to evaluate photometric redshifts. They can rely on the position in a multi-dimensional
colour space respect to galaxies of known redshift (Connolly et al. 1995). Alternatively it is possible to fit the observed
SED with either empirical (Lanzetta et al. 1996) or theoretical templates (Giallongo et al. 1998).
Photometric redshifts have been successfully used to trace the evolution in cosmic time
of the average galaxy population (Poli et al. 2003; Giallongo et al. 2005).
However, the present accuracy of photometric redshifts leaves no room for standard FOF methods.
In fact, the linking distance
 must be larger than the
distance uncertainty
must be larger than the
distance uncertainty
 associated with the photometric redshift,
otherwise even close neighbours, which on average appear at a rms distance of the order of
,
fail to be linked.
On the other hand,
must be smaller than the average galaxy-galaxy distance
associated with the photometric redshift,
otherwise even close neighbours, which on average appear at a rms distance of the order of
,
fail to be linked.
On the other hand,
must be smaller than the average galaxy-galaxy distance  ,
to avoid a percolation of the "friendship'' path
through the galaxy distribution leading to huge unphysical chains of galaxies linked by the FOF algorithm, even in the absence of any group or cluster structure: thus the condition
,
to avoid a percolation of the "friendship'' path
through the galaxy distribution leading to huge unphysical chains of galaxies linked by the FOF algorithm, even in the absence of any group or cluster structure: thus the condition
 must hold.
However, the minimum uncertainty attained by photometric redshifts is
must hold.
However, the minimum uncertainty attained by photometric redshifts is
 ,
corresponding to
,
corresponding to
 180 Mpc for z
  1, while
the average number density of bright galaxies is
1, while
the average number density of bright galaxies is
 ,
corresponding to an average galaxy-galaxy distance as small as
,
corresponding to an average galaxy-galaxy distance as small as  5 Mpc (Bahcall 1988), i.e.
we have
5 Mpc (Bahcall 1988), i.e.
we have
 .
This has been discussed in detail by Botzler et al. (2004) who proposed an extended friends-of-friends method (EXT-FOF)
which applies a FOF method to angular distances, in redshift slices which are defined on the basis of photometric redshifts,
taking into account their intrinsic uncertainties.
In the present paper we present an alternative approach to the use of photometric redshifts.
Our algorithm evaluates the 3D galaxy density
using angular positions and photometric redshifts with the purpose of:
i) detecting galaxy over-densities in three dimensions;
and ii) assigning to each galaxy a measure of the environmental density, to
extend the analysis of the environmental effects
on galaxy evolution to the limits of photometric surveys.
The method is applied to a deep photometric survey of the Chandra Deep Field South (Cimatti et al. 2002a), where we re-discover some previously known overdensities and we find a clear relation between the fraction of blue and red galactic types and the local density.
The paper is organised as follows. In Sect. 2 we present a new method to define a galaxy-volume density using angular positions and photometric redshifts.
In Sect. 3 we apply the algorithm to a deep photometric survey of a portion of
the Chandra Deep Field South to identify some high-z clusters and analyse the
dependence of their galaxy population on local density.
In Sect. 4 we study the evolution in cosmic time of the red sequence.
In Sect. 5 we check the reliability of the results
and possible extrapolation to deeper surveys by applying
the algorithm to a simulated galaxy catalogue.
In Sect. 6 we discuss the results and Sect. 7 provides a summary.
Throughout the paper we adopt consensus cosmological parameters
.
This has been discussed in detail by Botzler et al. (2004) who proposed an extended friends-of-friends method (EXT-FOF)
which applies a FOF method to angular distances, in redshift slices which are defined on the basis of photometric redshifts,
taking into account their intrinsic uncertainties.
In the present paper we present an alternative approach to the use of photometric redshifts.
Our algorithm evaluates the 3D galaxy density
using angular positions and photometric redshifts with the purpose of:
i) detecting galaxy over-densities in three dimensions;
and ii) assigning to each galaxy a measure of the environmental density, to
extend the analysis of the environmental effects
on galaxy evolution to the limits of photometric surveys.
The method is applied to a deep photometric survey of the Chandra Deep Field South (Cimatti et al. 2002a), where we re-discover some previously known overdensities and we find a clear relation between the fraction of blue and red galactic types and the local density.
The paper is organised as follows. In Sect. 2 we present a new method to define a galaxy-volume density using angular positions and photometric redshifts.
In Sect. 3 we apply the algorithm to a deep photometric survey of a portion of
the Chandra Deep Field South to identify some high-z clusters and analyse the
dependence of their galaxy population on local density.
In Sect. 4 we study the evolution in cosmic time of the red sequence.
In Sect. 5 we check the reliability of the results
and possible extrapolation to deeper surveys by applying
the algorithm to a simulated galaxy catalogue.
In Sect. 6 we discuss the results and Sect. 7 provides a summary.
Throughout the paper we adopt consensus cosmological parameters
 = 0.7,
 = 0.3, H0 = 70 km s-1 Mpc-1.
As far as background/foreground effects are acceptable, namely at
relatively low redshifts, the surface density is sufficient to detect galaxy clusters
or to study their morphology, as in the case of Abell (1958) or Zwicky (Zwicky et al. 1961) clusters or in the later works of the Edinburgh-Durham Cluster Catalogue (Lumsden et al. 1992). A surface density
 |
(1) |
of galaxies can be computed considering the projected distances
 to the nth nearest neighbour, and can be used to study
the effect of the environment on the distribution of galactic types, as
done by Dressler (Dressler 1980; Dressler et al. 1997).
Similarly, when spectroscopic redshifts are available, it
is possible to compute the three-dimensional (non projected) distance Dn to the nth nearest neighbour and derive a volume density
to the nth nearest neighbour, and can be used to study
the effect of the environment on the distribution of galactic types, as
done by Dressler (Dressler 1980; Dressler et al. 1997).
Similarly, when spectroscopic redshifts are available, it
is possible to compute the three-dimensional (non projected) distance Dn to the nth nearest neighbour and derive a volume density
 |
(2) |
The method we propose for deep photometric surveys, where spectroscopic galaxy redshifts are not available, consists in combining, in the most effective way, the
angular position with the (much less accurate) distance as computed from the photometric
redshift. In principle it is possible to compute for each galaxy the distance
from its neighbours from the angular positions and photometric redshifts, once a cosmological model is assumed. In practise we prefer to divide the survey volume in cells whose extension in different directions (
 )
depends on the relevant positional accuracy and thus are elongated in the radial direction.
Then for each point in space (i.e. for each cell) we count neighbouring objects
of increasing distance, until a number n of objects is reached.
We define the density associated to the cell as
)
depends on the relevant positional accuracy and thus are elongated in the radial direction.
Then for each point in space (i.e. for each cell) we count neighbouring objects
of increasing distance, until a number n of objects is reached.
We define the density associated to the cell as
where Vn is the volume which includes the n nearest neighbours.
The choice of n is a trade off between spatial resolution and signal-to-noise ratio.
In the following the number n is chosen in such a way that n objects are present in a single cell in the regions of maximum density.
Notice that, in principle, the way of searching neighbouring objects of increasing distance is not univocal, since distance steps (cell sizes) in different directions can be chosen arbitrarily.
The result will be a different smoothing, and resolution, in different directions. The choice we adopt is to keep the maximum resolution in transversal and radial directions allowed by the data.
Since the uncertainty in the
radial direction is much larger, this will correspond to elongated cells and lower radial resolution. Steps  in the radial direction smaller than the photometric redshift uncertainty would uselessly increase the computing time.
In counting galaxies we must take into account the increase of limiting luminosity with increasing redshift for a given flux limit. If
in the radial direction smaller than the photometric redshift uncertainty would uselessly increase the computing time.
In counting galaxies we must take into account the increase of limiting luminosity with increasing redshift for a given flux limit. If
 is the limiting (apparent) magnitude in a fixed observing band, at each redshift z we detect only objects brighter than an absolute magnitude
 ,
decreasing (brightening) with z.
We can assume a reference redshift
,
decreasing (brightening) with z.
We can assume a reference redshift  below which we detect all objects brighter
than the relevant
below which we detect all objects brighter
than the relevant
 ,
below which we neglect the incompleteness.
At
,
below which we neglect the incompleteness.
At
 the fraction of detected objects is:
 |
(3) |
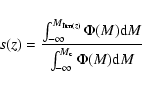
where  is the galaxy luminosity function.
Thus, in evaluating the galaxies number density, we apply a limiting magnitude correction
by assigning a weight
w(z)=1/s(z) to each detected galaxy of redshift z.
In this way we correct the systematic underestimate of density, caused to the increasing
fraction of galaxies which fall below the brightness limit for increasing redshift. Of course
the noise in the derived density
increases as the square root of w(z), but the advantage is to obtain
a density scale independent of redshift, at least to a first approximation.
We stress that, in general, the distance modulus m-M depends not only on the luminosity
distance
is the galaxy luminosity function.
Thus, in evaluating the galaxies number density, we apply a limiting magnitude correction
by assigning a weight
w(z)=1/s(z) to each detected galaxy of redshift z.
In this way we correct the systematic underestimate of density, caused to the increasing
fraction of galaxies which fall below the brightness limit for increasing redshift. Of course
the noise in the derived density
increases as the square root of w(z), but the advantage is to obtain
a density scale independent of redshift, at least to a first approximation.
We stress that, in general, the distance modulus m-M depends not only on the luminosity
distance
 ,
and thus on the adopted cosmological model, but also on the k- and evolutionary-corrections which, in turn, depend on the galactic type.
Moreover the luminosity function itself depends on both the wavelength
,
and thus on the adopted cosmological model, but also on the k- and evolutionary-corrections which, in turn, depend on the galactic type.
Moreover the luminosity function itself depends on both the wavelength  and cosmic time.
However, as far as s(z) is not much smaller than one, it is possible to adopt simple
representations of these effects, and any correction to the limiting magnitude correction will
represent a second order effect. Practically the choice of the cell sizes is determined by the accuracy of the photometric redshifts. In fact, once the cells have transversal sizes which are much smaller than the radial one (say 1/1000), a further increase of the transversal resolution does not justify the corresponding increase of the computing time. At least, this is true as far as we do not expect structures which are physically strongly elongated in the radial direction.
In the application presented in the following sections, the relative redshift uncertainty is
and cosmic time.
However, as far as s(z) is not much smaller than one, it is possible to adopt simple
representations of these effects, and any correction to the limiting magnitude correction will
represent a second order effect. Practically the choice of the cell sizes is determined by the accuracy of the photometric redshifts. In fact, once the cells have transversal sizes which are much smaller than the radial one (say 1/1000), a further increase of the transversal resolution does not justify the corresponding increase of the computing time. At least, this is true as far as we do not expect structures which are physically strongly elongated in the radial direction.
In the application presented in the following sections, the relative redshift uncertainty is
 (Cimatti et al. 2002b),
corresponding to a length scale
(Cimatti et al. 2002b),
corresponding to a length scale
 ,
Mpc at
,
Mpc at  .
Cells sizes are arbitrary and are chosen small enough not to degrade the spatial resolution, while avoiding a useless increase of the computing time.
We have adopted 60 Mpc in the radial direction and 60 kpc at
in transversal direction,
corresponding to
.
Cells sizes are arbitrary and are chosen small enough not to degrade the spatial resolution, while avoiding a useless increase of the computing time.
We have adopted 60 Mpc in the radial direction and 60 kpc at
in transversal direction,
corresponding to
 arcsec.
Galaxy clusters or, more generally, galaxy overdensities are defined as connected 3-dimensional
regions with density exceeding
a fixed threshold. Once overdensities are identified, it is possible to analyse the properties
of galaxies as a function of the local density.
arcsec.
Galaxy clusters or, more generally, galaxy overdensities are defined as connected 3-dimensional
regions with density exceeding
a fixed threshold. Once overdensities are identified, it is possible to analyse the properties
of galaxies as a function of the local density.
The dataset used to identify distant clusters and to study the properties of their member
galaxies is the deep
photometric catalogue of the K20 survey (Cimatti et al. 2002a,b) containing photometry in the
 bands of a 6.38
  6.13 arcmin field in Chandra Deep Field South (CDFS) (Giacconi et al. 2002). The sample is limited to
 ,
while the photometric depth in the other bands allows to assume that virtually
all galaxies in the catalogue have 8-band photometry, except a few objects with very extreme
colours. We have added to the spectroscopic redshifts of the K20 all public spectroscopic redshifts
in our field from GOODS-MUSIC catalogue (Grazian et al. 2006, and refs. therein).
The catalogue contains 1749 galaxies among which 292 have spectroscopic redshifts and the remaining have only photometric redshifts.
The procedure for deriving photometric redshifts and test their accuracy is described in
Cimatti et al. (2002b), where it is shown that the distribution of the fractional error
,
while the photometric depth in the other bands allows to assume that virtually
all galaxies in the catalogue have 8-band photometry, except a few objects with very extreme
colours. We have added to the spectroscopic redshifts of the K20 all public spectroscopic redshifts
in our field from GOODS-MUSIC catalogue (Grazian et al. 2006, and refs. therein).
The catalogue contains 1749 galaxies among which 292 have spectroscopic redshifts and the remaining have only photometric redshifts.
The procedure for deriving photometric redshifts and test their accuracy is described in
Cimatti et al. (2002b), where it is shown that the distribution of the fractional error
 is not Gaussian. After excluding "outlayers'' with
 ,
which represent less than 9% of the total, we obtain
,
which represent less than 9% of the total, we obtain
 .
.
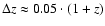
Figure 1 shows photometric redshifts versus spectroscopic redshifts,
with the uncertainty
0.05 (1+z) indicated by the dashed lines.
![\begin{figure}
\par\includegraphics[width=7.3cm,clip]{5384fig1.ps}\end{figure}](/articles/aa/full/2007/09/aa5384-06/Timg51.gif) |
Figure 1:
Photometric redshifts
 versus spectroscopic redshifts
 for all the galaxies in the catalogue with spectroscopic observations (Grazian et al. 2006, and refs. therein). Dashed lines indicate the rms uncertainty 0.05(1+z).
 |
| Open with DEXTER |
We have constructed (2+1)D maps of the volume density  ,
with n=10,
computing s(z) in Eq. (3) on the basis of a cosmologically evolving luminosity function.
This has been taken from Poli et al. (2003), who derived the rest-frame B luminosity
function which is directly sampled until the rest-frame blue is observed in the K band, namely up to a redshift of about 3.5. In their analysis Poli et al. (2003) find little density evolution at the faint end with respect to the
local values, while at the bright end a brightening increasing with redshift is apparent with respect to the local LF.
,
with n=10,
computing s(z) in Eq. (3) on the basis of a cosmologically evolving luminosity function.
This has been taken from Poli et al. (2003), who derived the rest-frame B luminosity
function which is directly sampled until the rest-frame blue is observed in the K band, namely up to a redshift of about 3.5. In their analysis Poli et al. (2003) find little density evolution at the faint end with respect to the
local values, while at the bright end a brightening increasing with redshift is apparent with respect to the local LF.
The choice n=10 corresponds to the maximum number of objects in a single cell at high density
as discussed in Sect. 2.
![\begin{figure}
\par\includegraphics[width=7.3cm,clip]{5384fig2.ps}\end{figure}](/articles/aa/full/2007/09/aa5384-06/Timg53.gif) |
Figure 2:
a) The distribution of photometric redshifts of the sample.
b) Average  density on the entire field, in redshift bins, versus z as determined by the (2D+1) algorithm using for all sources: i) photometric redshifts (dashed line); ii) photometric redshifts, or spectroscopic redshifts whenever available (continuous line).
 |
| Open with DEXTER |
To see how the resolution of photometric redshifts compares with real objects distribution, we show in Fig. 2 the histogram of photometric redshifts in the field. Two main clumps
appear about redshifts 0.70, 1.00. A comparison with the distribution of spectroscopic redshifts of the CDFS (see Gilli et al. 2003, Fig. 1)
clearly indicates the reality of the two clumps,
although the two peaks at z=0.67 and z=0.73 found by Gilli et al. (2003) in the distribution of spectroscopic redshifts
are barely resolved in our photometric redshift distribution.
On the basis of spectroscopic redshifts, Gilli et al. (2003) found that both structures are spread over the field,
although the latter includes a cD galaxy, suggesting a dynamically relaxed status (see Sarazin 1988).
To check to what extent our results depend on the presence of
spectroscopic redshift in our catalogue, we show in Fig. 2b
the average density in the field as a function of redshift, as
computed from photometric redshifts only, or including also
spectroscopic redshifts whenever the latter are available. The two curves look similar. In fact using
instead of
does not change significantly the density, once the cell size has been
chosen on the basis of the (much lower)
accuracy. This
means that our results do not rely on the availability of several
spectroscopic redshifts in the field. Notice that the density
reported in Fig. 2b, which is averaged over the entire
field, is not used to detect structures. For this purpose we select
individual cells with density above a given threshold, and then we
look for connected volumes. The choice of the threshold is an arbitrary trade off between completeness and reliability. From our
numerical simulations (see Sect. 5) we found that a threshold
corresponding to about three to five times the average density can
identify richness zero Abell clusters. More complex simulations would
be necessary to reliably evaluate the degree of contamination as a function of the richness class and redshift. In real data, from the
distribution of the densities of individual cells we found that
thresholds of 0.078 Mpc-3 or 0.13 Mpc-3 (i.e. 3 or 5 times
the average) isolate 2.2% or 0.5% respectively of the total cell
number. To avoid excessive contamination from random density
fluctuations we adopted a threshold
 = 0.08 Mpc-3 which selects about 2.0% of the cells. In this way we
identified three over-densities listed in Table 1. We
adopted a redshift independent threshold to detect structures of
comparable density at any redshift. In principle, this implies an higher probability of contamination at higher redshifts: we plan to
explore this issue in future work extending to higher redhifts.
= 0.08 Mpc-3 which selects about 2.0% of the cells. In this way we
identified three over-densities listed in Table 1. We
adopted a redshift independent threshold to detect structures of
comparable density at any redshift. In principle, this implies an higher probability of contamination at higher redshifts: we plan to
explore this issue in future work extending to higher redhifts.
The first structure, at z=0.70 is approximately centred on the cD galaxy,
whose position, in turn, corresponds to the centre of the extended
X-ray source CDFS566 (Giacconi et al. 2002).
As noted above, we cannot resolve, in redshift space, the wall-like structure at z=0.67 described by Gilli et al. (2003) which then contaminates the structure at z=0.70.
In spite of that we find a relatively concentrated structure with full width at half maximum of about 0.12 Mpc. After the statistical subtraction of the background/foreground field galaxies
the number of galaxies within the Abell radius  is
is  = 182, of which 38
are between m3 and m3+2, corresponding to a richness class 0.
From the spectroscopic redshifts we can evaluate a velocity dispersion along the line of sight,
= 182, of which 38
are between m3 and m3+2, corresponding to a richness class 0.
From the spectroscopic redshifts we can evaluate a velocity dispersion along the line of sight,
 334
334  31 km s-1, for the 39 galaxies belonging to the peak in the redshift distribution centred at at z=0.73, the uncertainty being computed by a bootstrap method.
The relevant virial mass
31 km s-1, for the 39 galaxies belonging to the peak in the redshift distribution centred at at z=0.73, the uncertainty being computed by a bootstrap method.
The relevant virial mass
 is M=1.19
 ,
where
,
where
 is the projected virial radius
and Rij are the projected distances between each pair of the N=39 galaxies
(Heisler et al. 1985; Girardi et al. 1998).
For the sole purpose of displaying the morphology of the density field we show, in Fig. 3a, the isolines of the surface density
is the projected virial radius
and Rij are the projected distances between each pair of the N=39 galaxies
(Heisler et al. 1985; Girardi et al. 1998).
For the sole purpose of displaying the morphology of the density field we show, in Fig. 3a, the isolines of the surface density
 (see Sect. 2), evaluated in the redshift slice
0.70
(see Sect. 2), evaluated in the redshift slice
0.70
 0.75. A similar plot for the overdensity at
  1.00 is shown
in Fig. 3b where the galaxy
number within the Abell radius, with
m3< m < m3+2, barely reaches the formal threshold of 30
corresponding to richness class 0, depending on the exact location of the adopted centre.
The spectroscopic redshift distribution suggests the existence of two distinct peaks at 0.97 and 1.04: the former associated with galaxies around the main overdensity and the latter corresponding to the south east extension.
The analysis of possible substructures of this overdensity requires further spectroscopic data.
The third clump we find at z =1.55 does not appear in the distribution of spectroscopic
galaxy redshifts which is limited to brighter fluxes respect to our photometric data.
On the other hand, the accuracy of our photometric redshifts is statistically checked against spectroscopic ones only for
1.00 is shown
in Fig. 3b where the galaxy
number within the Abell radius, with
m3< m < m3+2, barely reaches the formal threshold of 30
corresponding to richness class 0, depending on the exact location of the adopted centre.
The spectroscopic redshift distribution suggests the existence of two distinct peaks at 0.97 and 1.04: the former associated with galaxies around the main overdensity and the latter corresponding to the south east extension.
The analysis of possible substructures of this overdensity requires further spectroscopic data.
The third clump we find at z =1.55 does not appear in the distribution of spectroscopic
galaxy redshifts which is limited to brighter fluxes respect to our photometric data.
On the other hand, the accuracy of our photometric redshifts is statistically checked against spectroscopic ones only for
 ,
so that further data would be needed to assess the reality of this structure.
However a peak in the distribution of the X-ray selected AGNs in the field is present at about z=1.55. Thus, as far as we can assume that distribution of AGNs traces the large scale distribution of matter we can say that we are detecting
a structure not previously seen in galaxy spectroscopic surveys.
The Abell richness of the third structure at
,
so that further data would be needed to assess the reality of this structure.
However a peak in the distribution of the X-ray selected AGNs in the field is present at about z=1.55. Thus, as far as we can assume that distribution of AGNs traces the large scale distribution of matter we can say that we are detecting
a structure not previously seen in galaxy spectroscopic surveys.
The Abell richness of the third structure at  1.55 cannot be evaluated, since m3+2 falls below the limiting magnitude mI = 25. The peak in the photometric redshift distribution
contains 57 objects spread along a moderate over-density crossing the field from north-west to south-east likely related to the above discussed large-scale structure traced by X-ray selected AGN (Gilli et al. 2003).
The association of an environmental density with individual galaxies allows both
a further assessment of the nature of the detected overdensities and the analysis of the relation
between galaxy spectral energy distribution and the environment.
1.55 cannot be evaluated, since m3+2 falls below the limiting magnitude mI = 25. The peak in the photometric redshift distribution
contains 57 objects spread along a moderate over-density crossing the field from north-west to south-east likely related to the above discussed large-scale structure traced by X-ray selected AGN (Gilli et al. 2003).
The association of an environmental density with individual galaxies allows both
a further assessment of the nature of the detected overdensities and the analysis of the relation
between galaxy spectral energy distribution and the environment.
Table 1:
Detected structures.
![\begin{figure}
\par\includegraphics[width=8cm,clip]{5384fig3.ps} \end{figure}](/articles/aa/full/2007/09/aa5384-06/Timg67.gif) |
Figure 3:
Isodensity contours of the surface density
as
computed in the redshift slice
0.70 < z < 0.75, which includes the first detected structure ( left panel). b) Same plot for the second structure in the redshift slice
0.90 < z <1.10 ( right panel). |
| Open with DEXTER |
![\begin{figure}
\par\includegraphics[width=7.4cm,clip]{5384fig4.ps} \end{figure}](/articles/aa/full/2007/09/aa5384-06/Timg70.gif) |
Figure 4:
Galaxy colour distributions: at high density (
 )
(shaded histogram), at low density ( )
(shaded histogram), at low density (
 ), for the two structures at
0.70 ( left) and ), for the two structures at
0.70 ( left) and
 ( right).
 |
| Open with DEXTER |
A strong colour bi-modality of the colour distribution has recently been confirmed on the basis of a large galaxy sample of about 150 000 objects from the Sloan Digital Sky Survey (Strateva et al. 2001, and refs. therein).
This bi-modality has been shown to maintain up to  2-3 (Giallongo et al. 2005),
with a local minimum in the colour distribution which evolves in redshift and represents the natural separation between the "blue'' and
"red'' galaxy populations, the latter defining an average red sequence of the field.
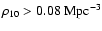
Instead, Fig. 4 shows rest-frame B-R colour distribution in overdense (
2-3 (Giallongo et al. 2005),
with a local minimum in the colour distribution which evolves in redshift and represents the natural separation between the "blue'' and
"red'' galaxy populations, the latter defining an average red sequence of the field.
Instead, Fig. 4 shows rest-frame B-R colour distribution in overdense (
 0.08 Mpc-3) and underdense (
 0.03 Mpc-3) regions both at
0.7 and .
Following Carlberg et al. (2001), we conservatively adopt the constant rest frame colour B-R=1.25 as a boundary between the two populations.
The excess of red galaxies in overdense regions respect to the field, clearly appears
in Fig. 4. According to a Kolmogorov-Smirnov test, the probability of the null hypothesis that the colours inside and outside the overdensities
are randomly drawn from the same distribution is 4.2
10-7 for the cluster at z=0.7 and 0.058 for the cluster at z=1.0. Due to the insufficient statistics,
a similar colour segregation cannot be detected in the case of the
1.55 overdensity,
which will be studied as soon as deeper photometric data will become available (Trevese et al. 2006). In the two former overdensities we can study the fraction of red galaxies as a function of the density .
The result is shown in Fig. 5, where both clusters show a decrease of red fraction as a function of ,
marginally significant at z=1.0 and more evident at z=0.7. This colour segregation is clearly related to the morphological segregation first found by Dressler (1980) for local clusters successively extended to z=0.5 by Dressler et al. (1997). Our analysis of colour segregation allows to extend a quantitative investigation of environmental
effects up to redshifts where morphological studies become unfeasible.
0.03 Mpc-3) regions both at
0.7 and .
Following Carlberg et al. (2001), we conservatively adopt the constant rest frame colour B-R=1.25 as a boundary between the two populations.
The excess of red galaxies in overdense regions respect to the field, clearly appears
in Fig. 4. According to a Kolmogorov-Smirnov test, the probability of the null hypothesis that the colours inside and outside the overdensities
are randomly drawn from the same distribution is 4.2
10-7 for the cluster at z=0.7 and 0.058 for the cluster at z=1.0. Due to the insufficient statistics,
a similar colour segregation cannot be detected in the case of the
1.55 overdensity,
which will be studied as soon as deeper photometric data will become available (Trevese et al. 2006). In the two former overdensities we can study the fraction of red galaxies as a function of the density .
The result is shown in Fig. 5, where both clusters show a decrease of red fraction as a function of ,
marginally significant at z=1.0 and more evident at z=0.7. This colour segregation is clearly related to the morphological segregation first found by Dressler (1980) for local clusters successively extended to z=0.5 by Dressler et al. (1997). Our analysis of colour segregation allows to extend a quantitative investigation of environmental
effects up to redshifts where morphological studies become unfeasible.
![\begin{figure}
\par\includegraphics[width=7.5cm,clip]{5384fig5.ps} \end{figure}](/articles/aa/full/2007/09/aa5384-06/Timg74.gif) |
Figure 5:
Fraction of galaxies with rest frame colour B-R> 1.25 as a function of
the volume density ,
for the two structures at
0.70 ( left) and
( right). Error bars represent Poissonian fluctuation. |
| Open with DEXTER |
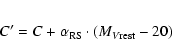
We first study the cosmological evolution of the average red sequence of the field.
Following Bell et al. (2004)
it is possible to define for each galaxy a colour index C' reduced to
 = -20
by shifting each galaxy in the C-M diagram to
= -20 along the red sequence:
= -20
by shifting each galaxy in the C-M diagram to
= -20 along the red sequence:
where C is the rest-frame colour,
 in our case, and
 is the slope of the red sequence, In practise, for a direct comparison with Bell et al. (2004)
who adopt a different cosmology, we assume as reference magnitude
is the slope of the red sequence, In practise, for a direct comparison with Bell et al. (2004)
who adopt a different cosmology, we assume as reference magnitude
 instead of -20. A distribution of the C', instead of C, colours allows a better identification
of the "Early type'', or red galaxies, population which defines the average red sequence.
Following Bell et al. (2004) we assume a constant slope
instead of -20. A distribution of the C', instead of C, colours allows a better identification
of the "Early type'', or red galaxies, population which defines the average red sequence.
Following Bell et al. (2004) we assume a constant slope
 which is derived from a sample of nearby clusters (Bower et al. 1992). This assumption is justified by the analysis
of Blakeslee et al. (2003) who find a constant slope for different galaxy clusters up to z=1.2 (see the next paragraph).
At higher redshifts Giallongo et al. (2005) find a decrease of the red sequence slope
which is derived from a sample of nearby clusters (Bower et al. 1992). This assumption is justified by the analysis
of Blakeslee et al. (2003) who find a constant slope for different galaxy clusters up to z=1.2 (see the next paragraph).
At higher redshifts Giallongo et al. (2005) find a decrease of the red sequence slope
 from -0.098 to -0.062, in the two wide redshift bins 0.4-1 and 1.3-3.5 respectively.
In the present analysis, which is limited to z< 1.7, we neglect this change of slope and
we estimate the red sequence colours in three relatively narrow redshift bins.
Figures 6a-c shows the rest-frame colour-magnitude diagrams for all galaxies in the field, selected in the three slices of photometric redshift, 0.7<z<0.8, 0.9<z<1.1, 1.4<z<1.7
and the relevant C' distributions.
From the C' colour distribution we select the members of the red population as those galaxies lying redwards of the natural
minimum which separates the blue and red populations.
A fit in the C-M diagram of the red population with a straight line of fixed slope
from -0.098 to -0.062, in the two wide redshift bins 0.4-1 and 1.3-3.5 respectively.
In the present analysis, which is limited to z< 1.7, we neglect this change of slope and
we estimate the red sequence colours in three relatively narrow redshift bins.
Figures 6a-c shows the rest-frame colour-magnitude diagrams for all galaxies in the field, selected in the three slices of photometric redshift, 0.7<z<0.8, 0.9<z<1.1, 1.4<z<1.7
and the relevant C' distributions.
From the C' colour distribution we select the members of the red population as those galaxies lying redwards of the natural
minimum which separates the blue and red populations.
A fit in the C-M diagram of the red population with a straight line of fixed slope
 defines the colour
 of the average red sequence
in different bins of redshift.
Figure 7, adapted from Bell et al. (2004) shows the colour
of the average red sequence in our field in the above redshift intervals,
compared with the colour of the average red sequence as a function of redshift obtained from
COMBO17 data, after a correction on
of the average red sequence
in different bins of redshift.
Figure 7, adapted from Bell et al. (2004) shows the colour
of the average red sequence in our field in the above redshift intervals,
compared with the colour of the average red sequence as a function of redshift obtained from
COMBO17 data, after a correction on
 as derived from a comparison of the colours of those high-z galaxies which are in common in the 2 catalogues COMBO17 and K20.
Our error bars represent the rms dispersion of C' in each redshift bin.
We can conclude that the
as derived from a comparison of the colours of those high-z galaxies which are in common in the 2 catalogues COMBO17 and K20.
Our error bars represent the rms dispersion of C' in each redshift bin.
We can conclude that the  vs. z relation in our analysis is consistent with Bell et al. (2004) up to
  ,
moreover the point at z=1.5lies on the linear extrapolation of their points.
As a further step, we measured the slope of the red sequence in the two clumps at redshifts 0.7 and 1.0. This has not be done for the third clump at z=1.55, due to insufficient statistics.
We selected galaxies with an environmental density above a threshold = 0.08
,
moreover the point at z=1.5lies on the linear extrapolation of their points.
As a further step, we measured the slope of the red sequence in the two clumps at redshifts 0.7 and 1.0. This has not be done for the third clump at z=1.55, due to insufficient statistics.
We selected galaxies with an environmental density above a threshold = 0.08
 (see Sect. 3).
We then isolated the red population from the histograms of the C' colour which are clearly bimodal. Finally, we evaluated the slope of the colour-magnitude relation for this population in the U-B vs. B diagram, as done by Blakeslee et al. (2003).
Our results show that the slope of the red sequence is consistent with being the same in local clusters and in the two main overdensities (
(see Sect. 3).
We then isolated the red population from the histograms of the C' colour which are clearly bimodal. Finally, we evaluated the slope of the colour-magnitude relation for this population in the U-B vs. B diagram, as done by Blakeslee et al. (2003).
Our results show that the slope of the red sequence is consistent with being the same in local clusters and in the two main overdensities ( and ).
Blakeslee et al. (2003) found little or no evidence of evolution of this slope,
out to z=1.2. Our results (Fig. 8) lie within 1
and ).
Blakeslee et al. (2003) found little or no evidence of evolution of this slope,
out to z=1.2. Our results (Fig. 8) lie within 1 from their average value
 .
According to the standard interpretation (Arimoto & Yoshii 1987; Kauffmann & Charlot 1998) this implies that
the mass-metallicity relation holds the same from z=0 up to at least z=1.
.
According to the standard interpretation (Arimoto & Yoshii 1987; Kauffmann & Charlot 1998) this implies that
the mass-metallicity relation holds the same from z=0 up to at least z=1.
![\begin{figure}
\par\includegraphics[width=7cm,clip]{5384fig6.ps} \end{figure}](/articles/aa/full/2007/09/aa5384-06/Timg88.gif) |
Figure 6:
Left panels: histograms of the C' colour, defined in the text, for all the objects in the intervals 0.7<z<0.8, 0.9<z<1.1, 1.4<z<1.7 (from the top). Dashed lines, corresponding to a local minimum, define the red and the blue populations.
Right panels: rest-frame (U-V) vs. MV diagrams: the continuous line represents the fit
to the points belonging to the red population, with a fixed slope
= 0.08.
The dashed vertical line represents the reference absolute magnitude MV=-20.7. The dotted line
indicates the valley separating the two populations. |
| Open with DEXTER |
![\begin{figure}
\par\includegraphics[width=7.2cm,clip]{5384fig7.ps} \end{figure}](/articles/aa/full/2007/09/aa5384-06/Timg89.gif) |
Figure 7:
The colour
at
= -20 of the average red sequence, as computed from COMBO17 survey (circles),
and resulting from the present analysis (triangles).
The straight line represents a linear fit on all the data analysed in the COMBO17 survey
(adapted from Bell et al. 2004). |
| Open with DEXTER |
![\begin{figure}
\par\includegraphics[width=7.5cm,clip]{5384fig8.ps} \end{figure}](/articles/aa/full/2007/09/aa5384-06/Timg90.gif) |
Figure 8:
The slope of the rest-frame (U-B) vs. MB in the galaxy clusters
collected by Blakeslee et al. (2003) (open squares)
and in the two structures detected in the CDFS (filled squares).
The dotted line represents the average value derived by Blakeslee et al. (2003). |
| Open with DEXTER |
To check the reliability of the algorithm in detecting clusters of various types and redshifts
we created a series of mock catalogues including field galaxies and clusters.
Field objects were uniformly distributed on a square of 6
6 arcmin centred on the cluster,
with a space density and absolute magnitude distributions assigned according
to the redshift-dependent Schechter-like (Schechter 1976) LF derived by Giallongo et al. (2005):
with
 and
and
 .
Clusters are represented by a number-density distribution
.
Clusters are represented by a number-density distribution
(see Sarazin 1988) with a typical core radius
 .
To take into account the uncertainty on photometric
redshifts, we assigned to each galaxy a random redshift with a mean corresponding to the cluster
redshift and a dispersion
.
To take into account the uncertainty on photometric
redshifts, we assigned to each galaxy a random redshift with a mean corresponding to the cluster
redshift and a dispersion
 corresponding to a velocity dispersion along the line of sight
 km s-1 (Hogg 2000).
Once position and redshift are assigned to a galaxy, an absolute blue magnitude MB is extracted from a Schechter LF, with parameters
km s-1 (Hogg 2000).
Once position and redshift are assigned to a galaxy, an absolute blue magnitude MB is extracted from a Schechter LF, with parameters
 and
and
 for ellipticals and
 and
and
 for spirals,
derived by De Propris et al. (2003) from the analysis of 2dF clusters.
The fraction of different galaxy types was chosen according to Goto et al. (2004).
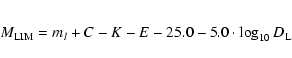
Different values of the central density n0 are chosen to produce clusters of various richness classes. Table 2 reports the values of the parameters for elliptical and spiral galaxies in the field. To evaluate the total number of cluster and field objects
for spirals,
derived by De Propris et al. (2003) from the analysis of 2dF clusters.
The fraction of different galaxy types was chosen according to Goto et al. (2004).
Different values of the central density n0 are chosen to produce clusters of various richness classes. Table 2 reports the values of the parameters for elliptical and spiral galaxies in the field. To evaluate the total number of cluster and field objects
 we computed the limiting rest-frame magnitude
in the B band given by:
we computed the limiting rest-frame magnitude
in the B band given by:
ml=25 is the limiting AB magnitude at the effective wavelength of the I band, K and E are, respectively, the type dependent K-correction and evolutionary correction (Poggianti 1997), C is the relevant rest-frame (B-I) colour and  is the luminosity distance. We assumed a fixed proportion of Sa (70%) and Sc (30%)in the field catalogue.
Various mock catalogues were generated at each cluster redshift 0.5, 1.0, 1.5, 2.0
corresponding to Abell (1958) richness classes 0, 1, 2, 3.
Figure 9 shows the galaxies belonging to a richness class 0 cluster, above a density threshold five times the average,
as seen at different redshifts and limiting magnitudes. Real cluster members and interlopers are represented by
filled dots and crosses respectively. For a limiting magnitude
= 25, the cluster is detected with an acceptable contamination
up to z=1, while z=1.5 may be assumed as a detection limit. However, in the case of a deeper survey, with
= 27
comparable with the new GOODS-MUSIC catalogue (Grazian et al. 2006), whose analysis is in progress, the same 0 richness cluster is well detected up to z=1.5 and still visible at z=2.
is the luminosity distance. We assumed a fixed proportion of Sa (70%) and Sc (30%)in the field catalogue.
Various mock catalogues were generated at each cluster redshift 0.5, 1.0, 1.5, 2.0
corresponding to Abell (1958) richness classes 0, 1, 2, 3.
Figure 9 shows the galaxies belonging to a richness class 0 cluster, above a density threshold five times the average,
as seen at different redshifts and limiting magnitudes. Real cluster members and interlopers are represented by
filled dots and crosses respectively. For a limiting magnitude
= 25, the cluster is detected with an acceptable contamination
up to z=1, while z=1.5 may be assumed as a detection limit. However, in the case of a deeper survey, with
= 27
comparable with the new GOODS-MUSIC catalogue (Grazian et al. 2006), whose analysis is in progress, the same 0 richness cluster is well detected up to z=1.5 and still visible at z=2.
Table 2:
LF parameters.
![\begin{figure}
\par\includegraphics[width=7.1cm,clip]{5384fig9.ps} \end{figure}](/articles/aa/full/2007/09/aa5384-06/Timg110.gif) |
Figure 9:
Galaxies above an environmental density
threshold 5 times the average, for redshifts 0.5, 1.0, 1.5 and 2.0 and for catalogues with two different limiting magnitudes.
Filled dots represent real members of the simulated richness class 0 clusters, while crosses represent interlopers. The contamination is reported in each panel. |
| Open with DEXTER |
Clearly the ability of the algorithm in separating the overdensities
increases with their richness and their angular distance.
Thus, to perform a conservative evaluation of the algorithm, we simulated
two relatively low density structures perfectly aligned along the line of sight.
We have considered pairs of overdensities, representing two richness 0 clusters as those described above. The first is at redshift
z=1.0 and the second at various higher redshifts.
We found that, depending on the chosen threshold, the two structures can be separated if the distance is greater then = 0.15. However, once N galaxies are assigned to a single
structure, the redshift of the latter can be determined with an accuracy of about
 ,
which can be an order of magnitude smaller than .
The above results refer to the possibility of resolving (aligned) structures.
It is worth noting that in real cases, once a (2+1)D density map is available,
it is possible to adopt a multi-threshold technique,
to identify possible physical substructures and/or projection effects.
,
which can be an order of magnitude smaller than .
The above results refer to the possibility of resolving (aligned) structures.
It is worth noting that in real cases, once a (2+1)D density map is available,
it is possible to adopt a multi-threshold technique,
to identify possible physical substructures and/or projection effects.
It is clear that many methods exist for detecting clusters, depending on the type of the available data: from single-band images, where only brightness can be used to complement angular positions in the identification of overdensities
like in matched filter methods (Postman et al. 1996),
to images in a few bands where colours allow to identify the cluster red sequence (Gladders et al. 1998), to images in several bands allowing the determination of photometric redshifts, to spectroscopic redshift.
Each method has his advantages and limitations. One of the main issues is our ability to compare
the results of numerical simulations with galaxy catalogues obtained from different data sets.
A general discussion of these problems has recently presented by Gal (2006).
To establish whether one method is more or less efficient respect to the another in detecting structures is not a straightforward task.
Given a mock catalogue, each method should be optimised, by a proper choice of the relevant parameters, to obtain
a meaningful comparison. Moreover, mock catalogues obtained by different assumptions on cosmic evolution of the spectral and
clustering properties of galaxies would lead to different optimisations.
The problem of using the photometric redshifts to identify structures in the galaxy distribution
has been tackled recently by Botzler et al. (2004) who discuss why standard FOF methods,suited for spectroscopic redshift
surveys, cannot be simply applied to photometric redshift surveys without a proper account of the large inherent uncertainties.
They propose an extended EXT-FOF method which applies a two-dimensional FOF algorithm to slices of the galaxy catalogue, which
are defined by photometric redshifts, taking into account their uncertainty.
Clearly photometric redshifts add crucial information for the identification of structures in the galaxy distribution
through the fitting of the observed spectral energy distribution to either theoretical or observed galaxy templates, evolving in cosmic time.
Here we propose and discuss a different way of using photometric information: instead of comparing the distance between galaxy pairs,
our method uses the statistical information about how many galaxies are in the neighbourhood of a given point and estimates a local
density without introducing a fixed smoothing scale.
A comparison of our method with EXT-FOF or other methods is beyond the aim of the present work and will be the subject of future investigations.
What we want to stress here are only the new informations we obtain with our method:
i) the spatial resolution is maximised in each point, since near density peaks the volume taken
into account to evaluate the density is small, while it becomes large where the density is low;
ii) once the density map is available, it can be analysed in different ways without re-running the
algorithm. For instance the map can be sliced at different density thresholds to see how structures
which appear separated at high density merge at lower densities.
In principle it is also possible to apply an harmonic analysis to density maps.
We have also obtained some new results
by applying our (2+1)D method to real data in the Chandra Deep Field South which is one of the most studied fields in the sky.
The existence of deep X-ray data from the Chandra observatory provided a sample of Active Galactic Nuclei (AGN) in the field (Giacconi et al. 2002).
The spectroscopic follow up has shown the existence of large-scale structure (Gilli et al. 2003). AGN, thanks to their intrinsic luminosity and
to strong emission lines, are the ideal tracers of the mass distribution at the maximum distance reachable by optical spectroscopy,
under the assumption that their spatial distribution mimics that of normal galaxies.
The same depth is either unreachable or requires huge exposure times for normal galaxies.
Photometric redshifts, though with the limitation imposed by their poor accuracy, permit to identify overdensities of normal galaxies at
the depth of AGN samples. This allows to study the relation between the space distribution of AGNs and galaxies.
In the case of the CDFS, our photo-z based density detects
two clusters, at
and ,
already identified in the spectroscopic redshift survey of Gilli et al. (2003). A third peak at  in the
galaxy density distribution likely corresponds to a peak which is found in the spectroscopic redshift distribution of AGNs but not
of galaxies. The analysis of deeper photometric data, which is in progress (Trevese et al. 2006), is necessary to confirm the reality of this structure.
Once galaxies belonging to a cluster are identified, it is possible to
study the galaxy type distribution as a function of the local density.
This provides an evidence of environmental effects on galaxy evolution and a way to quantify these effects. In the case of our analysis this allowed to
prove, in a cluster of redshift 0.7, that the fraction of red galaxies increases with density, as already known for lower redshift structures (Dressler 1980; and Dressler et al. 1997). A similar effect appears at redshift 1, though the evidence in this case is marginal. Clearly the density computed by our method is not the "real local density'',
due to the strong smoothing in the z direction caused by the redshift uncertainty and to the assumptions adopted to compensate the increasing loss of faint galaxies at high redshift. Thus any cosmological application
of our method, devoted to study the evolution in cosmic time of galaxy clusters properties and environmental effects,
will require a calibration through a detailed comparison with simulated catalogues.
Obviously the same is true for any other cluster finding technique.
However, there are properties of the cluster galaxy population which, to a first approximation, do not need a comparison with
mock catalogues to provide significant physical information. This is the case of the slope of the cluster red sequence
which has been traced up to z=1.27 (Blakeslee et al. 2003, and refs. therein).
According to Kodama et al. 1998 the evolution of the colour-magnitude (C-M) slope
depends on relative age variations in early-type
galaxies with different luminosities. Accordingly, the constancy of the slope up to redshift 1.27 is consistent with passive evolution of an old stellar population that was formed at high redshift. In this scenario, changes of the C-M relation slope
are expected at redshifts approaching the star formation phase.
An alternative interpretation of the constancy of the C-M relation,
in the framework of hierarchical models of galaxy formation, has been proposed by Kauffmann & Charlot (1998).
In this scenario metals, once formed, are more easily ejected from smaller disks. Large (bright) ellipticals are more metal-rich because they are formed from the mergers of large disks.
In selecting rich clusters at high redshift one is biasing samples towards objects that merged at the highest redshifts and for this reason they appear to follow the passive evolution.
In both scenarios the C-M relation is due to a mass-metallicity relation and the
evolution of the C-M slopes at high redshift contains critical informations
on the origin of the C-M slope itself.
Our analysis supports the evidence of a constant C-M slope up to z=1, meaning a correspondingly constant mass-metallicity relation.
We stress that most of the highest redshift clusters detected so far were selected in the X-ray band, in particular those at z=1.24 (Blakeslee et al. 2003; Rosati et al. 2004) and z=1.4 (Mullis et al. 2005).
However, both these clusters have a velocity dispersion of about 800 km s-1 and intracluster gas temperature kT
6 keV, typical of rich clusters (Bahcall 1988; Arnaud et al. 2005). The X-ray luminosities of these two clusters in the 0.5-2 keV band are 1.9
1044 and 3.0
1044 erg s-1
h70-2 respectively (Rosati et al. 2004; Mullis et al. 2005),
again typical of clusters with richness class greater than 2 (Ledlow et al. 2003).
Rich clusters of these redshifts are just at the limit of our present (2+1)D analysis based on photometric observations.
Work is in progress (Trevese et al. 2006) to extend the study to a deeper samples (KAB
27) which will allow the analysis at
even of poor structures of the type of those detected by photometric redshifts in the present work in the CDFS. These less pronounced structures are hardly detectable in X-rays, due to the strong
dependence on richness of the X-ray luminosity (Ledlow et al. 2003), and their C-M slope could differ from that of the richest clusters, if its constancy is only apparent and mainly produced by the cluster selection bias towards richer structures.
in the
galaxy density distribution likely corresponds to a peak which is found in the spectroscopic redshift distribution of AGNs but not
of galaxies. The analysis of deeper photometric data, which is in progress (Trevese et al. 2006), is necessary to confirm the reality of this structure.
Once galaxies belonging to a cluster are identified, it is possible to
study the galaxy type distribution as a function of the local density.
This provides an evidence of environmental effects on galaxy evolution and a way to quantify these effects. In the case of our analysis this allowed to
prove, in a cluster of redshift 0.7, that the fraction of red galaxies increases with density, as already known for lower redshift structures (Dressler 1980; and Dressler et al. 1997). A similar effect appears at redshift 1, though the evidence in this case is marginal. Clearly the density computed by our method is not the "real local density'',
due to the strong smoothing in the z direction caused by the redshift uncertainty and to the assumptions adopted to compensate the increasing loss of faint galaxies at high redshift. Thus any cosmological application
of our method, devoted to study the evolution in cosmic time of galaxy clusters properties and environmental effects,
will require a calibration through a detailed comparison with simulated catalogues.
Obviously the same is true for any other cluster finding technique.
However, there are properties of the cluster galaxy population which, to a first approximation, do not need a comparison with
mock catalogues to provide significant physical information. This is the case of the slope of the cluster red sequence
which has been traced up to z=1.27 (Blakeslee et al. 2003, and refs. therein).
According to Kodama et al. 1998 the evolution of the colour-magnitude (C-M) slope
depends on relative age variations in early-type
galaxies with different luminosities. Accordingly, the constancy of the slope up to redshift 1.27 is consistent with passive evolution of an old stellar population that was formed at high redshift. In this scenario, changes of the C-M relation slope
are expected at redshifts approaching the star formation phase.
An alternative interpretation of the constancy of the C-M relation,
in the framework of hierarchical models of galaxy formation, has been proposed by Kauffmann & Charlot (1998).
In this scenario metals, once formed, are more easily ejected from smaller disks. Large (bright) ellipticals are more metal-rich because they are formed from the mergers of large disks.
In selecting rich clusters at high redshift one is biasing samples towards objects that merged at the highest redshifts and for this reason they appear to follow the passive evolution.
In both scenarios the C-M relation is due to a mass-metallicity relation and the
evolution of the C-M slopes at high redshift contains critical informations
on the origin of the C-M slope itself.
Our analysis supports the evidence of a constant C-M slope up to z=1, meaning a correspondingly constant mass-metallicity relation.
We stress that most of the highest redshift clusters detected so far were selected in the X-ray band, in particular those at z=1.24 (Blakeslee et al. 2003; Rosati et al. 2004) and z=1.4 (Mullis et al. 2005).
However, both these clusters have a velocity dispersion of about 800 km s-1 and intracluster gas temperature kT
6 keV, typical of rich clusters (Bahcall 1988; Arnaud et al. 2005). The X-ray luminosities of these two clusters in the 0.5-2 keV band are 1.9
1044 and 3.0
1044 erg s-1
h70-2 respectively (Rosati et al. 2004; Mullis et al. 2005),
again typical of clusters with richness class greater than 2 (Ledlow et al. 2003).
Rich clusters of these redshifts are just at the limit of our present (2+1)D analysis based on photometric observations.
Work is in progress (Trevese et al. 2006) to extend the study to a deeper samples (KAB
27) which will allow the analysis at
even of poor structures of the type of those detected by photometric redshifts in the present work in the CDFS. These less pronounced structures are hardly detectable in X-rays, due to the strong
dependence on richness of the X-ray luminosity (Ledlow et al. 2003), and their C-M slope could differ from that of the richest clusters, if its constancy is only apparent and mainly produced by the cluster selection bias towards richer structures.
We have presented a new method to detect local overdensities in the galaxy distribution,
based on: i) photometric redshifts, with proper account of the
relevant uncertainty, to evaluate distance; ii) distance to the nth neighbour to evaluate densities. From a methodological point of view, we can conclude that:
From an astrophysical point of view, our analysis of deep multiband photometry in the CDFS field allows the following conclusions:
-
We have detected two structures at redshifts 0.7 and 1.0, whose existence was known from previous spectroscopic studies.
-
A third structure at redshift 1.5 has also been detected but requires deeper data for confirmation.
-
The fraction of red galaxies inside the structure at z=1 indicates a marginal density dependence
while in the structure at z=0.7 the increase of the red fraction with density is seen very clearly; this extends the results of Dressler et al. (1997), Carlberg et al. (2001), and Tanaka et al. (2005).
-
Our results add new evidence in favour of constant slope of the C-M relation in clusters, at least up to z=1 implying a constant mass-metallicity relation, according to the standard interpretations.
-
Our analysis shows that the average C-M relation
for galaxies belonging to the red population is consistent with a linear extrapolation of the
relation found by Bell et al. (2004) up to z=1.5, complementing the results
of Giallongo et al. (2005), who have shown that the
blueing of the average colour of the red galaxies extends to
 .
.
- The use of photometric redshifts will allow to analyse the redshift dependence
of the C-M relation at high redshift, even in moderate overdensities, providing constraints on the very origin of the C-M relation.
Thus, in spite of the low resolution in distance, (2+1)D analysis based on photometric redshift
is an extremely valuable tool to complement other cluster finding techniques and perform large scale structure studies based on photometric surveys which, at present, posses unique capabilities
in combining depth and field width.
Acknowledgements
We thank the anonymous referee for valuable comments and suggestions.
We are grateful to Andrea Grazian and Sara Salimbeni for providing advise and assistance in the use of photometric and spectroscopic catalogues.
- Abell, G. O. 1958, ApJS,
3, 211 [CrossRef] (In the text)
- Arnaud, M.,
Pointecouteau, E., & Pratt, G. W. 2005, A&A, 441, 893 [CrossRef] [EDP Sciences] (In the text)
- Arimoto, N., & Yoshii, Y.
1987, A&A, 188, 13 (In the text)
- Bahcall, N. A. 1988,
ARA&A, 26, 631 (In the text)
- Balogh, M., Eke, V.,
Miller, C., et al. 2004, MNRAS, 348, 1355
- Bell, E. F., Wolf, C.,
Meisenheimer, K., et al. 2004, ApJ, 608, 752 [CrossRef] (In the text)
- Blakeslee, J. P., Franx,
M., Postman, M., et al. 2003, ApJ, 596, L143 [CrossRef] (In the text)
- Botzler, C. S., Snigula,
J., Bender, R., & Hopp, U. 2004, MNRAS, 349, 425 (In the text)
- Bower, R. G., Lucey, J.
R., & Ellis, R. S. 1992, MNRAS, 254, 601 (In the text)
- Carlberg, R. G., Yee, H.
K. C., Morris, S. L., et al. 2001, ApJ, 563, 736 [CrossRef] (In the text)
- Cimatti, A., Daddi, E.,
& Mignoli, M. 2002a, A&A, 381, L68 [CrossRef] [EDP Sciences] (In the text)
- Cimatti, A., Mignoli,
M., Daddi, E., et al. 2002b, A&A, 392, 395 [CrossRef] [EDP Sciences] (In the text)
- Connolly, A. J.,
Csabai, I., Szalay, A. S., et al. 1995, AJ, 110, 2655 [CrossRef] (In the text)
- De Propris, R., Colless,
M., Driver, S. P., et al. 2003, MNRAS, 342, 725 (In the text)
- Dressler, A. 1980, AJ,
236, 351 [CrossRef] (In the text)
- Dressler, A., Oemler,
A. Jr., Couch, W. J., et al. 1997, ApJ, 490, 577 [CrossRef] (In the text)
- Fontana, A., D'Odorico, S.,
Poli, F., et al. 2000, AJ, 120, 2206 [CrossRef] (In the text)
- Gal, R. R. 2006
[arXiv:astro-ph/0601195]
(In the text)
- Giallongo, E.,
D'Odorico, S., Fontana, A., et al. 1998, AJ, 115, 2169 [CrossRef] (In the text)
- Giallongo, E.,
Salimbeni, S., Menci, N., et al. 2005, ApJ, 622, 116 [CrossRef] (In the text)
- Giacconi, R., Zirm, A.,
& Wang, J. 2002, ApJS, 139, 369 [CrossRef] (In the text)
- Gilli, R., Cimatti, A.,
Daddi, E., et al. 2003, ApJ, 592, 721 [CrossRef] (In the text)
- Girardi, M., Giuricin, G.,
Mardirossian, F., Mezzetti, M., & Boschin, W. 1998, ApJ, 505,
74 [CrossRef] (In the text)
- Gladders, M. D.,
Lopez-Cruz, O., Yee, H. K. C., & Kodama, T. 1998, ApJ, 501,
571 [CrossRef] (In the text)
- Gomez, P. L., Nichol, R.
C., Miller, C. J., et al. 2003, ApJ, 584, 210 [CrossRef] (In the text)
- Goto, T., Yagi, M., Tanaka,
M., & Okamura, S. 2004, MNRAS, 348, 515 (In the text)
- Grazian, A., Fontana, A.,
De Santis, C., et al. 2006, A&A, 449, 951 [CrossRef] [EDP Sciences] (In the text)
- Heisler, J.,
Tremaine, S., & Bahcall, J. N. 1985, ApJ, 298, 8 [CrossRef] (In the text)
- Hogg, D. W. 2000
[arXiv:astro-ph/9905116]
(In the text)
- Huchra, J., &
Geller, M. 1982, ApJ, 257, 423 [CrossRef] (In the text)
- Kauffmann, G., &
Charlot, S. 1998, MNRAS, 294, 705 (In the text)
- Kodama, T., Arimoto,
N., Barger, A. J., & Aragón-Salamanca, A. 1998, A&A,
334, 99 (In the text)
- Lanzetta, K. M., Yahil,
A., & Fernández-Soto, A. 1996, Nature, 381, 759 [CrossRef] (In the text)
- Ledlow, M. J., Voges,
W., Owen, Frazer N., & Burns, J. O. 2003, AJ, 126, 2740 [CrossRef] (In the text)
- Lumsden, S. L., Nichol, R.
C., Collins, C. A., & Guzzo, L. 1992, MNRAS, 258, 1 (In the text)
- Menci, N., Fontana, A.,
Giallongo, E., et al. 2005, ApJ, 632, 49 [CrossRef]
- Mullis, C. R., Rosati,
P., Lamer, G., et al. 2005, ApJ, 623L, 85 [CrossRef] (In the text)
- Poggianti, B. M. 1997,
A&AS, 122, 399 (In the text)
- Poli, F., Giallongo, E.,
Fontana, A., et al. 2003, ApJ, 593, L1 [CrossRef] (In the text)
- Postman, M., Lubin,
L. M., Gunn, J. E., et al. 1996, AJ, 111, 615 [CrossRef] (In the text)
- Rosati, P., Tozzi, P.,
Ettori, S., et al. 2004, AJ, 127, 230 [CrossRef] (In the text)
- Sarazin, C. L. 1988, X-ray
Emission from Clusters of Galaxies (Cambridge: Cambridge University
Press)
(In the text)
- Schechter, P. 1976,
ApJ, 203, 297 [CrossRef] (In the text)
- Strateva, I., Ivezic, Z.,
Knapp, G. R., et al. 2001, AJ, 122, 1861 [CrossRef] (In the text)
- Tanaka, M., Kodama, T.,
Arimoto, N., et al. 2005, MNRAS, 362, 268 (In the text)
- Trevese, D., et al. 2006,
in preparation
(In the text)
- York, D. G., Adelman, J.,
Anderson, J. E. Jr., et al. 2000, AJ, 120, 1579 [CrossRef] (In the text)
- Zwicky, F., Herzog, E., &
Wild, P. 1961, Catalogue of Galaxies and of Clusters of Galaxies
(Pasadena: California Institute of Technology (CIT))
(In the text)
Copyright ESO 2007

![\begin{figure}
\par\includegraphics[width=7.3cm,clip]{5384fig1.ps}\end{figure}](/articles/aa/full/2007/09/aa5384-06/img51.gif)
![\begin{figure}
\par\includegraphics[width=7cm,clip]{5384fig6.ps} \end{figure}](/articles/aa/full/2007/09/aa5384-06/img88.gif)
![\begin{eqnarray*}\Phi(M,z){\rm d}M \!=\! 0.4{\rm ln}10\phi^{\ast}(z)[10^{0.4(M^{\ast}(z)-M)}]^{1+\alpha}\exp[\!-\!10^{0.4(M^{\ast}(z)-M)}], \end{eqnarray*}](/articles/aa/full/2007/09/aa5384-06/img91.gif)
![\begin{eqnarray*}n(r)=n_0[1+(r/r_{\rm c})^2]^{-3/2}
\end{eqnarray*}](/articles/aa/full/2007/09/aa5384-06/img94.gif)
![\begin{figure}
\par\includegraphics[width=7.1cm,clip]{5384fig9.ps} \end{figure}](/articles/aa/full/2007/09/aa5384-06/img110.gif)