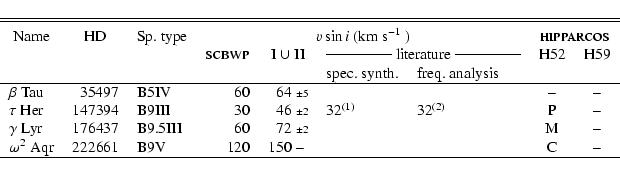
Table 1:
Highlight on the four common stars between Slettebak et al. (1975,
SCBWP), Abt et al. (2002) and Papers I and II (standard deviation is
indicated; dash "-'' stands for only one measurement) and comparison
with data from the literature.
 from the literature are classified in three subgroups according to the way they are derived: by-product of a spectrum synthesis or frequency analysis of the lines profiles. Flags from HIPPARCOS catalog are indicated:
variability flag H52 (C: constant, D: duplicity-induced variability,
M: possibly micro-variable, P: periodic variable, -: no certain
classification) and double annex flag H59 (C: component solution, -: no entry in the Double and Multiple Systems Annex).
from the literature are classified in three subgroups according to the way they are derived: by-product of a spectrum synthesis or frequency analysis of the lines profiles. Flags from HIPPARCOS catalog are indicated:
variability flag H52 (C: constant, D: duplicity-induced variability,
M: possibly micro-variable, P: periodic variable, -: no certain
classification) and double annex flag H59 (C: component solution, -: no entry in the Double and Multiple Systems Annex).
|
(1) Adelman (1988); (2) Smith & Dworetsky (1993).
|
Source LaTeX |
All tables |
In the text