A&A 461, 911-916 (2007)
DOI: 10.1051/0004-6361:20066349
J.-G. Cuby1 - P. Hibon1,2 - C. Lidman2 - O. Le Fèvre1 - R. Gilmozzi3 - A. Moorwood3 - P. van der Werf4
1 - Laboratoire d'Astrophysique de Marseille, BP 8, 13376 Marseille
Cedex 12, France
2 -
European Southern Observatory, Alonso de Cordova 3107, Vitacura,
Casilla 19001, Santiago 19, Chile
3 -
European Southern Observatory, Karl-Schwarzschild-Str. 2,
85748 Garching, Germany
4 -
Leiden Observatory, PO Box 9513, 2300 RA Leiden, The Netherlands
Recieved 5 September 2006 / Accepted 12 October 2006
Abstract
Aims. The first star forming galaxies in the early universe should be copious Ly![]() emitters and may play a significant role in ionizing the intergalactic medium (IGM). It has been proposed that the luminosity function of Ly
emitters and may play a significant role in ionizing the intergalactic medium (IGM). It has been proposed that the luminosity function of Ly![]() emitting galaxies beyond z
emitting galaxies beyond z ![]() 6 may be used to constrain the neutral fraction of the IGM during this epoch. In this work we report on a search for Ly
6 may be used to constrain the neutral fraction of the IGM during this epoch. In this work we report on a search for Ly![]() emitters at redshift 8.8.
emitters at redshift 8.8.
Methods. We performed a narrow band imaging programme using ISAAC at the ESO VLT. Seven fields, covering a total area of 31 sq. arcmin and for which optical and broad band infra-red images have been obtained in the GOODS survey, were imaged to a limiting flux (respectively luminosity) of ![]() 1.3
1.3 ![]() 10-17 erg s-1 cm-2 (respectively
10-17 erg s-1 cm-2 (respectively ![]() 1.3
1.3 ![]() 1043 erg s-1) in a narrow band filter centered in a region of low OH sky emission at 1.19
1043 erg s-1) in a narrow band filter centered in a region of low OH sky emission at 1.19 ![]() m. Candidate Ly
m. Candidate Ly![]() emitters are objects that are detected in the ISAAC NB images and undetected in the visible broad band images.
emitters are objects that are detected in the ISAAC NB images and undetected in the visible broad band images.
Results. No z=8.8 Ly![]() emitting galaxies were detected to a limit approaching recent estimates of the luminosity function at
emitting galaxies were detected to a limit approaching recent estimates of the luminosity function at ![]() .
Our results do suggest, however, that detections or substantial constraints could be achieved by this method in the near future with larger field instruments planned for various telescopes.
.
Our results do suggest, however, that detections or substantial constraints could be achieved by this method in the near future with larger field instruments planned for various telescopes.
Key words: galaxies: luminosity function, mass function - cosmology: early Universe
The reionisation of the universe is intricately linked to the formation of the first objects. While observations of high redshift QSOs indicate that the end of reionisation occurred around a redshift of 6 (Fan et al. 2002), the measurement of the optical depth to electron scattering in the Wilkinson Microwave Anisotropy Probe (WMAP) three year results indicates that the universe was partially ionised up to significantly higher redshifts (Spergel et al. 2006; Page et al. 2006). Hence, the current data point to an extended period of reionisation, ending at a redshift of 6 and extending to redshifts well above 10.
The objects that cause reionisation need not be the same throughout this period. A plausible model that matches the WMAP three year data is a model in which Population II and Population III objects contribute equally to reionisation (Wyithe & Cen 2006). In this model, the ionised fraction stays approximately constant over the redshift interval z=7-12. However, other models, leading to quite different ionised fractions in this redshift interval, are also possible, so observational constraints on the fraction of ionised gas are now quite important.
The first star forming objects in the universe should be copious
emitters in Ly![]() and may play a significant role in ionising the
intergalactic medium (IGM). It has been proposed that the luminosity
function of Ly
and may play a significant role in ionising the
intergalactic medium (IGM). It has been proposed that the luminosity
function of Ly![]() emitters (LAEs) may be used to constrain the
neutral fraction of the IGM when the neutral fraction is as high as
30% (Malhotra & Rhoads 2004), since the red wing of the Gunn-Peterson
trough should attenuate the Ly
emitters (LAEs) may be used to constrain the
neutral fraction of the IGM when the neutral fraction is as high as
30% (Malhotra & Rhoads 2004), since the red wing of the Gunn-Peterson
trough should attenuate the Ly![]() line. As a comparison, the
Gunn-Peterson trough measured blueward of the Ly
line. As a comparison, the
Gunn-Peterson trough measured blueward of the Ly![]() line
saturates when the neutral fraction reaches 1% (Fan et al. 2002).
line
saturates when the neutral fraction reaches 1% (Fan et al. 2002).
Current results on the luminosity function of LAE at z=6.5 are contradictory. While Malhotra & Rhoads (2004) and Taniguchi et al. (2005) find no evidence for evolution in the LAE luminosity function between z=5.7and and z=6.5, thus suggesting that the universe was still largely reionised at z=6.5, Kashikawa et al. (2006) find significant evolution.
Narrow-band, wide-field imaging surveys are an efficient and effective method of discovering LAEs. The narrow band filters are designed to cover regions where the night sky background is low. This naturally leads to surveys occurring at discrete redshifts, such as z=3.4, corresponding to 5390 Å (Cowie & Hu 1998); z=4.5, corresponding to 6740 Å (Malhotra & Rhoads 2002; Hu et al. 1998); z=5.7, corresponding to 8150 Å (Shimasaku et al. 2006; Westra et al. 2006; Rhoads et al. 2003; Hu et al. 2004; Ajiki et al. 2006) and z=6.5, corresponding to 9200 Å (Kodaira et al. 2003; Hu et al. 2002b; Cuby et al. 2003; Hu et al. 2002a; Taniguchi et al. 2005).
To detect Lyman alpha emitters (LAE) at still higher redshifts, one
has to move into the near IR. The next two windows that are relatively
free of bright OH lines occur at 1.06 ![]() m and 1.19
m and 1.19 ![]() m, and
correspond to LAEs at z=7.7 and z=8.8, respectively. In a pioneering study, Willis & Courbin (2005) used ISAAC on Antu (VLT-UT1) to
image a single field in the Hubble Deep Field South with a narrow band
filter centred 1.19
m, and
correspond to LAEs at z=7.7 and z=8.8, respectively. In a pioneering study, Willis & Courbin (2005) used ISAAC on Antu (VLT-UT1) to
image a single field in the Hubble Deep Field South with a narrow band
filter centred 1.19 ![]() m. In a volume of
m. In a volume of
![]() they find no LAEs brighter than the survey limit of
they find no LAEs brighter than the survey limit of
![]() .
.
In this paper, we complement the work of Willis & Courbin (2005) by using
the same instrument and filter to image a wider region of the sky to a brighter survey limit. In Sects. 2 and 3, we describe the new narrow
band IR imaging data obtained in this survey and how we combine these
data with broad band optical and IR data from the GOODS survey to
search for LAEs at z=8.8. In Sect. 4, we describe spectroscopic
follow-up of our most promising candidate, and in Sect. 5 we
estimate the likelihood of detecting supernovae and solar system
objects as false candidates. In Sect. 6, we place limits on the
z=8.8 luminosity function, and we discuss the
possibility of extending this study over a wider area. Throughout this
paper we use a flat ![]() CDM model with
CDM model with
![]() and
and
![]() to compute distances and volumes.
to compute distances and volumes.
We used the short wavelength (SW) arm of ISAAC (Moorwood et al. 1998) on
Antu (VLT-UT1) to image selected fields with the ISAAC narrow band
filter centred at 1.19 micron. The detector in the SW arm of ISAAC is
a Hawaii HgCdTe array, the pixel scale is 0
![]() 148 and the field-of-view is
2
148 and the field-of-view is
2
![]() 5 by 2
5 by 2
![]() 5.
5.
All the data were taken in service mode over a period lasting several months. The observations started on 2004 November 13 and finished on 2005 March 21 and occurred on 20 different nights.
To ensure background limited performance, each exposure lasted
approximately 20 min. After each exposure, the telescope was
offset by approximately 20
![]() and a new exposure taken. This
sequence was repeated while conditions were good enough and typically
3 to 6 exposures were taken on any given night.
and a new exposure taken. This
sequence was repeated while conditions were good enough and typically
3 to 6 exposures were taken on any given night.
We targeted seven ISAAC fields within the Chandra Deep Field South (CDF-S) field covered by the Great Observatories Origins Deep Survey (GOODS). A list of the fields and the corresponding exposure times and limiting magnitudes are given in Table 1. The total area of the survey (defined as being the sum of the areas that were continuously imaged) was 31 square arc minutes. This area has been extensively studied at multiple wavelengths - from the X-ray to the mid-IR. For the purposes of this study we make use of publicly available near-IR (VLT/ISAAC) (version 1.5) and optical (HST/ACS) data (version 1.0).
Table 1:
The fields observed and their coordinates, the exposure
times, the magnitude at which the narrow band data are 50% complete
and the image quality of the stacked images. All magnitudes are in
Vega and have been corrected to 4
![]() diameter apertures. The 90%
completeness limit is approximately 0.5 mag brighter. The field
names correspond to those used at http://www.eso.org/science/goods/.
diameter apertures. The 90%
completeness limit is approximately 0.5 mag brighter. The field
names correspond to those used at http://www.eso.org/science/goods/.
Apart from the removal of the background, the methods used to reduce the ISAAC narrow band data were standard. A dark frame was first subtracted and a twilight flatfield applied. The removal of the background was non-standard and had to be done in two steps. Usually, when processing data in the near IR, the background of any particular frame is estimated by averaging the frames that are taken immediately before and after the frame in question. To maximize the signal-to-noise ratio, one should use as many frames as possible, but this is limited either by the number of frames that are available or by the timescale over which the background varies. In these data, the large scale component of the background was varying with a timescale that was similar to the length of the exposure.
The reason for the variation is that, within the field of view of ISAAC, the central wavelength of the narrow-band filter transmission curve varies. In the upper part of the field, light from OH lines pass through the shifted filter band pass. Since the intensity of OH lines can vary considerably over a period of a few minutes and since exposures were relatively long (20 min), there was considerable variation in the large scale background, especially in the upper part of the array.
In addition to the relative rapid changes in the background, sometimes, there were as few as three frames taken consecutively, so, in principle, one had only two frames to use as sky.
In order to remove the background adequately and to maximize the signal-to-noise ratio in the background subtracted images, we first removed the large scale shape of the background in individual frames by applying a median filter with a box size of 200 pixels to each image and by subtracting the result. Once the large scale shape is removed, we then collect all the data for a given field, even if it was taken on different nights, and follow the standard procedure of background subtraction that is descibed above. This unusual approach only works if the small scale variations (including pixel-to-pixel variations) are stable over the time the data are taken. This appears to be the case for these data as the pixel-to-pixel noise in the reduced data is within a few percent of the theoretical expectation.
We used the XDIMSUM package in IRAF![]() to do
the background subtraction as it allows object and bad pixel masking
when computing the background frames. Typically, a background frame is
made up of 15 to 20 frames.
to do
the background subtraction as it allows object and bad pixel masking
when computing the background frames. Typically, a background frame is
made up of 15 to 20 frames.
The alternative of subtracting the backgound first and then removing any large scale residuals with a median filter proved to be unsatisfactory, as objects, variable pixels and cosmic rays cannot be properly identified by the XDIMSUM software when the background variation between frames is as large as it was in these data.
The background subtracted images were then corrected for field
distortion, using the field distortion coefficients available from the
ISAAC web pages![]() ,
registered, combined and astrometrically aligned to the broad band
ISAAC and ACS images. Because some of these steps involve
interpolation, the pixel-to-pixel noise in the fully reduced images is
a few percent less than the value one would derive from the mean level
of the background.
,
registered, combined and astrometrically aligned to the broad band
ISAAC and ACS images. Because some of these steps involve
interpolation, the pixel-to-pixel noise in the fully reduced images is
a few percent less than the value one would derive from the mean level
of the background.
We used the SExtractor (Bertin & Arnouts 1996) software in single image mode to detect and measure objects in the ISAAC narrow band images and in the ISAAC and ACS broad band images. We created one catalogue per filter per field and we then used our own software to match the catalogues in sky coordinates. The matching radius was set to between 0.2 and 0.4 arcsec, depending on the field.
The magnitudes were first computed for apertures of 8 pixels in
diameter and were then corrected to apertures of 4
![]() in diameter
by applying an aperture correction that was computed from bright
unsaturated stars.
in diameter
by applying an aperture correction that was computed from bright
unsaturated stars.
The limiting magnitude of the narrow band data can be estimated by
comparing the number of detections in the narrow band image with the
number of detections in the much deeper ISAAC J-band image. Since the
ISAAC image is much deeper and since
![]() for most
objects, objects detected in the narrow band filter should also be
detected in J. By plotting the ratio of the number of objects seen in
both the narrow band image and the J-band image over the number of
objects seen in the J-band image, one can get an estimate of the
completeness. An example for one of the fields is shown in
Fig. 1. The completeness limit is defined as
the magnitude at which the narrow band data is 50% complete and is
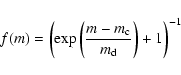
estimated by fitting the function
for most
objects, objects detected in the narrow band filter should also be
detected in J. By plotting the ratio of the number of objects seen in
both the narrow band image and the J-band image over the number of
objects seen in the J-band image, one can get an estimate of the
completeness. An example for one of the fields is shown in
Fig. 1. The completeness limit is defined as
the magnitude at which the narrow band data is 50% complete and is
estimated by fitting the function
![\begin{figure}
\par\includegraphics[height=11.8cm,width=8cm,clip]{6349fig1.eps} \end{figure}](/articles/aa/full/2007/03/aa6349-06/img18.gif) |
Figure 1: Panel a): a comparison of the number of objects detected in the J-band image (solid line), in both the narrow band and J band images (dashed line), and in the narrow band image alone (dot-dashed line). Panel b): a histogram of the completeness function of objects detected in the narrow band filter. The histogram corresponds to the ratio between the dashed and solid lines in the upper panel. The dotted line is a fit to the histogram using Eq. (1). |
| Open with DEXTER | |
Objects that are detected only in the narrow band image are either
line emitting objects with large equivalent widths, extremely red
objects or false detections. In Fig. 1, these
objects are plotted in dot-dashed line. Their number does not become
significant until one passes the 50% completeness limit. Beyond this
limit, most objects that are only seen in the narrow band image are
probably false. So we choose this limit as the limit of our survey.
With the exception of field F15, which is significantly shallower than
the other fields, the average limiting magnitude is 23.3,
corresponding to a flux (resp. luminosity) limit of ![]() 1.3
1.3 ![]() 10-17 erg s-1 cm-2 (resp.
10-17 erg s-1 cm-2 (resp. ![]() 1.3
1.3 ![]() 1043 erg s-1). The flux and luminosity limits do not account for partial line transmission effects.
1043 erg s-1). The flux and luminosity limits do not account for partial line transmission effects.
Lyman alpha emitting candidates are selected using the following criteria. They should be
After this careful refinement of the candidate list, we were left with
no objects that were brighter than the 50% detection limit, and two candidates fainter than this limit, both only visible in the
NB1190 image. In view of the limiting magnitudes of the J and NB images, this corresponds to
![]() 1.5, which in turn
corresponds to objects with observed (resp. rest-frame) equivalent
widths
1.5, which in turn
corresponds to objects with observed (resp. rest-frame) equivalent
widths
![]() Å (resp.
Å (resp.
![]() Å)
which are acceptably large values for a very high redshift starburst galaxy.
Å)
which are acceptably large values for a very high redshift starburst galaxy.
Even though the magnitude of the two candidate were fainter than the 50% completeness limit, we decided to observe the most promising one ( NB1190=23.9 and S/N=3 in the F21 field) with SINFONI with the aim of verifying that the object was real.
We used SINFONI on Yepun (VLT-UT4) on the night of 2005 October 31 to
observe the most promising candidate in the survey. SINFONI is a near
infrared integral field spectrograph (Eisenhauer et al. 2003) that can
be fed with an adaptive optics (AO) corrected beam. Since there were no
bright stars near to the candidate, we used SINFONI without AO. We
used the 8
![]() field-of-view, resulting in a pixel scale of
0
field-of-view, resulting in a pixel scale of
0
![]() 125 perpendicular to the image slicer. The image slicer splits
the field-of-view into 32 slices, so each slice is 0
125 perpendicular to the image slicer. The image slicer splits
the field-of-view into 32 slices, so each slice is 0
![]() 25 wide. The 32 slices were dispersed with the J-band grating and imaged onto a Hawaii 2k
25 wide. The 32 slices were dispersed with the J-band grating and imaged onto a Hawaii 2k ![]() 2k detector. The resulting spectra start at 10 950 Å and effectively end at the beginning of the strong telluric
absorption feature that starts at
2k detector. The resulting spectra start at 10 950 Å and effectively end at the beginning of the strong telluric
absorption feature that starts at ![]() 13 500 Å. The resolution of
the spectra is about 2000.
13 500 Å. The resolution of
the spectra is about 2000.
Individual exposures lasted 900 s, which is long enough to be
detector dark noise limited at 1.19 microns. A single observing
sequence consists of four such exposures with the object dithered
within the 8
![]() field-of-view. At the end of the sequence, a nearby star, which was used to verify the pointing, was observed. This sequence was repeated 6 times and results in a total integration time of 21 600 s.
field-of-view. At the end of the sequence, a nearby star, which was used to verify the pointing, was observed. This sequence was repeated 6 times and results in a total integration time of 21 600 s.
The observing and reduction strategies were designed to maximise the
signal-to-noise ratio of a point-like emission line object. The first step in the reduction process was to create a 2 dimensional sky frame
for each exposure. For any given exposure, the corresponding sky frame
was made from the average of the 6 other frames. Thus, instead of
reducing the optimal signal-to-noise ratio by a factor ![]() ,
which
would be the case if the sky subtraction was done on the basis of
image pairs, the signal-to-noise ratio is reduced by
,
which
would be the case if the sky subtraction was done on the basis of
image pairs, the signal-to-noise ratio is reduced by ![]() 8%. The maximum
number of frames that one can use for a sky is limited by instrument
flexure. We found that 6 frames, taken over a period of two hours, was
the best compromise between maximising the signal-to-noise ratio and
minimising the residuals caused by flexure.
8%. The maximum
number of frames that one can use for a sky is limited by instrument
flexure. We found that 6 frames, taken over a period of two hours, was
the best compromise between maximising the signal-to-noise ratio and
minimising the residuals caused by flexure.
The sky-subtracted data were then flat fielded and sectioned into 32 images, one for each slice. The 2 dimensional sky subtraction is not perfect because, as a function of wavelength, the relative intensity of the IR night sky varies with time. Night sky residuals were removed by fitting and subtracting low order polynomials along the spatial direction of the slices.
The resulting 2 dimensional sky-subtracted data were then registered and averaged to produce a 2 dimensional co-added frame. A one square arc second region was then extracted from the co-added frame to produce a 1 dimensional spectrum that was then wavelength and flux calibrated.
After six hours of integration, no emission line was detected. Our 5 sigma detection limit over a one square arc-second aperture is 1.5 ![]()
![]() ,
or 3.0
,
or 3.0 ![]()
![]() if we integrate over 6 Angstroms (4 pixels). From the magnitude of the candidate, we expected a flux of 7.0
if we integrate over 6 Angstroms (4 pixels). From the magnitude of the candidate, we expected a flux of 7.0 ![]()
![]() .
We conclude that our best candidate was
either spurious or a transient object (see next section).
.
We conclude that our best candidate was
either spurious or a transient object (see next section).
Since the narrow band and broad band data were taken at different times, it is possible for transient objects to appear in one filter and not another. Our candidate selection is based on finding sources that can only be seen in the ISAAC narrow band images. Therefore, transient objects that are brighter than the narrow band detection limit will be considered as candidates if they are not visible in the broad band images. We consider two transients that might contaminate the survey: supernovae and bodies in the solar system.
A few of the fields were observed at a time when the angular motion of distant solar system bodies as seen from the Earth can be very low. In individual exposures, which typically last 20 min, such objects may appear point-like. Since the total exposure times were long and since the observations were done in service, the data were taken during different nights. For field 21, the time over which the data were taken spans 4 days; for field 16 it took 6 weeks to collect the data. This, together with the location of the fields, which are 45 degrees from the ecliptic, means that it is very unlikely that we would mistakenly identify a distant body in the solar system as a high redshift galaxy. When the data are combined, objects in the solar system will either be rejected when clipping for cosmic rays or appear as trailed irregular-looking sources. In either case, it is sufficient to split the data into subsets that are based on the date of the exposure to test if a candidate is moving or stationary. We have done this for all our initial candidates and no moving targets were identified.
At the flux limit of the survey, distant supernovae can be visible for several weeks, so supernovae are a potential source of contamination. We computed the expected number of Type Ia and Type II supernovae that would be visible in our narrow band ISAAC images by using the rates published in Hopkins & Beacom (2006). Even though Type II supernova are approximately 5 times more numerous than Type Ia supernova, they are, on average, 2.5 mag fainter (Filippenko 1997), so Type Ia supernovae dominate the expected counts. Using a magnitude limit of 23.5 in the narrow band filter, we would need approximately 100 square arc minutes to detect one Type Ia supernova. This is only three times the area covered in our survey, so it is possible that there are Type Ia supernova that are visible to the limit of the survey. However, Type Ia supernova are usually close to their host galaxies. Since most of these hosts would be detected in our broad band images, most Type Ia supernovae would not be selected as candidates. There are, however, a number of supernova that are considered as hostless. I.e. to the limit at which imaging data is available, no host is visible. From Table 4 in Lidman et al. (2005) one estimates that 1 in 10 high redshift Type Ia supernova can be considered as hostless. However, the GOODS ACS imaging data is considerably deeper than what is usually taken when following high redshift supernovae, so the fraction of hostless Type Ia supernova is likely to be even less than 1 in 10.
![\begin{figure}
\par\includegraphics[angle=-90,width=8.15cm,clip]{6349fig2.ps}\end{figure}](/articles/aa/full/2007/03/aa6349-06/img26.gif) |
Figure 2: Luminosity function of LAEs at z = 5.7 (dashed line, Shimasaku et al. 2006) and z = 6.5 (plain line, Kashikawa et al. 2006). Square: Willis & Courbin (2005), Circle: this work, Triangle: on-going survey at CFHT targeting z = 7.7 LAEs. Data points have not been corrected for completeness. Extrapolation of the LF to higher z (z > 7), assuming the same evolution from z=6.5 as between z=5.7 and z=6.5 is shown for illustration. |
| Open with DEXTER | |
Although it is very unlikely that we would have selected a supernova of any type as a candidate in our survey, we cannot completely rule it out. In surveys that cover larger areas or use less extensive broad band imaging, contamination from transients such as supernova or more unusual events, such as the one recently discovered in Bootes (Dawson et al. 2006), might occur, so strategies to avoid this contamination, such as taking the narrow band data over several epochs separated by several months, should be considered.
No Ly![]() emitters at z
emitters at z ![]() 8.8 have been found in 31 arcmin2down to
8.8 have been found in 31 arcmin2down to ![]() 1.3
1.3 ![]() 10-17 erg s-1 cm-2. Our results
complement the work of Willis & Courbin (2005) who performed similar
observations with the same filter and instrument, however with
different survey area and depth.
10-17 erg s-1 cm-2. Our results
complement the work of Willis & Courbin (2005) who performed similar
observations with the same filter and instrument, however with
different survey area and depth.
From a large sample of 58 Ly![]() emitters (LAEs) including 17 spectroscopic confirmations, Kashikawa et al. (2006) have established
the luminosity function of z = 6.5 LAEs. Similarly, Shimasaku et al. (2006) have
established the luminosity function (LF) of z = 5.7 Ly
emitters (LAEs) including 17 spectroscopic confirmations, Kashikawa et al. (2006) have established
the luminosity function of z = 6.5 LAEs. Similarly, Shimasaku et al. (2006) have
established the luminosity function (LF) of z = 5.7 Ly![]() emitters from a sample of 89 LAEs, of which 28 spectroscopically
confirmed. Unlike previous work (Malhotra & Rhoads 2004),
Kashikawa et al. (2006) show convincing evidence for evolution of the LF
between z = 5.7 and z = 6.5. It is not clear whether this
evolution can be attributed to the luminosity L*, the comoving
number density
emitters from a sample of 89 LAEs, of which 28 spectroscopically
confirmed. Unlike previous work (Malhotra & Rhoads 2004),
Kashikawa et al. (2006) show convincing evidence for evolution of the LF
between z = 5.7 and z = 6.5. It is not clear whether this
evolution can be attributed to the luminosity L*, the comoving
number density ![]() ,
or the faint end slope
,
or the faint end slope ![]() ,
or a combination of
those, although it is suggested that L* is dimmed by a factor
,
or a combination of
those, although it is suggested that L* is dimmed by a factor ![]() 2
between these two redshifts.
2
between these two redshifts.
In Fig. 2 we represent the LAE luminosity functions at
redshifts 5.7, 6.5 and at z > 7 assuming arbitrarily another dimming
in L* by a factor 2 between redshifts 6.5 and >7. Also represented
on this figure are the data points corresponding to this work
and to Willis & Courbin (2005)![]() . The two data points are consistent with the
likely evolution of the luminosity function towards higher redshifts,
but do not allow us to constrain this evolution due to the limited
number of fields covered. We also indicate in Fig. 2 a point corresponding to an on-going programme that we are carrying out
at CFHT with a wide field imager (WIRCAM) at redshift 7.7. When this
programme is complete, we should either detect a few z = 7.7 galaxies
if the luminosity function has moderately evolved from z = 6.5, or, in
case of no detections, infer a significant evolution of the LF.
. The two data points are consistent with the
likely evolution of the luminosity function towards higher redshifts,
but do not allow us to constrain this evolution due to the limited
number of fields covered. We also indicate in Fig. 2 a point corresponding to an on-going programme that we are carrying out
at CFHT with a wide field imager (WIRCAM) at redshift 7.7. When this
programme is complete, we should either detect a few z = 7.7 galaxies
if the luminosity function has moderately evolved from z = 6.5, or, in
case of no detections, infer a significant evolution of the LF.
![\begin{figure}
\par\includegraphics[angle=-90,width=8.15cm,clip]{6349fig3.ps}\end{figure}](/articles/aa/full/2007/03/aa6349-06/img28.gif) |
Figure 3: Number of detected LAEs versus time. The VLT/HAWK-I case is assumed. Two different strategies (one deep single pointing and 5 shallower pointings for the same total time on sky) are indicated, for two luminosity functions: the z = 6.6 LF (Kashikawa et al. 2006) (solid line, L1*) and the same z > 7 LF as in Fig. 2 with L1* dimmed by a factor two (dashed lines, L2*). |
| Open with DEXTER | |
Other wide field imagers
equipped with low OH NB filters, either at 1.06 ![]() m or 1.19
m or 1.19 ![]() m, are becoming available on 4 m or 8-10 m class telescopes. In 2007, the VLT will be equipped with
HAWK-I (see Casali et al. 2006 and http://www.eso.org/instruments/hawki), a
m, are becoming available on 4 m or 8-10 m class telescopes. In 2007, the VLT will be equipped with
HAWK-I (see Casali et al. 2006 and http://www.eso.org/instruments/hawki), a ![]() 8
8![]()
![]() 8
8![]() imager, and VISTA (see McPherson et al. (2006) and
http://www.vista.ac.uk), the new 4 m IR telescope to be installed at Paranal will cover a field of view of
imager, and VISTA (see McPherson et al. (2006) and
http://www.vista.ac.uk), the new 4 m IR telescope to be installed at Paranal will cover a field of view of ![]() 45
45![]()
![]() 45
45![]() .
DAZLE (Horton et al. 2004), a visitor instrument dedicated to
searching high-z LAEs (7
.
DAZLE (Horton et al. 2004), a visitor instrument dedicated to
searching high-z LAEs (7![]()
![]() 7
7![]() field of view equipped
with very narrow band filters at <0.1% bandpass) will observe at the VLT
in the coming months.
field of view equipped
with very narrow band filters at <0.1% bandpass) will observe at the VLT
in the coming months.
These new instruments will be essential for investigating high-z LAEs by probing much larger volumes at similar or fainter detection limits. Different survey strategies can be contemplated with these instruments: either go very deep in a single field, or alternatively go brighter in several fields (pointings). Figure 3 shows the number of objects that can be detected using two different survey strategies with HAWK-I at the VLT. Two luminosity functions are assumed: the z = 6.5 LF (L1*) (Kashikawa et al. 2006) and the ad'hoc z > 7 LF mentioned above (L2*). The two different strategies, for each of the two luminosity functions, compare the number of objects detected in a single "deep'' field and in 5 non-overlapping "shallow'' fields observed each for a 5 times shorter integration time.
The plot indicates that the "deep'' strategy is naturally to be preferred for short integration times, while favoring area over depth becomes advantageous for very long integration times. Considering the very high uncertainties in the LF of z > 7 galaxies, a single pointing appears preferable for NB imaging surveys up to 100 h of integration time or less for the instrumental characteristics considered in this example.
We have searched for z ![]() 8.8 Ly
8.8 Ly![]() emitters with a NB filter
centered at 1.19
emitters with a NB filter
centered at 1.19 ![]() m in ISAAC at the ESO VLT. We covered an area of
31 arcmin2 down to a line flux of
m in ISAAC at the ESO VLT. We covered an area of
31 arcmin2 down to a line flux of ![]() 1.3
1.3 ![]() 10-17 erg s-1 cm-2. No LAE was detected in this
pilot survey, consistent with recent estimates of the luminosity function at
z
10-17 erg s-1 cm-2. No LAE was detected in this
pilot survey, consistent with recent estimates of the luminosity function at
z ![]() 6. Similar observations with wider field instruments are
likely to rapidly unveil high-z LAEs at redshifts above 7, however
in limited numbers and at high cost in observing time.
Systematic surveys of large numbers of very high zgalaxies will have to await JWST and ELTs.
6. Similar observations with wider field instruments are
likely to rapidly unveil high-z LAEs at redshifts above 7, however
in limited numbers and at high cost in observing time.
Systematic surveys of large numbers of very high zgalaxies will have to await JWST and ELTs.