An atlas of high energy (
A&A 461, 1209-1252 (2007)
DOI: 10.1051/0004-6361:20065734
M. Dadina
IASF-Bo/INAF, via P. Gobetti 101, 40129 Bologna, Italy
Received 31 May 2006 / Accepted 3 August 2006
Abstract
An atlas of high energy (![]() keV) spectra of nearby (
keV) spectra of nearby (![]() )
Seyfert galaxies observed with
)
Seyfert galaxies observed with
![]() is presented. The data have been analyzed in an homogeneous way. The final sample contains
is presented. The data have been analyzed in an homogeneous way. The final sample contains
![]() MECS+PDS (LECS data were not used here) pointings of 113 objects. No useful X-ray data were present for eight targets. The catalog of X-ray spectra contains data for 43 type-I Seyfert (including Seyfert 1.0, 1.2, and 1.5) and for 62 type-II objects (including Seyfert 1.8, 1.9, and 2.0). A total of 163 X-ray spectra (84 for type-I and 79 for type-II objects) were analyzed, since some sources were observed several times. 81 sources were detected at high energy (above 10 keV) by the PDS: 39 are Seyfert I and 42 are Seyfert II. The broadband X-ray spectra covering the
MECS+PDS (LECS data were not used here) pointings of 113 objects. No useful X-ray data were present for eight targets. The catalog of X-ray spectra contains data for 43 type-I Seyfert (including Seyfert 1.0, 1.2, and 1.5) and for 62 type-II objects (including Seyfert 1.8, 1.9, and 2.0). A total of 163 X-ray spectra (84 for type-I and 79 for type-II objects) were analyzed, since some sources were observed several times. 81 sources were detected at high energy (above 10 keV) by the PDS: 39 are Seyfert I and 42 are Seyfert II. The broadband X-ray spectra covering the ![]() 2-100 keV band are 130 in total. In a forthcoming paper, the statistical analysis of these data will be presented.
2-100 keV band are 130 in total. In a forthcoming paper, the statistical analysis of these data will be presented.
Key words: catalogs - galaxies: active - galaxies: Seyfert - X-ray: galaxies
In its six years of operation in orbit, the Italian-Dutch X-ray satellite
![]() (Boella et al. 1997) observed many Seyfert galaxies of all types in pointing scheduled as "core program'' and "guest observer'' sources. These pointings had very different observing exposures, as requested by the proponent scientist, who had a project in mind. These data in general have been analyzed and published by the data owner. The data, however, are now all public in the
(Boella et al. 1997) observed many Seyfert galaxies of all types in pointing scheduled as "core program'' and "guest observer'' sources. These pointings had very different observing exposures, as requested by the proponent scientist, who had a project in mind. These data in general have been analyzed and published by the data owner. The data, however, are now all public in the
![]() data bank and can be uniformly analyzed making use of the best software and response
matrices available. A sample so selected can provide insight on many open issues, the most outstanding being the unification model paradigm.
In this first paper, object selection, data reduction, and spectral fits are
presented and discussed and the spectral atlas is constructed.
data bank and can be uniformly analyzed making use of the best software and response
matrices available. A sample so selected can provide insight on many open issues, the most outstanding being the unification model paradigm.
In this first paper, object selection, data reduction, and spectral fits are
presented and discussed and the spectral atlas is constructed.
With this aim in mind all
![]() observation of Seyfert galaxies have been extracted from the data bank and inspected according to the following criteria.
As a first step, the public archive of
observation of Seyfert galaxies have been extracted from the data bank and inspected according to the following criteria.
As a first step, the public archive of
![]() observations has been cross
correlated with the Véron-Cetty-Véron (2001) AGN catalog. Source were extracted when:
observations has been cross
correlated with the Véron-Cetty-Véron (2001) AGN catalog. Source were extracted when:
![]() has observed 113 Seyfert galaxies (44 type I, including types 1.0, 1.2, and 1.5, and 69 type II including types 1.8, 1.9, and 2.0) with
has observed 113 Seyfert galaxies (44 type I, including types 1.0, 1.2, and 1.5, and 69 type II including types 1.8, 1.9, and 2.0) with ![]() in 175 pointings, as some sources were observed several times. Since the main purpose of this work is to perform the spectral analysis of the X-ray emission, all the sources with of too low detection in the MECS (
in 175 pointings, as some sources were observed several times. Since the main purpose of this work is to perform the spectral analysis of the X-ray emission, all the sources with of too low detection in the MECS (![]() 10
10![]() between 2-10 keV), were excluded by the analysis procedure. Twelve pointings did not match this criterium. Therefore the number of useful observations amounts to 164, and the X-ray spectra for 8 (7 type II and 1 type I) out of the 113 Seyfert are not reported. To conclude, 84 out of 163 X-ray spectra reported here are referred to 43 type I Seyfert galaxies,
while 79 X-ray spectra are referred to 62 type II Seyfert galaxies.
between 2-10 keV), were excluded by the analysis procedure. Twelve pointings did not match this criterium. Therefore the number of useful observations amounts to 164, and the X-ray spectra for 8 (7 type II and 1 type I) out of the 113 Seyfert are not reported. To conclude, 84 out of 163 X-ray spectra reported here are referred to 43 type I Seyfert galaxies,
while 79 X-ray spectra are referred to 62 type II Seyfert galaxies.
An additional criterium has been to exclude LECS data (energy range ![]() 0.1-4 keV, Parmar et al. 1997) and to consider only MECS+PDS data (energy range
0.1-4 keV, Parmar et al. 1997) and to consider only MECS+PDS data (energy range ![]() 2-100 keV, Boella et al. 1997; Frontera et al. 1997). This choice has been made to simplify data analysis, which was fully automatic. In fact, in the soft (
2-100 keV, Boella et al. 1997; Frontera et al. 1997). This choice has been made to simplify data analysis, which was fully automatic. In fact, in the soft (![]() 0.1-2 keV) band, particularly for type I objects, spectral features connected to the warm absorber are present in the spectra and difficult to account for in "standard'' models.
A detection in the PDS is registered whenever a 3
0.1-2 keV) band, particularly for type I objects, spectral features connected to the warm absorber are present in the spectra and difficult to account for in "standard'' models.
A detection in the PDS is registered whenever a 3![]() or higher significance signal is present between
or higher significance signal is present between ![]() 20-100 or 20-50 keV.
20-100 or 20-50 keV.
Table 1: List of the sources analyzed in this paper. Col. I: Object Name; Col. II and III: Right ascension and declination (Equinox 2000); Col. IV: Redshift; Col. V: Seyfert type; Col. VI: Radio class.
ASI Science Data Center pre-processed data have been used and were reduced following the handbook prepared by Fiore et al. (1999). MECS data have been
filtered for the extraction regions using FTOOLS and, in particular, the software package XSELECT.
MECS data are filtered over a circular, 30' radius region centered on the
source. Data have been binned to have at least 20 counts
for energy bin. This assures a safe application of ![]() statistics.
PDS data are binned in 18 channels through a logarithmic sampling of the instrument response between 20-200 keV. Spectral analysis has been performed using
the most recent calibration matrices. MECS background has been extracted from empty fields.
statistics.
PDS data are binned in 18 channels through a logarithmic sampling of the instrument response between 20-200 keV. Spectral analysis has been performed using
the most recent calibration matrices. MECS background has been extracted from empty fields.
To perform automatic analysis of the data it has been necessary to build a consistent set of template models. The basics of suchmodels are those components that describe a classical continuum of Seyfert galaxies. This continuum has been constructed using models of increasing complexity such a:
Some Seyferts were not fit by any of the above models to any acceptable degrees. This was due to low energy data (![]() 1.7-3 keV), which often exhibit excess residuals. An additional blackbody emission component at low energy has therefore been introduced for type I objects. Type II Seyfert galaxies with low energy excess were instead fitted adding an additional power-law. The spectral index of
this soft component has been set either to be equal to the hard one or to be
free.
Moreover, other spectral components have been added, when necessary, to account for: a) the possible presence of a broad Gaussian emission line (as in IC 4329a); b) the presence of a relativistically widened FeK
1.7-3 keV), which often exhibit excess residuals. An additional blackbody emission component at low energy has therefore been introduced for type I objects. Type II Seyfert galaxies with low energy excess were instead fitted adding an additional power-law. The spectral index of
this soft component has been set either to be equal to the hard one or to be
free.
Moreover, other spectral components have been added, when necessary, to account for: a) the possible presence of a broad Gaussian emission line (as in IC 4329a); b) the presence of a relativistically widened FeK![]() line (as in MCG-6-30-15); c) the presence of more than one emission line (as in NGC 1068); d) spectra due entirely to reflection (as in NGC 7674); e) the presence of partial and/or warm absorbers (as in NGC 3516). When warm absorbers were required, they were wfit with the ABSORI model.
line (as in MCG-6-30-15); c) the presence of more than one emission line (as in NGC 1068); d) spectra due entirely to reflection (as in NGC 7674); e) the presence of partial and/or warm absorbers (as in NGC 3516). When warm absorbers were required, they were wfit with the ABSORI model.
The models outlined above have been used to fit the data. The criterion used
has been the one of increasing complexity of the model applied in subsequent steps. As a first order approximation a best fit has been recognized for those
models for which the added element of complexity corresponds to at least a 90%
increase of statistical significance of the last added component. Final
acceptance of a best fit has been based on inspection of the
physical significance of the derived parameters by the automated fit procedure.
To obtain the luminosities reported in Table 3,
![]() km s-1 Mpc-1 and q0=0.5 were used.
km s-1 Mpc-1 and q0=0.5 were used.
The PDS sensitivity has been calculated a posteriori starting from the
observed 20-100 keV count rates of the detected sources.
The instrument sensitivity, in fact, could be modified by
factors such as the presence of sources in the blank-sky areas
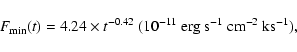
measured during the observations (see Frontera et al. 1996 for a detailed treatment of the PDS operation mode). Moreover, the conversion factor between count rates and fluxes is a function of the shape of the spectrum of the pointed sources. To average these effects, the minimum 20-100 keV count rate detectable at 3![]() has been calculated as a function of the exposure time starting from the significance of the various detections (see Table 2). Then, a sensitivity curve in the 20-100 keV band was obtained:
has been calculated as a function of the exposure time starting from the significance of the various detections (see Table 2). Then, a sensitivity curve in the 20-100 keV band was obtained:
![\begin{figure}
\par\includegraphics[width=5cm,height=7cm,angle=270]{5734fi1.ps}
\end{figure}](/articles/aa/full/2007/03/aa5734-06/img12.gif) |
Figure 1: PDS 20-100 keV sensitivity curve obtained by the detections reported in Tables 2 and 3. |
| Open with DEXTER | |
The systematic analysis of the ![]() 2-100 keV spectra of the Seyfert galaxies with
2-100 keV spectra of the Seyfert galaxies with ![]() observed by
observed by
![]() is presented. A summary of the main results is as follow:
is presented. A summary of the main results is as follow:
Acknowledgements
I would like to thank G.G.C. Palumbo for careful reading of the manuscript, and M. Cappi, G. Malaguti, & P. Grandi for helpful discussions. I express a great appreciation for the wonderful work of the ASI Science Data Center and acknowledge ASI for funding. Thanks to the anonymous referee for her/his constructive comments.
Table 2: Observations Log. Col. I: Object name; Col. II: Observation date; Col. III: MECS exposure in ks; Col. IV: PDS exposure in ks; Col. V: MECS detection significance in the 2-10 keV band express in terms of standard deviation; Col. VI: PDS detection significance in the 20-100 keV band express in terms of standard deviations. In parentheses, values concerning the 20-50 keV band for those sources that are not detected in the 15-100 keV band.
Table 3:
Best-fit spectral parameter. Column I: Observation name; Col. II: Total absorber Col. density; Col. III: Photon index; Col. IV: Energy centroid of the emission FeK![]() line; Col. V; EW of the emission line; Col. VI: Reflection parameter R; Col. VII: High-energy cut-off; Col. VIII: 2-10 keV flux; Col. IX: 2-10 keV observed luminosity; Col. X: 20-100 keV flux. Upper limits (3
line; Col. V; EW of the emission line; Col. VI: Reflection parameter R; Col. VII: High-energy cut-off; Col. VIII: 2-10 keV flux; Col. IX: 2-10 keV observed luminosity; Col. X: 20-100 keV flux. Upper limits (3![]() confidence level) have been calculated following the method presented in Sect. 3.3; Col. XI: 20-100 keV observed luminosity.
confidence level) have been calculated following the method presented in Sect. 3.3; Col. XI: 20-100 keV observed luminosity.
Ton S180: The first X-ray spectrum in the 0.1-10 keV band of the
source was obtained by
![]() and published in Comastri et al. (1998). As
stated by these authors, the spectrum is rather steep and in accordance with what measured in NLSy1 (
and published in Comastri et al. (1998). As
stated by these authors, the spectrum is rather steep and in accordance with what measured in NLSy1 (
![]() ,
Brandt et al. 1997). A FeK
,
Brandt et al. 1997). A FeK![]() emission line is detected at
emission line is detected at ![]() keV thus indicating that
it may rise from highly ionized matter. On the other hand, the statistic
prevent from testing if this feature is indeed the blue corn of a double-peaked
relativistic line. This scenario is also suggested by the fact that the
emission feature could be broad (
keV thus indicating that
it may rise from highly ionized matter. On the other hand, the statistic
prevent from testing if this feature is indeed the blue corn of a double-peaked
relativistic line. This scenario is also suggested by the fact that the
emission feature could be broad (
![]() keV with a best-fit value of
keV with a best-fit value of
![]() .
.
Tololo 109-393: The Compton-thick nature (in the 2-10 keV energy
band) of the source was proposed in Matt et al. (2000a). The
spectral parameters presented here are well in agreement with those
presented in that paper and later confirmed using
![]() (Iwasawa et al. 2001), XMM-Newton, and
(Iwasawa et al. 2001), XMM-Newton, and
![]() data (Matt et al. 2003).
data (Matt et al. 2003).
MARK 1152: The
![]() data were presented in Quadrelli et al.
(2003). The fit reported here is in agreement with what was previously obtained
to model the data above
data were presented in Quadrelli et al.
(2003). The fit reported here is in agreement with what was previously obtained
to model the data above ![]() 2 keV.
2 keV.
NGC 526a: Landi et al. (2001) presented the analysis of the broadband (0.1-100 keV)
![]() spectrum of the source. The photon index
of NGC 526a seems to be intrinsically flat (
spectrum of the source. The photon index
of NGC 526a seems to be intrinsically flat (
![]() )
and
the data do not require a strong reflection (Landi et al. 2001 found an upper
limit
)
and
the data do not require a strong reflection (Landi et al. 2001 found an upper
limit ![]() for the relative intensity of this component).
Here these results are confirmed.
for the relative intensity of this component).
Here these results are confirmed.
NGC 985: the
![]() data were previously published by
Krongold et al.(2005), who compared this data set with
data were previously published by
Krongold et al.(2005), who compared this data set with
![]() LETG data
to study the characteristics of the warm absorber detected below
LETG data
to study the characteristics of the warm absorber detected below ![]() 2
keV. The spectral parameters that describe the continuum are in agreement
with what is presented here, apart from the photon index that is found to be
rather flat (
2
keV. The spectral parameters that describe the continuum are in agreement
with what is presented here, apart from the photon index that is found to be
rather flat (
![]() compared to
compared to
![]() of the
present work) by Krongold et al. (2005). These differences may be due to
the different treatment of the
absorption since no warm absorber is required when only the
of the
present work) by Krongold et al. (2005). These differences may be due to
the different treatment of the
absorption since no warm absorber is required when only the
![]() MECS+PDS data (i.e., at energies above 2 keV) are considered.
MECS+PDS data (i.e., at energies above 2 keV) are considered.
ESO 198 -G24: Quadrelli et al. (2003) published the spectra of the two observations of ESO 198-G24, adopting the same baseline model presented here. Quadrelli et al. (2003) also considered an ionized absorber that is not necessary to account for when data below 2 keV are not included in the analysis.
3C 78: this dataset has been previously analyzed by Trussoni et al.
(1999) and Rinn et al. (2005). The results presented here are in
agreement with those obtained by Rinn et al. (2005), while the presence of
a FeK![]() line in the X-ray spectrum of the source was not tested
by Trussoni et al. (1999). It is worth considering, that the
significance of the iron line detected here is, accordingly to
F-test,
line in the X-ray spectrum of the source was not tested
by Trussoni et al. (1999). It is worth considering, that the
significance of the iron line detected here is, accordingly to
F-test, ![]() 99.9%.
99.9%.
MARK 609: The
![]() data were previously published by Pappa et al. (2002), who fit the 0.5-10 keV spectrum with a composite model including a starburst plus an AGN component. The former one is not required by the data presented here (that are above
data were previously published by Pappa et al. (2002), who fit the 0.5-10 keV spectrum with a composite model including a starburst plus an AGN component. The former one is not required by the data presented here (that are above ![]() 2 keV). Nonetheless, a possible contribution of thermal plasma may be responsible for the FeK
2 keV). Nonetheless, a possible contribution of thermal plasma may be responsible for the FeK![]() line that is observed
to be centered at
line that is observed
to be centered at ![]() keV.
keV.
3C 88: The
![]() observation of this source was never published
before. The source is faint and only a simple modelization of the spectra
(a power law) is allowed by the statistics.
observation of this source was never published
before. The source is faint and only a simple modelization of the spectra
(a power law) is allowed by the statistics.
NGC 1365 and NGC 1386: The
![]() data of these sources are probably contaminated by each other (the two sources lyeing at the edge of the PDS FOV of the other). The total amount of such contribution is unclear. Studying the PDS light curve of NGC 1365, Risaliti et al. (1999) supposed that NGC 1386 could contribute up to 50% of what was measured by the PDS observing NGC 1365.
NGC 1386 shows a very steep spectrum (
data of these sources are probably contaminated by each other (the two sources lyeing at the edge of the PDS FOV of the other). The total amount of such contribution is unclear. Studying the PDS light curve of NGC 1365, Risaliti et al. (1999) supposed that NGC 1386 could contribute up to 50% of what was measured by the PDS observing NGC 1365.
NGC 1386 shows a very steep spectrum (
![]() )
in the 2-10 keV band. Starting from this, we simulated the possible contribution from this
source to the NGC 1365 PDS data, assuming an intermediate scenario Compton-thin/Compton-thick, with
)
in the 2-10 keV band. Starting from this, we simulated the possible contribution from this
source to the NGC 1365 PDS data, assuming an intermediate scenario Compton-thin/Compton-thick, with
![]() cm-2, i.e., a scenario for which NGC 1386 would contribute at maximum to the NGC 1365 data. In this scenario, the 2-10 keV band of NGC 1386 is dominated by a warm scattering component, so to explain both the steep spectrum and the huge FeK
cm-2, i.e., a scenario for which NGC 1386 would contribute at maximum to the NGC 1365 data. In this scenario, the 2-10 keV band of NGC 1386 is dominated by a warm scattering component, so to explain both the steep spectrum and the huge FeK![]()
![]() keV (the last value being in agreement with what was previously found by Maiolino et al. 1998). It turns out that, also assuming that the 2-10 keV flux in NGC 1386 is dimmed by a factor of 300, this source is expected to contribute for
keV (the last value being in agreement with what was previously found by Maiolino et al. 1998). It turns out that, also assuming that the 2-10 keV flux in NGC 1386 is dimmed by a factor of 300, this source is expected to contribute for ![]() 5% to the 20-100 keV flux measured observing NGC 1365. Nonetheless, further Suzako observations are needed to definitively solve this problem.
5% to the 20-100 keV flux measured observing NGC 1365. Nonetheless, further Suzako observations are needed to definitively solve this problem.
3C 111: Lewis et al. (2005) reported the possible detection of a broad iron emission line in the spectra of the source using simultaneous XMM-Newton and RossiXTE data. Alternatively, the authors speculated that the curvature of the X-ray spectrum could be either to a truncated accretion disk or to a blob-like complex absorber. The analysis of the
![]() data presented here cannot distinguish between these scenarios, and the X-ray spectrum of the source
is well fit, adding a reflection component to the power law-like continuum.
data presented here cannot distinguish between these scenarios, and the X-ray spectrum of the source
is well fit, adding a reflection component to the power law-like continuum.
3C 120: The
![]() observation of 3C 120 was previously published by Zdziarski & Grandi (2001). The baseline model adopted here is the same adopted by these authors and consists of a primary power law plus a reflection component and an emission FeK
observation of 3C 120 was previously published by Zdziarski & Grandi (2001). The baseline model adopted here is the same adopted by these authors and consists of a primary power law plus a reflection component and an emission FeK![]() line.
Overall, the spectral analysis performed here confirms the results previously published. Slight differences are found in the determination of the FeK
line.
Overall, the spectral analysis performed here confirms the results previously published. Slight differences are found in the determination of the FeK![]() EW and
EW and ![]() ,
where Zdziarski & Grandi found higher values (but consistent within the 90% confidence intervals) for both parameters and for R (in this case Zdziarski & Grandi found a slighly lower value). This is probably due to the fact that the LECS data are not considered here so that no soft component is present in the best-fit model of this work. This may have introduced a slightly higher normalization of the primary continuum that resulted in the observed differences.
,
where Zdziarski & Grandi found higher values (but consistent within the 90% confidence intervals) for both parameters and for R (in this case Zdziarski & Grandi found a slighly lower value). This is probably due to the fact that the LECS data are not considered here so that no soft component is present in the best-fit model of this work. This may have introduced a slightly higher normalization of the primary continuum that resulted in the observed differences.
UGC 3134: The
![]() data of this source were never published before. The statistics are poor and only a simple absorbed power-law model was tested. The source's spectrum seems flat (
data of this source were never published before. The statistics are poor and only a simple absorbed power-law model was tested. The source's spectrum seems flat (
![]() ). It is worth considering here, anyway, that the statistics hampers to test the presence of a reflection component that could explain the flatness of the X-ray spectrum. Only an upper limit is obtained for the column density of the absorber (
). It is worth considering here, anyway, that the statistics hampers to test the presence of a reflection component that could explain the flatness of the X-ray spectrum. Only an upper limit is obtained for the column density of the absorber (
![]() cm-2)
cm-2)
IRAS 05189-2524: The
![]() data set was previously analyzed by Severgnini et al. (2001). The model reported here is similar to what was previously presented. The photon index observed here is slightly steeper (
data set was previously analyzed by Severgnini et al. (2001). The model reported here is similar to what was previously presented. The photon index observed here is slightly steeper (
![]() )
with respect to what was presented before (
)
with respect to what was presented before (
![]() ,
Severgini et al. 2001). A different modelization of the soft component present at
,
Severgini et al. 2001). A different modelization of the soft component present at ![]() keV (a power law is used in the present work while Severgini et al. (2001) used a thermal component) may have caused this effect, leading here to an underestimation of the importance of the soft component.
keV (a power law is used in the present work while Severgini et al. (2001) used a thermal component) may have caused this effect, leading here to an underestimation of the importance of the soft component.
NGC 2110: The
![]() data were published by Malaguti et al. (1999). The authors investigated a dual absorber model (with a high column
partial absorber covering
data were published by Malaguti et al. (1999). The authors investigated a dual absorber model (with a high column
partial absorber covering ![]() 25% of the primary source with
25% of the primary source with
![]() cm-2 and a total absorber with
cm-2 and a total absorber with
![]() cm-2). Risaliti (2002), on the contrary, proposed a reflection model. Here, the best fit is similar to what was presented by Risaliti (2002), and the
results are consistent with what was presented in that paper.
cm-2). Risaliti (2002), on the contrary, proposed a reflection model. Here, the best fit is similar to what was presented by Risaliti (2002), and the
results are consistent with what was presented in that paper.
H557-385: Quadrelli et al. (2003) modeled the X-ray spectra of this
source by adding a poorly ionized absorber. This component is not required
by the data presented here that are above ![]() 2 keV (i.e., no LECS included).
Nonetheless, within the errors, the spectral parameters are in agreement with
what was reported by Quadrelli et al. (2003).
2 keV (i.e., no LECS included).
Nonetheless, within the errors, the spectral parameters are in agreement with
what was reported by Quadrelli et al. (2003).
NGC 2273: The Compton-thick nature of this source was first proposed
by Maiolino et al. (1998) using
![]() data and then confirmed by Guainazzi et al. (2005) analyzing an XMM-Newton observation. This scenario explains the extremely flat photon index and the huge EW of the FeK
data and then confirmed by Guainazzi et al. (2005) analyzing an XMM-Newton observation. This scenario explains the extremely flat photon index and the huge EW of the FeK![]() line detected
even without any indication of strong absorption.
line detected
even without any indication of strong absorption.
MARK 6: Malizia et al. (2003) modeled the broad band X-ray spectra
of the source using a complex absorber. This scenario is not required, excluding
the LECS data. Here a reflection component is preferred, although marginally detected with a significance of ![]() 97%.
97%.
MCG-1-24-12: As demonstrated by Malizia et al. (2002), this source is the counterpart of the Piccinotti sample object named H0917-074 (Piccinotti et al. 1982). In the ASDC archive this is the third observation carried out by
![]() on H0917-074, but the first and the second ones, performed in March 2000, pointing the QSO 2MASX J09195126-0735413 (
on H0917-074, but the first and the second ones, performed in March 2000, pointing the QSO 2MASX J09195126-0735413 (![]() ).
).
MARK 110:
![]() observed the source 3 times. PDS data were published before (Deluit & Courvoisier 2003), while the broad band spectrum of the source are published here for the first time. The source has been observed to vary by a factor of
observed the source 3 times. PDS data were published before (Deluit & Courvoisier 2003), while the broad band spectrum of the source are published here for the first time. The source has been observed to vary by a factor of ![]() 30% during the observations. The continuum is simply described by an unabsorbed power law. A FeK
30% during the observations. The continuum is simply described by an unabsorbed power law. A FeK![]() line has been detected at
line has been detected at ![]() keV during the first observation with an
keV during the first observation with an
![]() eV. Overall, the models presented here agree with the results obtained for the same source by George et al. (2000) using ASCA data. The main difference is the detection of the iron line during observation a.
eV. Overall, the models presented here agree with the results obtained for the same source by George et al. (2000) using ASCA data. The main difference is the detection of the iron line during observation a.
M81: Pellegrini et al. (2000) published these
![]() data. Unlike these authors, I also tested the addition of a reflection component
that is only marginally significant, yielding to an upper limit (
data. Unlike these authors, I also tested the addition of a reflection component
that is only marginally significant, yielding to an upper limit (![]() )
on the amount of this component and a lower limit on
)
on the amount of this component and a lower limit on
![]() keV. As previously noticed by Pellegrini et al. (2000), the FeK
keV. As previously noticed by Pellegrini et al. (2000), the FeK![]() line is only marginally consistent with being produced by cold matter (
line is only marginally consistent with being produced by cold matter (
![]() keV). From the
present analysis it is not clear what the site of production of this
component could be. Here, in fact, the absorption edge detected at
keV). From the
present analysis it is not clear what the site of production of this
component could be. Here, in fact, the absorption edge detected at ![]() keV by Pellegrini et al. (2000) is not measured because of the addition of the
reflection component. Thus, it is not possible to exclude that the ionized
FeK
keV by Pellegrini et al. (2000) is not measured because of the addition of the
reflection component. Thus, it is not possible to exclude that the ionized
FeK![]() line comes from an ionized reflector or from a warm absorber.
line comes from an ionized reflector or from a warm absorber.
NGC 3081: Maiolino et al. (1998) demonstrated that this source is
Compton-thick, thus explaining its extremely flat spectrum and the huge EW
of the FeK![]() line.
line.
NGC 3079: The source was proposed as a Compton-thick one by Iyomoto et al. (2001). Here this result is confirmed, considering the large EW of the FeK![]() line. In this framework, the steep spectrum below 10 keV suggests that this component could be ascribed to a warm scattering process instead of a cold reflection.
line. In this framework, the steep spectrum below 10 keV suggests that this component could be ascribed to a warm scattering process instead of a cold reflection.
NGC 3147: The X-ray spectrum of this source is similar to that of NGC 3079. The PDS did not detect the source above 10 KeV. For this reason it is not
possible to firmly assess its Compton-thick nature unless assuming that the
column due to the putative dusty torus is higher the ![]() 1025 cm-2, thus preventing any possibility of the primary emission penetrating it.
1025 cm-2, thus preventing any possibility of the primary emission penetrating it.
NGC 3281: The Compton-thick nature of this source was previously proposed by Vignali & Comastri (2002). Here, their results are confirmed.
RE J1034+396: The
![]() data were unpublished before. The
source has been detected at a flux level similar to what was observed during the
first ASCA observation (
data were unpublished before. The
source has been detected at a flux level similar to what was observed during the
first ASCA observation (
![]() erg s-1 cm-2, Vaughan et al. 1999). The spectrum is modeled by a simple power law with spectral parameters in agreement with those measured by ASCA.
erg s-1 cm-2, Vaughan et al. 1999). The spectrum is modeled by a simple power law with spectral parameters in agreement with those measured by ASCA.
NGC 3627: The origin of the X-ray emission of this source is probably due to a number of off-nuclear objects that indicate the strong contribution of a starburst to the high energy emission (Georgantopoulos et al. 2002).
NGC 3660: The
![]() data were not published before.
No absorption in excess to that of the Galaxy has been measured in the 2-10 keV band. The source is detected in the PDS.
Nonetheless, the measured 20-100 keV flux is well above what is predicted
extrapolating the spectrum observed below 10 keV at these energy.
No strong hard X-ray emitters are known to be within the
data were not published before.
No absorption in excess to that of the Galaxy has been measured in the 2-10 keV band. The source is detected in the PDS.
Nonetheless, the measured 20-100 keV flux is well above what is predicted
extrapolating the spectrum observed below 10 keV at these energy.
No strong hard X-ray emitters are known to be within the
![]() fov. The
stronger ones are 1AXG J112342-0851 and 1AXG J112237-0847 (Ueda et al. 2001), detected in the 2-10 keV band with ASCA. In the 2-10 keV band, these sources are
fov. The
stronger ones are 1AXG J112342-0851 and 1AXG J112237-0847 (Ueda et al. 2001), detected in the 2-10 keV band with ASCA. In the 2-10 keV band, these sources are
![]() 10 and 20 times fainter than NGC 3660, thus it seems unlikely that
they are responsible for the excess observed in the PDS, also considering that
1AXG J112342-0851 has a flat spectrum (
10 and 20 times fainter than NGC 3660, thus it seems unlikely that
they are responsible for the excess observed in the PDS, also considering that
1AXG J112342-0851 has a flat spectrum (
![]() )
accordingly with the hardness ratio measured by ASCA GIS (Ueda et al. 2001).
Assuming that the PDS excess is due to NGC 3660 emission,
the best-fit model is composed by an unabsorbed power law dominating
the emission between 2-10 keV and by an absorbed one (
)
accordingly with the hardness ratio measured by ASCA GIS (Ueda et al. 2001).
Assuming that the PDS excess is due to NGC 3660 emission,
the best-fit model is composed by an unabsorbed power law dominating
the emission between 2-10 keV and by an absorbed one (
![]() cm-2) arising at
cm-2) arising at ![]() keV. Thus the source would be classified
as a Compton-thick one. Nonetheless it is noticeable that no iron emission line
is detected at all with an upper limit on the
keV. Thus the source would be classified
as a Compton-thick one. Nonetheless it is noticeable that no iron emission line
is detected at all with an upper limit on the
![]() eV, thus not in accordance with the detected absorbing column.
eV, thus not in accordance with the detected absorbing column.
NGC 4051: This narrow-line Seyfert 1 was observed twice by
![]() .
During the first observation (observation a), the source was
observed in an unusual low state during which the X-ray spectrum was dominated
by a reflection component (Guainazzi et al. 1998). This is also confirmed by
the present analysis of the data. The second
.
During the first observation (observation a), the source was
observed in an unusual low state during which the X-ray spectrum was dominated
by a reflection component (Guainazzi et al. 1998). This is also confirmed by
the present analysis of the data. The second
![]() observation of the
source, taken one-and-an-half-months later, was never published. The source was
an order of magnitude brighter than during observation a, and the X-ray
spectrum is simply modeled by a power law. No low-energy cut-off due to cold or mildly ionized absorption is measured. Nonetheless,
a prominent absorption edge is detected at
observation of the
source, taken one-and-an-half-months later, was never published. The source was
an order of magnitude brighter than during observation a, and the X-ray
spectrum is simply modeled by a power law. No low-energy cut-off due to cold or mildly ionized absorption is measured. Nonetheless,
a prominent absorption edge is detected at ![]() keV (i.e., well in agrement with being produced by cold matter). The addition of a reflection component and/or a partial covering is not required, on statistical basis, by the data. This is also true for the FeK
keV (i.e., well in agrement with being produced by cold matter). The addition of a reflection component and/or a partial covering is not required, on statistical basis, by the data. This is also true for the FeK![]() emission line.
emission line.
MARK 205: Favre et al. (2004) published the
![]() observations
measuring a reflection component in the observation b. Here, the addition of
such a component turned out not to be required by the data. The measurements
of the other spectral parameters are in agreement with those obtained by Favre
et al. (2004).
observations
measuring a reflection component in the observation b. Here, the addition of
such a component turned out not to be required by the data. The measurements
of the other spectral parameters are in agreement with those obtained by Favre
et al. (2004).
IC 3639: The
![]() data were not published before. The statistics are low thus the best-fit model is simply composed of a power law plus a Gaussian line in emission. No intrinsic absorption is required by the data (
data were not published before. The statistics are low thus the best-fit model is simply composed of a power law plus a Gaussian line in emission. No intrinsic absorption is required by the data (
![]() cm-2, 90% confidence). Nonetheless a huge
FeK
cm-2, 90% confidence). Nonetheless a huge
FeK![]() is detected (
is detected (
![]() keV). This line is most probably due to
cold iron (
keV). This line is most probably due to
cold iron (
![]() ). The spectra is rather flat (
). The spectra is rather flat (
![]() ),
but not as extreme as expected for reflection-dominated sources (
),
but not as extreme as expected for reflection-dominated sources (
![]() ,
as is the case of NGC 1068 in the 2-10 keV band, Matt et al. 1997). The line EW, however, strongly indicates that the source is Compton-thick but while its centroid indicates that it is produced in cold material, the slope of the X-ray continuum indicates a possible reflection from warm material. To conclude, as
for NGC 2273 (see above), it is not clear if the X-ray spectrum of the source
below 10 keV is cold reflection or warm scattering dominated, while its Compton-thick nature is most probable.
,
as is the case of NGC 1068 in the 2-10 keV band, Matt et al. 1997). The line EW, however, strongly indicates that the source is Compton-thick but while its centroid indicates that it is produced in cold material, the slope of the X-ray continuum indicates a possible reflection from warm material. To conclude, as
for NGC 2273 (see above), it is not clear if the X-ray spectrum of the source
below 10 keV is cold reflection or warm scattering dominated, while its Compton-thick nature is most probable.
M 94: The
![]() data were published in Pellegrini et al. (2002).
The spectral parameters reported here are in agreement, within a 90%
confidence level, with what was previously published. A marginal (confidence level
data were published in Pellegrini et al. (2002).
The spectral parameters reported here are in agreement, within a 90%
confidence level, with what was previously published. A marginal (confidence level ![]() 99% accordingly to F-test) detection of the FeK
99% accordingly to F-test) detection of the FeK![]() line at
line at
![]() keV is also reported here.
keV is also reported here.
MARK 231: This is the BALQSO at the lowest z known to-date (Smith et al. 1995). The
![]() data were published, together with XMM-Newton data, by
Braito et al. (2004). The authors speculated that the source is almost
Compton-thick and that the component observed below
data were published, together with XMM-Newton data, by
Braito et al. (2004). The authors speculated that the source is almost
Compton-thick and that the component observed below ![]() 10 keV is due to
cold reflection or warm scattering of the primary emission. This is in
agreement
with what is found here, adopting a simple power-law model to fit only the
10 keV is due to
cold reflection or warm scattering of the primary emission. This is in
agreement
with what is found here, adopting a simple power-law model to fit only the
![]() data. In fact, in this case, a flat power law (
data. In fact, in this case, a flat power law (
![]() )
is
obtained. A marginal detection of the FeK
)
is
obtained. A marginal detection of the FeK![]() line is found at
line is found at
![]() keV.
keV.
NGC 4826:
![]() data were unpublished. The source is faint and only a simple model has been tried. The shape of the continuum is typical for a
Seyfert galaxy (
data were unpublished. The source is faint and only a simple model has been tried. The shape of the continuum is typical for a
Seyfert galaxy (
![]() ), but the quality of the hampers to
constrains it.
), but the quality of the hampers to
constrains it.
NGC 4939: As discussed in Maiolino et al. (1998), it is not clear if
this source is Compton-thick or thin. Here we fitted the data with a
transmission model (also discussed in Maiolino et al. 1998). The EW of the
FeK![]() line is big (
line is big (
![]() eV), but not so extreme as to unambiguously
indicate the source as Compton-thick.
eV), but not so extreme as to unambiguously
indicate the source as Compton-thick.
IRAS 13224-3809:
![]() data were not published before. The statistics is poor and the X-ray spectra were fitted with a simple power law that turned out to be steep (
data were not published before. The statistics is poor and the X-ray spectra were fitted with a simple power law that turned out to be steep (
![]() ), in agreement with what was
expected for narrow line Seyfert 1 (Brandt et al. 1997).
), in agreement with what was
expected for narrow line Seyfert 1 (Brandt et al. 1997).
Centaurus A: The
![]() observations of the source were published in Grandi et al. (2003). The authors studied the variability properties of the source and summed the five
observations of the source were published in Grandi et al. (2003). The authors studied the variability properties of the source and summed the five
![]() observations to precisely model the
X-ray spectrum. The results presented here are, overall, in agreement with the results presented in Grandi et al. (2003). Also, Risaliti (2002) presented
these observations finding results that are very similar to the ones reported
in this work.
observations to precisely model the
X-ray spectrum. The results presented here are, overall, in agreement with the results presented in Grandi et al. (2003). Also, Risaliti (2002) presented
these observations finding results that are very similar to the ones reported
in this work.
M 51: Fukazawa et al. (2001) claimed the Compton-thick nature of this low-luminosity AGN, studying its ![]() 0.1-100 keV
0.1-100 keV
![]() spectrum. Here we
confirm their results.
spectrum. Here we
confirm their results.
MCG-6-30-15: The source is known to exibit a relativistically broadened FeK![]() line (Tanaka et al. 1995). This data set was previously analized by Guainazzi et al. (1999), who confirmed the existence of such a spectral feature. The results presented here are in agrement with previous findings. The larger uncertainities in the continuum shape parameters reported in this work with respect of the Guainazzi et al. (1999) results are most probably due to the exclusion of the LECS data.
line (Tanaka et al. 1995). This data set was previously analized by Guainazzi et al. (1999), who confirmed the existence of such a spectral feature. The results presented here are in agrement with previous findings. The larger uncertainities in the continuum shape parameters reported in this work with respect of the Guainazzi et al. (1999) results are most probably due to the exclusion of the LECS data.
NGC 5252: Risaliti (2002) found a best fit to this data set, including a reflection component that is not statistically required here where no LECS data are considered. The best fit reported here is in perfect agreement with the similar model tested in Risaliti (2002).
IC 4329a: The source has been observed five times by
![]() .
Analysis of the first (1996) and last (2000) observations may be found in Perola et al. (1999), and in Gondoin et al. (2001) and Bianchi et al. (2004) respectively. The other observations were published in Cappi et al. (2001). Bianchi et al. (2004) speculated that a Compton-shoulder is visible in the data collected simultaneously by
.
Analysis of the first (1996) and last (2000) observations may be found in Perola et al. (1999), and in Gondoin et al. (2001) and Bianchi et al. (2004) respectively. The other observations were published in Cappi et al. (2001). Bianchi et al. (2004) speculated that a Compton-shoulder is visible in the data collected simultaneously by
![]() and XMM-Newton in 2000. Overall, the spectrum of the source is almost steady, independently of the flux state that varied by a factor of
and XMM-Newton in 2000. Overall, the spectrum of the source is almost steady, independently of the flux state that varied by a factor of ![]() 2 in the period sampled by the observations. In few cases (see figures), the FeK
2 in the period sampled by the observations. In few cases (see figures), the FeK![]() emission line is best fitted with a mildly broad
line (width
emission line is best fitted with a mildly broad
line (width
![]() ), as was previously noted by Perola et al. (1999).
), as was previously noted by Perola et al. (1999).
MARK 463: The MECS field containing MARK 463 is populated by 3 other sources, one of which (PG 1352+183) is brighter than MARK 463 (Landi & Bassani 2001).
Circinus Galaxy: Matt et al. (1999) presented the first
![]() observation of the galaxy. Bianchi et al. (2002) presented a comparison of the
X-ray spectra measured below
observation of the galaxy. Bianchi et al. (2002) presented a comparison of the
X-ray spectra measured below ![]() 10 keV by
10 keV by
![]() .
The results presented
here are in agrement with those measured by these authors.
.
The results presented
here are in agrement with those measured by these authors.
NGC 5506:
![]() observed the source 3 times. Data were previously published in Perola et al. (2002) and Bianchi et al. (2004). The best fits
proposed here are in agreement with what was presented by these authors. As for IC 4329a, the source displays an almost steady broadband spectrum that does not significantly change with the flux state (a variation of
observed the source 3 times. Data were previously published in Perola et al. (2002) and Bianchi et al. (2004). The best fits
proposed here are in agreement with what was presented by these authors. As for IC 4329a, the source displays an almost steady broadband spectrum that does not significantly change with the flux state (a variation of ![]() 3.5 in the 2-10 keV flux has been recorded between the 3
3.5 in the 2-10 keV flux has been recorded between the 3
![]() observations of the target).
observations of the target).
NGC 5548: The
![]() data acquired during the 1997 observations were divided into 4 observations. Nicastro et al. (2000) summed these datasets to perform the spectral analysis, while here they were analyzed separately. Nicastro et al. (2002) found that the source X-ray spectrum is well modeled, adding a reflection component to a power law continuum with a high-energy cut-off. This is in agrement with the results presented here. On the contrary, Nicastro et al. (2002) found signatures of the presence of a warm absorber below
data acquired during the 1997 observations were divided into 4 observations. Nicastro et al. (2000) summed these datasets to perform the spectral analysis, while here they were analyzed separately. Nicastro et al. (2002) found that the source X-ray spectrum is well modeled, adding a reflection component to a power law continuum with a high-energy cut-off. This is in agrement with the results presented here. On the contrary, Nicastro et al. (2002) found signatures of the presence of a warm absorber below ![]() 2.5 keV that are negligible once the LECS data are excluded by the spectral analysis. The same results are also obtained for the last two observations.
2.5 keV that are negligible once the LECS data are excluded by the spectral analysis. The same results are also obtained for the last two observations.
NGC 5643: The source was proposed as a Compton-thick one by Maiolino
et al. (1998). Here this result is confirmed. The poor statistics prevent any
detailed modelization of the X-ray spectrum, but the huge EW of the FeK![]() line (
line (
![]() keV) strongly supports this scenario. A possible soft excess
is present although it is not constrained by the present data (since the exclusion of the LECS instrument). However, it is most probably associated with a warm scattering and/or thermal component (Maiolino et al. 1998).
keV) strongly supports this scenario. A possible soft excess
is present although it is not constrained by the present data (since the exclusion of the LECS instrument). However, it is most probably associated with a warm scattering and/or thermal component (Maiolino et al. 1998).
MARK 478: The
![]() data were published in Marshall et al. (2003). The best fit of the
data were published in Marshall et al. (2003). The best fit of the
![]() /LETG+
/LETG+
![]() /MECS data is given by a double
power law. The one that leads the emission above
/MECS data is given by a double
power law. The one that leads the emission above ![]() 2 keV is rather flat (
2 keV is rather flat (
![]() ,
Marshall et al. 2003). This is not in agreement with what
found here. The best fit of the MECS data alone indicates that the X-ray spectrum is rather steep (
,
Marshall et al. 2003). This is not in agreement with what
found here. The best fit of the MECS data alone indicates that the X-ray spectrum is rather steep (
![]() )
and not absorbed (the upper limit on the column is found to be
)
and not absorbed (the upper limit on the column is found to be
![]() cm-2). These values, furthermore, are in agreement with what was observed in NLSy1, a class of object to which MARK 478 belongs.
cm-2). These values, furthermore, are in agreement with what was observed in NLSy1, a class of object to which MARK 478 belongs.
MARK 841: As previously noted by Bianchi et al. (2001), the
high energy spectrum of the source is well fitted, adding a large reflection component (![]() )
that is not consistent with the observed EW of the FeK
)
that is not consistent with the observed EW of the FeK![]() emission line (
emission line (
![]() ). The source was observed twice, and in the second observation the iron emission line is not detected using the
). The source was observed twice, and in the second observation the iron emission line is not detected using the
![]() data alone. This is most probably due to its fast variability (Petrucci et al. 2002; Longinotti et al. 2004) that was measured in the joint
data alone. This is most probably due to its fast variability (Petrucci et al. 2002; Longinotti et al. 2004) that was measured in the joint
![]() and XMM-Newton observations of the source performed in 2001.
and XMM-Newton observations of the source performed in 2001.
NGC 6212: The
![]() data of the source were never published before. The statistic is poor and only a simple model has been tested. The
data of the source were never published before. The statistic is poor and only a simple model has been tested. The
![]() is rather flat considering that the source is classified as a NLSY1, a class of sources that usually displays steep X-ray spectra (Brandt et al. 1997).
is rather flat considering that the source is classified as a NLSY1, a class of sources that usually displays steep X-ray spectra (Brandt et al. 1997).
NGC 6240: Vignati et al. (1999), basing their analysis on this data set, stated that the source is a Compton-thick Seyfert with a direct component emerging at ![]() keV. Here their results are confirmed. It is worth noting here that the source has been recognized to be in a merging system with a binary black hole (Komossa et al. 2003).
keV. Here their results are confirmed. It is worth noting here that the source has been recognized to be in a merging system with a binary black hole (Komossa et al. 2003).
NGC 6300: The source as observed by
![]() is Compton-thin (Guainazzi 2002), and the primary emission is seen through an absorber with
is Compton-thin (Guainazzi 2002), and the primary emission is seen through an absorber with
![]() cm-2. Nonetheless, the source was seen in a reflection dominated state (Leighly et al. 1999).
cm-2. Nonetheless, the source was seen in a reflection dominated state (Leighly et al. 1999).
Cygnus A: The source is embedded in a galaxy cluster. A model containing a thermal (to account for the cluster contribution) and an absorbed power law component (to account for the AGN emission) has been used. The nucleus of the source is well fit by a simple power law (
![]() )
absorbed by a column
)
absorbed by a column
![]() cm-2. The intracluster emission is modeled with a MEKAL component with
cm-2. The intracluster emission is modeled with a MEKAL component with
![]() keV and an abundance of
keV and an abundance of ![]() .
These results are in agreement with what was previously published in Young et al. (2002) and Ueno et al. (1994). The fluxes and luminosities reported in Table 3 are of the AGN component alone.
.
These results are in agreement with what was previously published in Young et al. (2002) and Ueno et al. (1994). The fluxes and luminosities reported in Table 3 are of the AGN component alone.
IRAS 20051-1117:
![]() data were unpublished. The statistic is poor. Only a power law model was tested. The value of the photon index (
data were unpublished. The statistic is poor. Only a power law model was tested. The value of the photon index (
![]() )
is typical for a Seyfert galaxy (Smith & Done 1996; Turner et al. 1997).
)
is typical for a Seyfert galaxy (Smith & Done 1996; Turner et al. 1997).
IRAS 20210+1121: The broadband data of the source was never published before. The X-ray spectrum is rather flat (
![]() )
and a huge (
)
and a huge (
![]() keV) iron emission line is detected at
keV) iron emission line is detected at
![]() keV. These evidences lead to classify the source as a Compton-thick object.
keV. These evidences lead to classify the source as a Compton-thick object.
S52116+81: The
![]() data were published in Padovani et al. (2002) and by Grandi et al. (2006). Padovani et al. (2002) classified the source as a flat spectrum radio quasar, while the latter authors classified the source as a broad line radio galaxy. These authors, moreover, fitted the broadband
data were published in Padovani et al. (2002) and by Grandi et al. (2006). Padovani et al. (2002) classified the source as a flat spectrum radio quasar, while the latter authors classified the source as a broad line radio galaxy. These authors, moreover, fitted the broadband
![]() data with a model very similar to the ones tested here. The spectral parameters reported in this work are in agrement with those obtained by Grandi et al. (2006)
data with a model very similar to the ones tested here. The spectral parameters reported in this work are in agrement with those obtained by Grandi et al. (2006)
IRAS 22017+0319: Analysis of the
![]() data was not published before. The X-ray emission of the source is absorbed by matter hosted in the host galaxy (
data was not published before. The X-ray emission of the source is absorbed by matter hosted in the host galaxy (
![]() cm-22) and the spectrum is rather flat (
cm-22) and the spectrum is rather flat (
![]() )
when compared with the expected values for Seyfert galaxies (
)
when compared with the expected values for Seyfert galaxies (
![]() ,
Smith & Done 1996; Turner et al. 1997). An emission FeK
,
Smith & Done 1996; Turner et al. 1997). An emission FeK![]() line is detected at
line is detected at ![]() keV with
keV with
![]() eV. The energy centroid of the line suggests that
it may rise in partially ionized matter.
eV. The energy centroid of the line suggests that
it may rise in partially ionized matter.
ARK 564: The
![]() spectrum of this source was presented in Comastri et al. (2001). To increase the S/N, the authors summed together the LECS and MECS data of the 3
spectrum of this source was presented in Comastri et al. (2001). To increase the S/N, the authors summed together the LECS and MECS data of the 3
![]() observations of the source. Here, the 3 data sets are
presented separately. Overall, the results are similar to what was previously presented. Here no edge has been detected at
observations of the source. Here, the 3 data sets are
presented separately. Overall, the results are similar to what was previously presented. Here no edge has been detected at ![]() 9.8 keV, as proposed Comastri et al. (2001). On the contrary, the Fek
9.8 keV, as proposed Comastri et al. (2001). On the contrary, the Fek![]() line is consistent with being produced by ionized matter (as proposed by Comastri et al. 2001) only during observation b) and c), while it seems to be produced by almost cold matter during observation a).
line is consistent with being produced by ionized matter (as proposed by Comastri et al. 2001) only during observation b) and c), while it seems to be produced by almost cold matter during observation a).
MR 2251-17.8: Orr et al. (2001) presented these
![]() data for the first time. The authors claimed the detection of an ionized FeK
data for the first time. The authors claimed the detection of an ionized FeK![]() emission line. In addition, Orr et al. (2001) report that a reflection component and a high-energy cut-off are also measured. These results were obtained by summing the two
emission line. In addition, Orr et al. (2001) report that a reflection component and a high-energy cut-off are also measured. These results were obtained by summing the two
![]() observations of the source. Here these data set are analyzed separately. This prevents the detection of these components, and only the emission line is detected.
observations of the source. Here these data set are analyzed separately. This prevents the detection of these components, and only the emission line is detected.
NGC 7469: The
![]() data were already published by De Rosa et al. (2002a). The X-ray spectrum of the source is well fit by a power law plus a reflection component. An high energy cut-off is detected at
data were already published by De Rosa et al. (2002a). The X-ray spectrum of the source is well fit by a power law plus a reflection component. An high energy cut-off is detected at ![]() keV. De Rosa et al. (2002a) found that the reflection could be due to ionized matter. This is also indicated by the presence of a narrow emission line due to ionized iron
at
keV. De Rosa et al. (2002a) found that the reflection could be due to ionized matter. This is also indicated by the presence of a narrow emission line due to ionized iron
at
![]() keV (
keV (
![]() eV).
The results presented here are in agrement with those obtained by De Rosa et al. (2002a), although the ionized reflection has not been tested here.
eV).
The results presented here are in agrement with those obtained by De Rosa et al. (2002a), although the ionized reflection has not been tested here.
NGC 7674: The X-ray spectrum of the source is reflection dominated as reported in Malaguti et al. (1998) with the reflection component dominating at
energies above ![]() 2 keV. The FeK
2 keV. The FeK![]() emission line (
emission line (
![]() eV) is not as extreme as in other Compton-thick sources where it reaches
eV) is not as extreme as in other Compton-thick sources where it reaches
![]() keV. Nonetheless, the broadband (2-100 keV) continuum is significantly better
described by the reflection continuum rather than a power law (
keV. Nonetheless, the broadband (2-100 keV) continuum is significantly better
described by the reflection continuum rather than a power law (
![]() for two extra parameters of interest).
for two extra parameters of interest).
NGC 7679:
![]() data were previously published in Risaliti (2002). The present analysis confirms the results presented in that paper. The X-ray spectrum of the source is almost featureless above 2 keV. Here the
marginal (
data were previously published in Risaliti (2002). The present analysis confirms the results presented in that paper. The X-ray spectrum of the source is almost featureless above 2 keV. Here the
marginal (![]() 97% confidence level) detection of a FeK
97% confidence level) detection of a FeK![]() emission line at
emission line at
![]() keV is reported, and, if confirmed, it should arise from ionized matter.
keV is reported, and, if confirmed, it should arise from ionized matter.
Mark 335: Previous analysis of the
![]() data of Mark 335 were
presented in Bianchi et al. (2001). The apparent disagreement between the relativistic blurred FeK
data of Mark 335 were
presented in Bianchi et al. (2001). The apparent disagreement between the relativistic blurred FeK![]() line EW and the strength of the reflection component was discussed in terms of ionized reprocessing of the primary emission or as due to iron over abundance. Here is proposed a partial covering scenario
(covering factor
line EW and the strength of the reflection component was discussed in terms of ionized reprocessing of the primary emission or as due to iron over abundance. Here is proposed a partial covering scenario
(covering factor
![]() and
and
![]() cm-2) is proposed. The resulting photon
index (
cm-2) is proposed. The resulting photon
index (
![]() )
is rather steep, but in agreement with
previous measurements of other NLSY1 (Brandt et al. 1997;
Comastri 2000). Unlikley in Bianchi et al. (2001), no broad iron line
has been added since the excess between
)
is rather steep, but in agreement with
previous measurements of other NLSY1 (Brandt et al. 1997;
Comastri 2000). Unlikley in Bianchi et al. (2001), no broad iron line
has been added since the excess between ![]() 5-7 keV is interpreted as being
induced by the complex absorber instead of by an emission feature. On the other hand, the
EW (
5-7 keV is interpreted as being
induced by the complex absorber instead of by an emission feature. On the other hand, the
EW (
![]() eV) of the narrow FeK
eV) of the narrow FeK![]() found here
is well in agreement with what previously measured for this component
(Bianchi et al. 2001). This value is higher than what would be expected if the
line is assumed to be produced via transmission (Makishima et al. 1989), but
in agreement with what would be expected if a majority of it was produced in
an accretion disk (as expected for a type I object).
found here
is well in agreement with what previously measured for this component
(Bianchi et al. 2001). This value is higher than what would be expected if the
line is assumed to be produced via transmission (Makishima et al. 1989), but
in agreement with what would be expected if a majority of it was produced in
an accretion disk (as expected for a type I object).
Fairall 9: These data were never published before. The scenario
proposed here is based on a partial covering (
![]() and
and
![]() )
of the primary emission source.
This model is in good agreement with what was speculated by George et al.
(1998) based on
)
of the primary emission source.
This model is in good agreement with what was speculated by George et al.
(1998) based on
![]() data. Moreover, a reflection component is also
detected. The FeK
data. Moreover, a reflection component is also
detected. The FeK![]() line is centered at
line is centered at ![]() keV (in agreement
with what was found by George et al. (1998) and Gondoin et al. (2001), thus
implying the presence of a warm reprocessor.
keV (in agreement
with what was found by George et al. (1998) and Gondoin et al. (2001), thus
implying the presence of a warm reprocessor.
NGC 3516: The source is known to be variable and to display a
complex X-ray spectrum. A recent paper (Turner et al. 2005) reconciles
the behavior of the source recorded during 2001 simultaneous
![]() ,
Chandra, and XMM-Newton observations in a single scenario. In the proposed
framework, the primary emission is absorbed by at least 3 components. For
two of these, the ionization state is coupled with the
variations of intrinsic emission, and the changes of their ionization state
could explain much of the spectral variations observed in NGC 3516.
,
Chandra, and XMM-Newton observations in a single scenario. In the proposed
framework, the primary emission is absorbed by at least 3 components. For
two of these, the ionization state is coupled with the
variations of intrinsic emission, and the changes of their ionization state
could explain much of the spectral variations observed in NGC 3516.
![]() observed the source 6 times during its lifetime, recording
a flux variation of a factor of
observed the source 6 times during its lifetime, recording
a flux variation of a factor of ![]() 2.9 both in the 2-10 kev and
20-100 keV bands. For this source the adoption of a single baseline model was
hampered. For observations a, d, and f the best fit was obtained including
a relativistically broadened FeK
2.9 both in the 2-10 kev and
20-100 keV bands. For this source the adoption of a single baseline model was
hampered. For observations a, d, and f the best fit was obtained including
a relativistically broadened FeK![]() line that was unnecessary (although
not excluded) in observations b and e. In the same manner, observations c, d,
and e require a ionized absorber (modeled here with absori in XSPEC). Observations d and e also require a partial absorber (modeled with pcfabs in XSPEC). Moreover, all
the best fits adopted here also consider a total absorber that displays
strong variations from
line that was unnecessary (although
not excluded) in observations b and e. In the same manner, observations c, d,
and e require a ionized absorber (modeled here with absori in XSPEC). Observations d and e also require a partial absorber (modeled with pcfabs in XSPEC). Moreover, all
the best fits adopted here also consider a total absorber that displays
strong variations from ![]() 0 to
0 to
![]() cm-2.
The overall picture coming from the present data are in agreement
with the scenario painted by Turner et al. (2005), where the absorption is
most probably due to different components, some of which are
ionized and variable. Thus, the results reported here can be considered only as
indicators of a possible scenario, since i) the exclusion of the
data below
cm-2.
The overall picture coming from the present data are in agreement
with the scenario painted by Turner et al. (2005), where the absorption is
most probably due to different components, some of which are
ionized and variable. Thus, the results reported here can be considered only as
indicators of a possible scenario, since i) the exclusion of the
data below ![]() 2 keV have hampered any possibility of detailed
modelizations of the complex absorber and ii) the huge sensitivity of X
MM-Newton permitted us to disentangle the various components of the absorbers.
2 keV have hampered any possibility of detailed
modelizations of the complex absorber and ii) the huge sensitivity of X
MM-Newton permitted us to disentangle the various components of the absorbers.
NGC 3783: De Rosa et al. (2002b) presented these data. The source is
known to display an important soft excess that is also detected considering
only the data above ![]() 2 keV. The broadband spectrum of the source, as modeled here, is in agrement with what was previously presented (De Rosa et al. 2002b; Perola et al. 2002).
2 keV. The broadband spectrum of the source, as modeled here, is in agrement with what was previously presented (De Rosa et al. 2002b; Perola et al. 2002).
NGC 4151: The source is known to exhibit a complex absorption (see Zdziarski et al. 2002 and references therein). It has been proposed that the primary emission is obscured by a whole absorber that is mildly ionized, plus a partially covering cold screen, probably in the form of clouds. Here we tested this model, but considering a cold absorber instead of the full screen warm absorber. The addition of the warm one, in fact, is not required by the data (most probably because of the exclusion of the LECS band). The results are in agreement with previous works on the same data (Risaliti 2000), which used a slightly different parametrization of the continuum.
ESO33-G02: The
![]() data were unpublished. Previous X-ray observations of the source were carried out by Ginga (Smith & Done 1996) and ASCA (Vignali et al. 1998). In the MECS FOV, other sources are present, one of which is known to be a bright KIII peculiar star that is not expected to significantly contribute to the PDS counts.
The continuum is absorbed (as was previously observed) by a column with
data were unpublished. Previous X-ray observations of the source were carried out by Ginga (Smith & Done 1996) and ASCA (Vignali et al. 1998). In the MECS FOV, other sources are present, one of which is known to be a bright KIII peculiar star that is not expected to significantly contribute to the PDS counts.
The continuum is absorbed (as was previously observed) by a column with
![]() cm-2. This value is in good agreement with
what was observed by Ginga (
cm-2. This value is in good agreement with
what was observed by Ginga (
![]() cm-2, Smith
& Done 1996) and slightly above the measurements by ASCA
(
cm-2, Smith
& Done 1996) and slightly above the measurements by ASCA
(
![]() cm-2, Vignali et al. 1998). The shape of the
continuum, as measured by
cm-2, Vignali et al. 1998). The shape of the
continuum, as measured by
![]() ,
is typical of Seyfert galaxies and
significantly steeper (
,
is typical of Seyfert galaxies and
significantly steeper (
![]() )
than that measured by ASCA
(
)
than that measured by ASCA
(
![]() ,
Vignali et al. 1998), although it is similar to what was
measured by Ginga (
,
Vignali et al. 1998), although it is similar to what was
measured by Ginga (
![]() ,
Smith & Done 1996). The 2-10 keV
flux of the
source (
,
Smith & Done 1996). The 2-10 keV
flux of the
source (
![]() erg s-1 cm-2) is half
of what was previously measured by ASCA and Ginga. An iron emission line is
detected at
erg s-1 cm-2) is half
of what was previously measured by ASCA and Ginga. An iron emission line is
detected at ![]() 6.4 keV with
6.4 keV with
![]() eV which is consistent with Ginga
and ASCA results. A reflection component is also observed (
eV which is consistent with Ginga
and ASCA results. A reflection component is also observed (
![]() ,
90%
confidence), while the energy of
,
90%
confidence), while the energy of ![]() is
unconstrained (
is
unconstrained (
![]() keV).
As previously noted by Vignali et al. (1998), the absorber is complex and the
best fit reported here includes a partial covering component that hides
keV).
As previously noted by Vignali et al. (1998), the absorber is complex and the
best fit reported here includes a partial covering component that hides
![]() 70% of the primary emission with a
70% of the primary emission with a
![]() cm-2 column. On the contrary,
Vignali et al.
(1998) reported a reprocessor covering
cm-2 column. On the contrary,
Vignali et al.
(1998) reported a reprocessor covering ![]() 35% of the primary continuum
and with a much lower column (
35% of the primary continuum
and with a much lower column (
![]() cm-2).
Once corrected for the partial absorption, the 2-10 keV flux is
cm-2).
Once corrected for the partial absorption, the 2-10 keV flux is
![]() erg s-1 cm-2, that is
erg s-1 cm-2, that is
![]() 2 times above the Ginga and ASCA values, thus indicating that absorption
is leading the flux dimming. The overall scenario is that ESO33-G02 seems to be
a high luminosity Seyfert galaxy (with intrinsic
2 times above the Ginga and ASCA values, thus indicating that absorption
is leading the flux dimming. The overall scenario is that ESO33-G02 seems to be
a high luminosity Seyfert galaxy (with intrinsic
![]() erg s-1) that displays two different absorber: a) a stable one with
approximatively the same column measured in a
erg s-1) that displays two different absorber: a) a stable one with
approximatively the same column measured in a ![]() 10-year-long sparse
monitoring, and b) a variable and probably cloudy one that showed strong
variations between the the ASCA and
10-year-long sparse
monitoring, and b) a variable and probably cloudy one that showed strong
variations between the the ASCA and
![]() observations.
observations.
MARK 766:
![]() observed MARK 766 twice. The first observation
was previously published by Matt et al. (2000b). Present results are perfectly in agreement with those obtained by Matt et al.l (2000b) with the detection
of an edge at
observed MARK 766 twice. The first observation
was previously published by Matt et al. (2000b). Present results are perfectly in agreement with those obtained by Matt et al.l (2000b) with the detection
of an edge at
![]() keV with
keV with
![]() and no indication of
the presence of an emission FeK
and no indication of
the presence of an emission FeK![]() line. The second observation was not
published before. In this case, no edge has been measured above
line. The second observation was not
published before. In this case, no edge has been measured above ![]() 7 keV,
while a marginal detection of the FeK
7 keV,
while a marginal detection of the FeK![]() line has been obtained at
line has been obtained at
![]() keV.
keV.
IRAS 13197-1627: The source was first detected in X-rays by ASCA
(Ueno 1995). The X-ray spectrum of the source is dominated by a complex
absorber (Dadina & Cappi 2004) that hides a QSO-like nucleus. Here, the
absorber has been modeled with a partial covering model
(
![]() cm-2,
cm-2,
![]() )
that is in agreement with what was reported
in Dadina & Cappi (2004).
Another interesting property of the source is its steep continuum
(
)
that is in agreement with what was reported
in Dadina & Cappi (2004).
Another interesting property of the source is its steep continuum
(
![]() ,
depending on the modelization of the absorber).
This value is not typical of a Seyfert galaxy or a QSO (
,
depending on the modelization of the absorber).
This value is not typical of a Seyfert galaxy or a QSO (
![]() ,
Smith and Done 1996, Turner et al. 1997) and is more similar to what observed
in NLSy1 (Brandt et al. 1997).
,
Smith and Done 1996, Turner et al. 1997) and is more similar to what observed
in NLSy1 (Brandt et al. 1997).
3C 445: The data were presented in Balmaverde et al. (2006). Here the fit does not contain the reflection component tested by these authors since the exclusion of the LECS data and the statistics prevent the testing of models too complicated. The results obtained here for the partial covering model
(
![]() and
and
![]() cm-2) are in agreement with what was reported by Balmaverde et al. (2006).
cm-2) are in agreement with what was reported by Balmaverde et al. (2006).
NGC 7582: Turner et al. (2000) presented the analysis of the
![]() observation of NGC 7582. They interpreted the X-ray spectrum in terms of complex absorption due to two components: one covering the entire source (
observation of NGC 7582. They interpreted the X-ray spectrum in terms of complex absorption due to two components: one covering the entire source (
![]() cm-2) and the second covering
cm-2) and the second covering ![]() 60% of the
high energy source with
60% of the
high energy source with
![]() cm-2. Here a
slightly different model is proposed. An absorption edge is detected at
cm-2. Here a
slightly different model is proposed. An absorption edge is detected at
![]() keV with
keV with
![]() ,
i.e., not consistent with the origin from neutral matter. The origin of the edge could be ascribed either to
an ionized reflection or an absorption component. Both hypotheses
have been tested, but none gave a significant improvement in the quality of
the fit.
,
i.e., not consistent with the origin from neutral matter. The origin of the edge could be ascribed either to
an ionized reflection or an absorption component. Both hypotheses
have been tested, but none gave a significant improvement in the quality of
the fit.
In this section the X-ray spectra of the sources are presented. For each source the data-to-model ratio for an absorbed power law fit, the best-fit model and its data-to-model ratio are presented as sketched in Fig. C.1. The data-to-model ratios are expressed in terms of standard deviation.
![\begin{figure}\par\includegraphics[width=14cm]{aa5734fc2.eps}
\end{figure}](/articles/aa/full/2007/03/aa5734-06/img743.gif)
![\begin{figure}\par\mbox{\parbox{7.2cm}{\hspace{2.5cm}{\bf Fairall 9}
\par \inclu...
...ludegraphics[width=1.9cm,height=6.88cm,angle=270]{5734fi31.ps}
} }\end{figure}](/articles/aa/full/2007/03/aa5734-06/img744.gif)
![\begin{figure}\par\mbox{\parbox{7.2cm}{\hspace{2.5cm}{\bf NGC 1068 -b}
\par \inc...
...ludegraphics[width=1.9cm,height=6.88cm,angle=270]{5734fi49.ps}
} }\end{figure}](/articles/aa/full/2007/03/aa5734-06/img745.gif)
![\begin{figure}\par\mbox{\parbox{7.2cm}{\hspace{2.5cm}{\bf NGC 1386}
\par \includ...
...ludegraphics[width=1.9cm,height=6.88cm,angle=270]{5734fi67.ps}
} }\end{figure}](/articles/aa/full/2007/03/aa5734-06/img746.gif)
![\begin{figure}\par\mbox{\parbox{7.2cm}{\hspace{2.5cm}{\bf NGC 2110}
\par \includ...
...ludegraphics[width=1.9cm,height=6.88cm,angle=270]{5734fi85.ps}
} }\end{figure}](/articles/aa/full/2007/03/aa5734-06/img747.gif)
![\begin{figure}\par\mbox{\parbox{7.2cm}{\hspace{2.5cm}{\bf MKN 6}
\par \includegr...
...ludegraphics[width=1.9cm,height=6.88cm,angle=270]{5734f103.ps}
} }\end{figure}](/articles/aa/full/2007/03/aa5734-06/img748.gif)
![\begin{figure}\par\mbox{\parbox{7.2cm}{\hspace{2.5cm}{\bf NGC 2992 -a}
\par \inc...
...ludegraphics[width=1.9cm,height=6.88cm,angle=270]{5734f121.ps}
} }\end{figure}](/articles/aa/full/2007/03/aa5734-06/img749.gif)
![\begin{figure}\par\mbox{\parbox{7.2cm}{\hspace{2.5cm}{\bf NGC 3079 -b}
\par \inc...
...ludegraphics[width=1.9cm,height=6.88cm,angle=270]{5734f139.ps}
} }\end{figure}](/articles/aa/full/2007/03/aa5734-06/img750.gif)
![\begin{figure}\par\mbox{\parbox{7.2cm}{\hspace{2.5cm}{\bf NGC 3516 -b}
\par \inc...
...ludegraphics[width=1.9cm,height=6.88cm,angle=270]{5734f157.ps}
} }\end{figure}](/articles/aa/full/2007/03/aa5734-06/img751.gif)
![\begin{figure}\par\mbox{\parbox{7.2cm}{\hspace{2.5cm}{\bf NGC 3660}
\par \includ...
...ludegraphics[width=1.9cm,height=6.88cm,angle=270]{5734f175.ps}
} }\end{figure}](/articles/aa/full/2007/03/aa5734-06/img752.gif)
![\begin{figure}\par\mbox{\parbox{7.2cm}{\hspace{2.5cm}{\bf NGC 4151 -b}
\par \inc...
...ludegraphics[width=1.9cm,height=6.88cm,angle=270]{5734f193.ps}
} }\end{figure}](/articles/aa/full/2007/03/aa5734-06/img753.gif)
![\begin{figure}\par\mbox{\parbox{7.2cm}{\hspace{2.5cm}{\bf NGC 4261}
\par \includ...
...ludegraphics[width=1.9cm,height=6.88cm,angle=270]{5734f211.ps}
} }\end{figure}](/articles/aa/full/2007/03/aa5734-06/img754.gif)
![\begin{figure}\par\mbox{\parbox{7.2cm}{\hspace{2.5cm}{\bf NGC 4507 -a}
\par \inc...
...ludegraphics[width=1.9cm,height=6.88cm,angle=270]{5734f229.ps}
} }\end{figure}](/articles/aa/full/2007/03/aa5734-06/img755.gif)
![\begin{figure}\par\mbox{\parbox{7.2cm}{\hspace{2.5cm}{\bf IC 3639}
\par \include...
...ludegraphics[width=1.9cm,height=6.88cm,angle=270]{5734f247.ps}
} }\end{figure}](/articles/aa/full/2007/03/aa5734-06/img756.gif)
![\begin{figure}\par\mbox{\parbox{7.2cm}{\hspace{2.5cm}{\bf NGC 4945}
\par \includ...
...ludegraphics[width=1.9cm,height=6.88cm,angle=270]{5734f268.ps}
} }\end{figure}](/articles/aa/full/2007/03/aa5734-06/img757.gif)
![\begin{figure}\par\mbox{\parbox{7.2cm}{\hspace{2.5cm}{\bf Centaurus A -d}
\par \...
...ludegraphics[width=1.9cm,height=6.88cm,angle=270]{5734f286.ps}
} }\end{figure}](/articles/aa/full/2007/03/aa5734-06/img758.gif)
![\begin{figure}\par\mbox{\parbox{7.2cm}{\hspace{2.5cm}{\bf MARK 266}
\par \includ...
...ncludegraphics[width=1.9cm,height=6.88cm,angle=270]{5734f304.ps}}
}
\end{figure}](/articles/aa/full/2007/03/aa5734-06/img759.gif)
![\begin{figure}\par\mbox{\parbox{7.2cm}{\hspace{2.5cm}{\bf MKN 463}
\par \include...
...ludegraphics[width=1.9cm,height=6.88cm,angle=270]{5734f322.ps}
} }\end{figure}](/articles/aa/full/2007/03/aa5734-06/img760.gif)
![\begin{figure}\par\mbox{\parbox{7.2cm}{\hspace{2.5cm}{\bf NGC 5548 -a}
\par \inc...
...ludegraphics[width=1.9cm,height=6.88cm,angle=270]{5734f340.ps}
} }\end{figure}](/articles/aa/full/2007/03/aa5734-06/img761.gif)
![\begin{figure}\par\mbox{\parbox{7.2cm}{\hspace{2.5cm}{\bf NGC 5643}
\par \includ...
...ludegraphics[width=1.9cm,height=6.88cm,angle=270]{5734f358.ps}
} }\end{figure}](/articles/aa/full/2007/03/aa5734-06/img762.gif)
![\begin{figure}\par\mbox{\parbox{7.2cm}{\hspace{2.5cm}{\bf NGC 6212}
\par \includ...
...ludegraphics[width=1.9cm,height=6.88cm,angle=270]{5734f376.ps}
} }\end{figure}](/articles/aa/full/2007/03/aa5734-06/img763.gif)
![\begin{figure}\par\mbox{\parbox{7.2cm}{\hspace{2.5cm}{\bf 3C 390.3}
\par \includ...
...ludegraphics[width=1.9cm,height=6.88cm,angle=270]{5734f394.ps}
} }\end{figure}](/articles/aa/full/2007/03/aa5734-06/img764.gif)
![\begin{figure}\par\mbox{\parbox{7.2cm}{\hspace{2.5cm}{\bf MKN 509 -b}
\par \incl...
...ncludegraphics[width=1.9cm,height=6.88cm,angle=270]{5734f412.ps}}
}
\end{figure}](/articles/aa/full/2007/03/aa5734-06/img765.gif)
![\begin{figure}\par\mbox{\parbox{7.2cm}{\hspace{2.5cm}{\bf S52116+81 -b}
\par \in...
...ludegraphics[width=1.9cm,height=6.88cm,angle=270]{5734f430.ps}
} }\end{figure}](/articles/aa/full/2007/03/aa5734-06/img766.gif)
![\begin{figure}\par\mbox{\parbox{7.2cm}{\hspace{2.5cm}{\bf NGC 7213 -c}
\par \inc...
...ludegraphics[width=1.9cm,height=6.88cm,angle=270]{5734f448.ps}
} }\end{figure}](/articles/aa/full/2007/03/aa5734-06/img767.gif)
![\begin{figure}\par\mbox{\parbox{7.2cm}{\hspace{2.5cm}{\bf AKN 564 -c}
\par \incl...
...ncludegraphics[width=1.9cm,height=6.88cm,angle=270]{5734f466.ps}}
}
\end{figure}](/articles/aa/full/2007/03/aa5734-06/img768.gif)
![\begin{figure}\par\mbox{\parbox{7.2cm}{\hspace{2.5cm}{\bf NGC~7674}
\par \includ...
...ludegraphics[width=1.9cm,height=6.88cm,angle=270]{5734f472.ps}
} }\end{figure}](/articles/aa/full/2007/03/aa5734-06/img769.gif)