A&A 459, 977-980 (2006)
DOI: 10.1051/0004-6361:20065967
P. P. Korsun1 - O. V. Ivanova1 - V. L. Afanasiev2
1 - Main Astronomical Observatory of NAS of Ukraine,
Akademika Zabolotnoho 27, 03680 Kyiv, Ukraine
2 -
Special Astrophysical Observatory of the Russian AS,
Nizhnij Arkhyz, 369167, Russia
Received 4 July 2006 / Accepted 3 August 2006
Abstract
Aims. We have started a program of spectroscopic and photometric investigations of distant active comets in the optical domain. The comets with a significant level of activity-in particular, extended tails-are the objects of our observations.
Methods. The observations were made at the 6-m telescope BTA (SAO RAS, Russia), with the focal reducer SCORPIO attached to the prime focus of the telescope. Long-slit and photometry modes were turned to perform our first observations. The spectral resolution in the spectroscopy mode was 10 Å.
Results. The result of the spectrum analysis of comet C/2002 VQ94 (LINEAR) is of particular interest. The comet observed at the heliocentric distance of 6.8 AU clearly shows a rich molecular spectrum. We identified 14 vibrational bands of CO+ (Comet Tail system), emissions of C3, and some tentatively assigned to N2+ and CN. It should be emphasized that, for now, CO+ and tentatively assigned N2+ emissions are detected at a record heliocentric distance.
Key words: line: identification - comets: individual: C/2002 VQ94
A new object of 19th magnitude discovered by the LINEAR team on
November 11.24 UT, 2002
was reported as an asteroid (Marsden 2002). The heliocentric
and geocentric distances were 10.02 AU and 9.16 AU, respectively, at the moment of discovery.
With perihelion at 6.8 AU, an orbit inclination of 70
![]() 5, and
a 3110 year orbit it was assigned as a distant minor planet
(Marsden 2003a).
The asteroid A/2002 VQ94 (LINEAR) was observed by Tegler et al. (2003)
in their continuing
photometric survey. Color indices,
5, and
a 3110 year orbit it was assigned as a distant minor planet
(Marsden 2003a).
The asteroid A/2002 VQ94 (LINEAR) was observed by Tegler et al. (2003)
in their continuing
photometric survey. Color indices,
![]() ,
,
![]() ,
,
![]() ,
were measured on December 31, 2002. Cometary activity of the object
was first detected at the end of August 2003, when the distance
from the Sun was 8.9 AU. A prominent 10
,
were measured on December 31, 2002. Cometary activity of the object
was first detected at the end of August 2003, when the distance
from the Sun was 8.9 AU. A prominent 10
![]() coma with a fanlike
morphology spanning p.a. 180-300
coma with a fanlike
morphology spanning p.a. 180-300![]() was found on images taken on
August 28.5 UT with the University of Hawaii 2.2-m telescope (Green 2003).
The object was put in cometary list as C/2002 VQ94
(LINEAR) (Parker 2003). Marsden (2003b)
suggests that this is not a "new'' comet from the Oort cloud, after
analyzing the barycentric values of 1/a.
was found on images taken on
August 28.5 UT with the University of Hawaii 2.2-m telescope (Green 2003).
The object was put in cometary list as C/2002 VQ94
(LINEAR) (Parker 2003). Marsden (2003b)
suggests that this is not a "new'' comet from the Oort cloud, after
analyzing the barycentric values of 1/a.
We observed comet C/2002 VQ94 (LINEAR) on March 9.88, 2006. The
heliocentric distance was 6.80 AU (32 days after perihelion) and the
geocentric distance was 5.74 AU (5 days after the closest distance
from the Earth). The observations were made at the 6-m telescope BTA
(SAO RAS, Russia) with the focal reducer SCORPIO attached to the
prime focus of the telescope. Details of the SCORPIO device were
described elsewhere by Afanasiev & Moiseev (2005). We used
the SCORPIO in two modes, CCD photometry in broad-band filters and
long-slit spectroscopy. A CCD chip EEV-42-40 of
![]() pixels was used as the detector. A full field of view of the
detector is
pixels was used as the detector. A full field of view of the
detector is
![]() with an image scale of 0.18
with an image scale of 0.18
![]() /pix. In the photometry mode, the comet was observed
through V and R filters, while in the spectroscopy mode a long-slit
mask with
/pix. In the photometry mode, the comet was observed
through V and R filters, while in the spectroscopy mode a long-slit
mask with
![]() dimensions was inserted into
the light cone. Additionally, the transparent grism VPHG550G was
used as a disperser. The spectral resolution of our spectra was 10 Å. Six spectroscopic exposures, each of 300 s duration, were
obtained in these observations.
dimensions was inserted into
the light cone. Additionally, the transparent grism VPHG550G was
used as a disperser. The spectral resolution of our spectra was 10 Å. Six spectroscopic exposures, each of 300 s duration, were
obtained in these observations.
The raw frames with observed data were reduced in a standard manner.
Cleaning from cosmic ray events was the first step in the spectra
reductions. Further, we removed bias as the averaged set of the CCD images with zero time exposures. Broad-band images were flat-fielded
using observations of the morning sky. Flat-fielding of the spectral
observations was performed using spectra of a lamp with smooth
variation in energy distribution. Wavelength assignments were made
by exposing an He-Ne-Ar-filled lamp. To increase the signal/noise
ratio of the observed data, we coadded all the images obtained
through the V filter and further analyzed the integrated image. The
same was done with the images obtained through the R filter and
spectroscopic data. Additionally, broad-band images were binned
![]() and spectra binned
and spectra binned ![]() ,
that is, in the slit
direction.
,
that is, in the slit
direction.
![\begin{figure}
\par\includegraphics[width=8.4cm,clip]{5967fig1.eps}
\end{figure}](/articles/aa/full/2006/45/aa5967-06/img14.gif) |
Figure 1:
The 90
|
| Open with DEXTER | |
Figure 1 is an illustration on the observed data. It is
clear that the observed object has a cometary nature. It has a
fan-like short tail extended over 60
![]() and declined from the
extended radius vector. It should be pointed out that the morphology
of the tail is not typical of distant comets. The tails of distant
comets are narrow and slightly curved, without broadening along the
tail. This is not the case. Unfortunately, because of the time
limitation on observations, the slit was not oriented along the
tail.
and declined from the
extended radius vector. It should be pointed out that the morphology
of the tail is not typical of distant comets. The tails of distant
comets are narrow and slightly curved, without broadening along the
tail. This is not the case. Unfortunately, because of the time
limitation on observations, the slit was not oriented along the
tail.
To provide photometric calibration of our observations, the star BD+75d325 was observed as a spectrophotometric standard (Oke 1990). The spectral atmospheric transparency at Special Astronomical Observatory has been taken from Kartasheva & Chunakova (1978). The above-mentioned reductions were performed using programs running under IDL and prepared by Afanasiev. As we have had problems with the photometric calibration of the broad-band observations, we only report here the results of the spectroscopic data analysis.
![\begin{figure}
\par\includegraphics[width=15cm,clip]{5967fig2.eps} \end{figure}](/articles/aa/full/2006/45/aa5967-06/img15.gif) |
Figure 2: Observed spectrum and flux ratio plot comet/Sun for C/2002 VQ94 (LINEAR). Assigned molecular emissions are marked. Filled features at the bottom of the plot show the CO+ spectrum calculated under the Boltzmann approximation (Kim 1994, 1998). |
| Open with DEXTER | |
![\begin{figure}
\par\includegraphics[width=15cm,clip]{5967fig3.eps}
\end{figure}](/articles/aa/full/2006/45/aa5967-06/img16.gif) |
Figure 3: Spectrum of comet C/2002 VQ94 (LINEAR) ( top) is displayed together with a part of the comet Humason (1962 VIII) spectrogram ( bottom) to compare available molecular emissions. The spectrogram of comet Humason is taken from Arpigny (1972). Identifications of principal features are indicated as well. |
| Open with DEXTER | |
Spectroscopic observations of distant objects in the Solar system with cometary activity are not numerous. Only a few emissions of gaseous species have been observed in the optical domain at large distances, beyond 5 AU. Molecular emissions have only been detected in the peculiar periodic comet Schwassmann-Wachmann 1 (CO+, CN), giant comet Hale-Bopp (CN, C3), and centaur Chiron (CN).
The aim of our spectroscopic observations was to study the reflectivity of the dust and search for molecular emissions in the coma of distant comets. To obtain the dust reflectivity we divided the observed spectrum by a solar one obtained by convolving our slit function with the Neckel & Labs (1984) solar spectrum. One can see the result in Fig. 2. The flux ratio comet/Sun shows evidence of the well-defined growth toward red wavelengths. The plot is roughly linear in the 4700-7200 Å wavelength region with a color gradient of 15% per 1000 Å assuming normalization at 5500 Å.
The surprising thing is that the observed spectrum shows evidently
rich molecular emissions. The strongest and the most dispersed along
the observed spectral window are the comet-tail bands of CO+. The
(3, 0), (2, 0), (1, 0), (5, 1), (3, 1), (2, 1), (4, 2), (3, 2), (0, 0),
(1, 1), (2, 2), (0, 1), (0, 2), and (1, 2) vibrational transitions of the
![]() -
-![]() band system of CO+ are seen clearly in Fig. 2. Their assignments were made using the Ultraviolet and
Visible Spectroscopic Database for Atoms and Molecules in Celestial
Objects compiled by Kim (1994, 1998) and
fluorescence calculations by Arpigny (1964) and Magnani &
A'Hearn (1986).
band system of CO+ are seen clearly in Fig. 2. Their assignments were made using the Ultraviolet and
Visible Spectroscopic Database for Atoms and Molecules in Celestial
Objects compiled by Kim (1994, 1998) and
fluorescence calculations by Arpigny (1964) and Magnani &
A'Hearn (1986).
The (3, 0) band of CO+ is contaminated by the (020-000)
vibrational band of the C3 emissions. The (000-000) and (000-020)
vibrational bands of the
![]() transition are present
as well (Gausset et al. 1965).
transition are present
as well (Gausset et al. 1965).
The broad spectral feature with local maxima at 3884 Å and 3904 Å coincides with the (5, 1) vibrational band of CO+. Nevertheless, the intensity of the (5, 1) band is much lower so as to fit the feature. Two additional emissions, namely, the (0, 0) vibrational band of the CN violet system and the (0, 0) band of N2+, can resolve the problem. The presence of the CN emissions looks natural, as it is observed in comets at large heliocentric distances, while the presence of N2+ is questionable and will be discussed in the next section. We consider the above-mentioned identification of CN and N2+ as tentative assignments. To assign them we used the LIFBASE software (Luque & Crosley 1999). Other emissions, which are undoubtedly present in the spectrum, remain unassigned.
We observed a distant comet with an unusual spectroscopic
appearance. The obtained spectrum is rich in CO+. Fourteen
emission bands of the comet-tail bands of CO+ are detected at the
heliocentric distance of 6.8 AU in the observed spectral window. So
far, CO+ beyond Jupiter's orbit has been recorded in the peculiar
periodic comet 29P/Schwassmann-Wachmann 1, at ![]() AU (Larson
1980; Cochran et al. 1982). Moreover, only the
two strongest bands of CO+, (2, 0) and (3, 0), have been assigned
in the later spectra.
AU (Larson
1980; Cochran et al. 1982). Moreover, only the
two strongest bands of CO+, (2, 0) and (3, 0), have been assigned
in the later spectra.
There was only once when the C3 emissions were observed at large
heliocentric distances, namely, at 7.0 AU in Comet Hale-Bopp (Rauer
et al. 2003). There is no doubt that we detect the C3emissions, too, as three features in our spectra are coincident with
the strongest (000-000), (000-020), and (020-000) vibrational
transitions of the
![]() system of C3.
system of C3.
We consider the CN and N2+ emissions to be tentatively assigned. There is no surprise for the CN assignment, as it was previously observed in comets at larger heliocentric distances. CN has been observed in Chiron at a record heliocentric distance, 11.3 AU (Bus et al. 1991), and at 9.8 AU in Comet Hale-Bopp (Rauer et al. 2003).
Some uncertainty exists in the N2+ case. The N2+ emissions are rarely observed in comets. Lutz et al. (1993) and Wyckoff & Theobald (1989) report detecting N2+ in the tails of comets Halley and C/1987 P1 (Bradfild). While Cochran et al. (1992,2000,2002) has evidence of three comets for which no N2+ was detected in high-resolution spectra. Arpigny examined collections of photographic spectra (Swigs & Haser 1956) and other data at his disposal and estimated the intensity ratio for N2+/CO+ in 12 comets (Cochran et al. 2000). The record detection of N2+ was reported for comet Humason (1962 VIII) at 2.6 AU (Greenstein & Arpigny 1962).
Our spectrum was checked carefully against a potential confusion
with N+2 emissions from airglow. We observed a long-slit
spectrum. The height of the slit was 6.1![]() ,
whereas the coma
of the comet was extended along the slit less than 1'. Thus,
we examined the spectrum where it was free of the cometary emissions
and found no detectable spectral feature near 3910 Å. Cochran
(2002) reviewed the problem of terrestrial N+2 and
argues that telluric N+2 can only be found in dayglow spectra,
while we made the spectroscopic observations when it was
astronomical night.
,
whereas the coma
of the comet was extended along the slit less than 1'. Thus,
we examined the spectrum where it was free of the cometary emissions
and found no detectable spectral feature near 3910 Å. Cochran
(2002) reviewed the problem of terrestrial N+2 and
argues that telluric N+2 can only be found in dayglow spectra,
while we made the spectroscopic observations when it was
astronomical night.
Additional arguments in favor of the identification of N2+ in the spectrum of comet C/2002 VQ94 (LINEAR) are the following speculations. Hill et al. (2001) argue that comets, formed early in nebular history, should be rich in CO, CO2, N2, and amorphous dust. We consider that the discussed here comets are CO-rich objects formed under similar conditions in the Solar nebula: Morehouse (1908 II), Humason (1962 VIII), and C/2002 VQ94 (LINEAR). They show essential distinctions when comparing their spectra with typical cometary spectra where the neutral molecules are much more abundant than CO+ (Swigs & Haser 1956). The spectra of CO-rich comets show the significant predominance of CO+, the strong emissions of CN and N2+, and the measurable C3 features. It should also be emphasized that the comets mentioned above show similar spectroscopic features at significantly different heliocentric distances (1.4 AU for Comet Morehouse (1908 II) (Fowler 1912), 2.6 AU for comet Humason (1962 VIII) (Greenstein & Arpigny 1962), and 6.8 AU for C/2002 VQ94 (LINEAR)). Figure 3 is a convincing illustration of our discussion, reproducing relative intensity plot of the observed spectrum of comet C/2002 VQ94 (LINEAR) and part of the Palomar plate with the spectrum of comet Humason (1962 VIII) (Arpigny 1972), where they are overlapping.
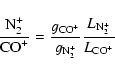
Estimating N2+/CO+ is of fundamental importance. To derive the ratio we should measure intensities of the CO+ and N2+ emissions. First, a scaled solar spectrum was subtracted from the observed one. Further, the rest continuum caused by the wavelength efficiency of the solar-light scattering by the cometary dust was removed by subtracting a low-frequency polynomial from the previous result. The detected N2+ is contaminated by the CO+ (5, 1) and CN (0, 0) bands. To estimate the contribution of N2+ to the low-resolution feature, we modeled the CO+ (5, 1) and CN (0, 0) emissions using laboratory data. As for the CO+ emissions, we measured the (2, 0) band.
Once the band intensity is known, the column density can be computed
using
Acknowledgements
The observations were performed thanks to the support of the Schedule Committee for Large Telescopes (Russian Federation).