A&A 459, 945-953 (2006)
DOI: 10.1051/0004-6361:20065871
Modeling the Sun's open magnetic flux
M. Schüssler1 - I. Baumann2
1 - Max-Planck-Institut für Sonnensystemforschung, 37191
Katlenburg-Lindau, Germany
2 - Royal Observatory of Belgium, Avenue Circulaire 3, 1180 Bruxelles, Belgium
Received 21 June 2006 / Accepted 10 August 2006
Abstract
Context. The heliospheric magnetic field can be extrapolated from the photospheric field distribution using models based upon various approximations. Such models are required for the reconstruction of the open solar magnetic flux prior to the time of direct measurements on the basis of surface flux transport simulations.
Aims. We evaluate the consistency of extrapolation models with direct measurements of the heliospheric magnetic field. Furthermore, we study whether extrapolations on the basis of a surface flux transport model for the photospheric magnetic field reproduce the temporal evolution of the measured near-Earth magnetic field.
Methods. We use the potential field source surface (PFSS) model and the current sheet source surface (CSSS) model to extrapolate the heliospheric field on the basis of the Wilcox Solar Observatory (WSO) synoptic maps of the solar surface field from 1976-2005. The results are compared with the near-Earth measurements of the radial heliospheric field and its independence of latitude found with Ulysses. Furthermore, we determine extrapolations on the basis of photospheric flux distributions computed with a surface flux transport code, using as input sunspot group areas from the SOON database.
Results. The CSSS model based upon WSO data, with a source surface located at 
 and cusp surface at
 ,
yields the best agreement with the measurements. The flux transport simulations reproduce the observed surface flux together with the open flux if the tilt angle of emerging bipolar magnetic regions is smaller than commonly assumed, but consistent with sunspot observations.
,
yields the best agreement with the measurements. The flux transport simulations reproduce the observed surface flux together with the open flux if the tilt angle of emerging bipolar magnetic regions is smaller than commonly assumed, but consistent with sunspot observations.
Conclusions. The CSSS model with a source surface in the vicinity of the Alfvénic point of the solar wind leads to a good extrapolation of the heliospheric field from solar surface data. A surface flux transport model based upon sunspot data with consistently calibrated tilt angles reproduces the observed evolution of the solar total open flux.
Key words: Sun: magnetic fields - Sun: corona
1 Introduction
The fraction of the Sun's magnetic surface flux which is not contained
in closed loops but reaches out far into the heliosphere is denoted as
the Sun's open magnetic flux. Measurements outside the ecliptic plane
with the Ulysses space probe covering nearly the full range of
heliographic latitudes have shown that the strength of the radial
component of the heliospheric field is largely independent of latitude
(except for a sudden polarity change at the heliospheric current sheet),
so that the solar open flux is almost uniformly distributed on spherical
surfaces. This result holds during solar activity minimum
(Balogh et al. 1995; Smith & Balogh 1995) as well as solar maximum
(Smith et al. 2003; Smith & Balogh 2003) periods. It is consistent with the
dominance of the heliospheric current for shaping the heliospheric field
(e.g., Wolfson 1985) into a split monopole configuration
(Banaszkiewicz et al. 1998).
The latitude-independence of the radial heliospheric field component
gives the opportunity to infer the total open flux and its time
variation on the basis of the interplanetary magnetic field measured
near Earth. The results can then be used to test and calibrate models
that extrapolate the heliospheric field from its photospheric sources.
Such calibration is particularly important for reconstructing the solar
open flux in the past with solar surface flux transport simulations
based upon sunspot group areas, sunspot numbers, or other proxies. In
this way, the simplified reconstruction models of
Solanki et al. (2000,2002) can be validated and
improved.
The present paper addresses two topics. Firstly, we study the latitude
distribution and the time evolution of the radial component of the
heliospheric magnetic field arising from extrapolations on the basis of
the observed photospheric field. In particular, we consider the
potential field source surface model (PFSS, Schatten et al. 1969) and
the current sheet source surface model (CSSS, Zhao & Hoeksema 1995)
and study, under which conditions such models can reproduce the
latitude-independent field found with Ulysses and the time
evolution of the interplanetary field near Earth shown by the OMNI dataset over the last three solar cycles (see also Wang & Sheeley 1995; Wang et al. 2002; Wang 1993; Wang & Sheeley 2002).
The second (and main) focus of this paper is on the question whether
photospheric flux distributions from surface flux transport simulations
coupled with extrapolation models can reproduce the heliospheric field
measurements over multiple solar cycles. Mackay et al. (2002b)
found that flux transport simulations with commonly used prescriptions
for the transport processes leads to the open flux being in antiphase
with the activity cycle, which is in disagreement with the
observations. We show here that this result is probably due to a too
steep latitude profile for the tilt angle of bipolar magnetic regions
with respect to the East-West direction. This tilt is the key ingredient
for the reversal and build-up of opposite-polarity polar fields in the
course of the solar cycle. We derive the tilt angle profile
consistently through comparison of flux transport simulations with
photospheric field observations, resulting in a less steep profile than
commonly used. With such calibration, the time evolution of the solar
open flux throughout the last three solar cycles is well reproduced by
the flux transport model, without requiring further adjustments.
This paper is organized as follows. In Sect. 2, we give a brief
description of the two extrapolation models used. We present our results
in Sect. 3, beginning with the extrapolations from observed photospheric
fields in Sect. 3.1, followed by the calibration of the flux transport
model and the determination of the open flux on the basis of simulated
photospheric flux distributions in Sect. 3.2. We discuss the results and
give our conclusions in Sect. 4.
2 Extrapolation methods
2.1 Potential field source surface (PFSS) model
In this widely used model, originally proposed by Schatten et al. (1969)
and Altschuler & Newkirk (1969), the coronal magnetic field is assumed
to be potential and can thus be obtained by solving the Laplace equation
in a spherical shell bounded by the photosphere and the source surface
(usually placed at
 ), where the magnetic field is
assumed to be purely radial, being dragged out by the solar wind in the
region beyond the source surface. The solution for the radial magnetic
field component on the source surface is expressed in the form
), where the magnetic field is
assumed to be purely radial, being dragged out by the solar wind in the
region beyond the source surface. The solution for the radial magnetic
field component on the source surface is expressed in the form
 |
|
|
(1) |
where  and
and  are the heliographic latitude and longitude,
respectively, and
are the heliographic latitude and longitude,
respectively, and
 are the spherical surface
harmonics. The quantities
are the spherical surface
harmonics. The quantities
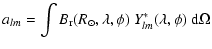 |
|
|
(2) |
are the complex harmonic coefficients of the surface magnetic field, and
![$\displaystyle %
c_l(R_{{\rm ss}})=\left(\frac{R_{\odot}}{R_{{\rm ss}}} \right)^...
...[\frac
{l+1+l(r/R_{\rm ss})^{2l+1}}{l+1+l(R_{\odot}/R_{\rm ss})^{2l+1}}
\right]$](/articles/aa/full/2006/45/aa5871-06/img21.gif) |
|
|
(3) |
are the radial damping coefficients (e.g., Wang & Sheeley 1992).
In order to improve the PFSS model, particularly concerning the topology
of the field near coronal streamers, Schatten (1972) suggested an extrapolation model that allows for current sheets. In a first step, a potential field solution is derived for the whole external region. Then
a spherical "cusp surface'' is defined (located at
 ), beyond which no closed field lines are assumed to exist. In
order to calculate such a solution, inward pointing field vectors on the
cusp surface are temporarily reversed and, based upon this boundary
condition, a new potential field solution is calculated outside the cusp
surface. Thereafter, the condition
), beyond which no closed field lines are assumed to exist. In
order to calculate such a solution, inward pointing field vectors on the
cusp surface are temporarily reversed and, based upon this boundary
condition, a new potential field solution is calculated outside the cusp
surface. Thereafter, the condition
 is restored
by reinstating the original orientation of the field vectors. This
creates discontinuities (corresponding to the locations of current
sheets) in the field distribution outward of the cusp surface. The
procedure is justified by the fact that the Maxwell stress tensor is
independent of the sign of the magnetic field.
is restored
by reinstating the original orientation of the field vectors. This
creates discontinuities (corresponding to the locations of current
sheets) in the field distribution outward of the cusp surface. The
procedure is justified by the fact that the Maxwell stress tensor is
independent of the sign of the magnetic field.
Zhao & Hoeksema (1994) replaced the potential field in the region
inward of the cusp surface by a magnetostatic model of the corona.
Later, these authors extended their model by reintroducing a source
surface with purely radial magnetic field, thus creating the current
sheet source surface (CSSS) model (Zhao & Hoeksema 1995). Here we
consider the latter model in addition to the PFSS model.
We should note that, owing to the restoration of the original field
direction on the cusp surface, the sign of the field vectors
beyond the cusp surface and the location of the current
sheets has to be determined by field line tracing. Since here we are
only interested in the unsigned open flux and its latitude distribution,
we have not carried out this procedure and thus always consider only the
absolute value of the extrapolated radial field strength.
2.3 Open flux and field strength near Earth
The total unsigned open flux provided by the extrapolations is
calculated by integrating the unsigned radial magnetic field
component over the source surface,
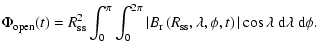 |
|
|
(4) |
In the case of the CSSS model, the open flux is already determined at the
cusp surface, so that one could as well carry out the integration over
that surface. We also define the mean flux density at the radial
distance of the Earth,
 AU, by
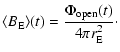 |
|
|
(5) |
If the model is consistent with the Ulysses result of a latitude-independent field,
 is equal to the longitudinally
averaged field near Earth (at
is equal to the longitudinally
averaged field near Earth (at
 and
and  ,
ignoring the
slight variation due to the b angle, i.e., the angle of about 7 degrees between the equatorial plane of the Sun and the ecliptic),
,
ignoring the
slight variation due to the b angle, i.e., the angle of about 7 degrees between the equatorial plane of the Sun and the ecliptic),
 |
|
|
(6) |
3 Results
In order to investigate the open flux and the latitude dependence of the
magnetic field beyond the source surface resulting from the extrapolation
models, the photospheric source field has to be provided as a boundary
condition. Here we consider observational data in the form of the
synoptic maps from the Wilcox Solar Observatory for the time period
1976-2005 as well as results from flux transport simulations based upon
the sunspot group areas from the USAF/NOAA Solar Optical Observing
Network (SOON) dataset.
For the location of the source surface, we have used the "standard''
value of
 in the case of the PFSS model, for which
value the positions of the coronal holes and the polarity pattern of the
interplanetary magnetic field apparently are well reproduced
(Hoeksema 1984). Assuming a uniform latitudinal distribution of
the open flux (which the PFSS model in fact does not yield, as we
shall see below), this choice gives a reasonable agreement with the
measurements of the near-Earth field (Wang & Sheeley 1995). For the CSSS model,
the total open flux is already determined at the location of the cusp
surface, for which we chose the value
in the case of the PFSS model, for which
value the positions of the coronal holes and the polarity pattern of the
interplanetary magnetic field apparently are well reproduced
(Hoeksema 1984). Assuming a uniform latitudinal distribution of
the open flux (which the PFSS model in fact does not yield, as we
shall see below), this choice gives a reasonable agreement with the
measurements of the near-Earth field (Wang & Sheeley 1995). For the CSSS model,
the total open flux is already determined at the location of the cusp
surface, for which we chose the value
 .
The resulting total open flux is then similar to that given
by the PFSS model. The location of the source surface in the CSSS model
then "freezes'' the latitude distribution of the open flux further
outward. We shall see that chosing a value of
(Zhao & Hoeksema 1995) leads to a latitude distribution that is
inconsistent with the Ulysses result, similar to the case of
the PFSS model. On the other hand, the physical justification for
introducing the source surface is the control of the radially streaming
solar wind over the magnetic field beyond the Alfvén radius,
.
The resulting total open flux is then similar to that given
by the PFSS model. The location of the source surface in the CSSS model
then "freezes'' the latitude distribution of the open flux further
outward. We shall see that chosing a value of
(Zhao & Hoeksema 1995) leads to a latitude distribution that is
inconsistent with the Ulysses result, similar to the case of
the PFSS model. On the other hand, the physical justification for
introducing the source surface is the control of the radially streaming
solar wind over the magnetic field beyond the Alfvén radius,  ,
where the kinetic energy density of the wind surpasses the magnetic
energy density. The best existing estimates put
in the range
,
where the kinetic energy density of the wind surpasses the magnetic
energy density. The best existing estimates put
in the range
 (Marsch & Richter 1984). We have therefore
considered also larger source surface radii in the case of the CSSS model.
(Marsch & Richter 1984). We have therefore
considered also larger source surface radii in the case of the CSSS model.
![\begin{figure}
\par\includegraphics[width=12cm,clip]{5871fig1.eps}\end{figure}](/articles/aa/full/2006/45/aa5871-06/Timg38.gif) |
Figure 1:
Latitude dependence of the longitudinally averaged source
surface field,
 ,
during times of
three solar activity minima (Carrington rotations 1643, 1781,
1909; left panels) and three maxima (Carrington rotations 1688,
1819, 1961; right panels), respectively, obtained on the basis of
the WSO photospheric field maps. Cases considered are the PFSS model
with
( a), b)), the CSSS model with
and
( c), d)), as well as the
CSSS model with
and ,
during times of
three solar activity minima (Carrington rotations 1643, 1781,
1909; left panels) and three maxima (Carrington rotations 1688,
1819, 1961; right panels), respectively, obtained on the basis of
the WSO photospheric field maps. Cases considered are the PFSS model
with
( a), b)), the CSSS model with
and
( c), d)), as well as the
CSSS model with
and
 ( e), f)). The Ulysses result of a latitude-independent field is only
reproduced by a CSSS model with a source surface located in the region
of the Alfvénic point, ( e), f)). The Ulysses result of a latitude-independent field is only
reproduced by a CSSS model with a source surface located in the region
of the Alfvénic point,
 . . |
| Open with DEXTER |
3.1 Extrapolation based on WSO synoptic maps
The spherical harmonic components of the synoptic photospheric field
maps from Wilcox Solar Observatory (WSO) are available
online![[*]](/icons/foot_motif.gif) up to order
l=9 for the Carrington rotations
1641-2035, covering the time period
between 1976 and 2005. We have used the coefficients obtained with the
so-called radial boundary condition and corrected the data for the FeI 5250 Å line saturation by applying the latitude-dependent factor
up to order
l=9 for the Carrington rotations
1641-2035, covering the time period
between 1976 and 2005. We have used the coefficients obtained with the
so-called radial boundary condition and corrected the data for the FeI 5250 Å line saturation by applying the latitude-dependent factor
 according to Ulrich (1992)
and Ulrich et al. (2002).
according to Ulrich (1992)
and Ulrich et al. (2002).
Latitudinal variation
Latitudinal profiles of the (unsigned) radial field at the source
surface resulting from extrapolations with the PFSS and the CSSS models
are shown in Fig. 1. For each model we have chosen
three Carrington rotations during solar maximum periods (CR 1688, 1819and 1961) and solar minimum periods
(CR 1643, 1781 and 1909), respectively.
During solar minima, the source surface field obtained from both models
with
(top and middle row of
Fig. 1) shows a very strong decrease between poles
and equator. During solar maxima, the latitudinal variations are less
systematic but still significant. These results are in clear
contradiction to the Ulysses measurements of a practically
latitude-independent field. However, by placing the source surface out
to
and beyond in the CSSS model, we obtain an almost
constant field, during maximum as well as minimum periods (bottom row of
Fig. 1). The near-equator current sheet in the CSSS model indicated by the finite value of  for all latitudes permits
the development of a "split monopole'' configuration
(Banaszkiewicz et al. 1998) if the source surface is located
sufficiently far from the solar surface. Such a configuration, which is
required to reproduce the Ulysses result, cannot be achieved by a PFSS extrapolation model.
for all latitudes permits
the development of a "split monopole'' configuration
(Banaszkiewicz et al. 1998) if the source surface is located
sufficiently far from the solar surface. Such a configuration, which is
required to reproduce the Ulysses result, cannot be achieved by a PFSS extrapolation model.
![\begin{figure}
\par\includegraphics[width=12cm,clip]{5871fig2.eps}\end{figure}](/articles/aa/full/2006/45/aa5871-06/Timg43.gif) |
Figure 2:
Mean radial flux density at 1 AU (
 ,
see Eq. (5), left
panels) and radial field near Earth ( ,
see Eq. (5), left
panels) and radial field near Earth (
 ,
see Eq. (6), right
panels) for the same extrapolations as in Fig. 1
(solid lines) in comparison with the measured radial IMF component (OMNI data, dotted lines). The extrapolations are based on the WSO synoptic
maps of the photospheric magnetic field. All data are 3-month
averages. The results for
(proportional to
the total open flux) fit the data reasonably well for PFSS as well as
CSSS extrapolations. However, only in the case of CSSS with
(panel f)) is the extrapolated near-ecliptic field consistent with the actual data. ,
see Eq. (6), right
panels) for the same extrapolations as in Fig. 1
(solid lines) in comparison with the measured radial IMF component (OMNI data, dotted lines). The extrapolations are based on the WSO synoptic
maps of the photospheric magnetic field. All data are 3-month
averages. The results for
(proportional to
the total open flux) fit the data reasonably well for PFSS as well as
CSSS extrapolations. However, only in the case of CSSS with
(panel f)) is the extrapolated near-ecliptic field consistent with the actual data. |
| Open with DEXTER |
Open flux and near-Earth field
Figure 2 shows the time evolution of the mean unsigned
radial flux density at 1 AU (proportional to the total open flux,
cf. Lockwood et al. 2004),
,
as defined in
Eq. (5) and the near-Earth field, .
These
quantities are given as 3-month averages in comparison with the measured
radial component of the near-Earth interplanetary magnetic field (dotted
lines) from GSFC/SPDF OMNI data.
The mean radial field
matches the
measurements reasonably well for both models, indicating that they
reproduce the temporal evolution of the total open magnetic
flux. However, the predicted field strength near the ecliptic, ,
is badly reproduced for the PFSS model as well as for the CSSS model if the source surface is placed at the "standard'' distance of
.
While we cannot change this value in the PFSS model
because then the total open flux would take wrong values, we have that
freedom in the CSSS model since here the open flux is already fixed by
the choice of the cusp surface at
.
Taking
,
which is supported by the physical arguments discussed at the
beginning of Sect. 3, leads to consistency of the
total open flux as well as the near-Earth field with the observed data.
Consequently, while the PFSS model also yields the correct result for
the total open flux, only the CSSS model reproduces the
latitude-independent radial field as observed with Ulysses.
3.2 Extrapolation based on flux transport simulations
Flux transport models describe the evolution of magnetic flux on the
solar surface, which emerges in form of bipolar magnetic regions. Such
models are used to follow the temporal evolution of the radial magnetic
field under the influence of turbulent diffusion (caused by
supergranulation) and of horizontal flows due to differential rotation
and meridional circulation
(e.g., Mackay et al. 2002b; DeVore et al. 1984; Baumann et al. 2006; van Ballegooijen et al. 1998; Baumann et al. 2004; Wang et al. 1989; Leighton 1964; Schrijver 2001).
We simulate the evolution of the radial surface field with the flux
transport code and the representation of emerging bipoles as described
in Baumann et al. (2004), including the decay term representing the effect
of radial diffusion with  km s-2(Baumann et al. 2006). We use a value of
 for the surface
diffusivity and the differential rotation profile derived by
Snodgrass (1983). For the meridional flow velocity we use a semi-empirical latitudinal profile adapted to helioseismic measurements (Gizon & Duvall 2004):
for the surface
diffusivity and the differential rotation profile derived by
Snodgrass (1983). For the meridional flow velocity we use a semi-empirical latitudinal profile adapted to helioseismic measurements (Gizon & Duvall 2004):
![\begin{displaymath}%
v(\lambda) =
1.6\;\sin~(2\lambda)\;\exp~[\pi(1-\vert\lambda\vert/90)]
\end{displaymath}](/articles/aa/full/2006/45/aa5871-06/img46.gif) |
(7) |
in units of m s-1. This profile and the helioseismic data are
shown in Fig. 3, together with the profiles
adopted in other studies.
We have derived the flux emergence data required as input for the model
from the sunspot group record provided by the USAF/NOOA Solar Optical
Observing Network
(SOON).
Sunspot areas (as well as sunspot numbers,
see Solanki et al. 2000,2002) represent a good proxy for
flux emergence because sunspots typically appear in the early phases of
active regions and most of them have a lifetime of only a few days. We
have used the SOON data (courtesy of D. Hathaway, NASA/MSFC) in order to
derive a sequence of emerging bipolar magnetic regions (BMRs) as input
for the flux transport simulation according to Baumann et al. (2004). The
basic assumptions are: (i) every observed sunspot group corresponds to
one BMR, and (ii) the magnetic flux content of a BMR is proportional to
its area (Schrijver & Harvey 1994). Since a sunspot group typically
appears more than once in the data, we consider a group only at the day
of its maximum area.
For the area of a BMR,
 ,
we write
,
we write
 ,
where
,
where  is the sunspot group area and
  is the corresponding facular area of the bipolar region given by the
relation
is the corresponding facular area of the bipolar region given by the
relation
 |
|
|
(8) |
in millionths of a solar hemisphere. This relationship has been derived
observationally by Chapman et al. (1997,2001).
The sunspot group data contain only information about the visible
hemisphere of the Sun. Consequently, the observations probably miss up
to  of the small sunspots. For larger sunspot groups, this
fraction is smaller because such groups emerging on the far side of the
Sun may live sufficiently long to rotate to the visible hemisphere and
thus become observable. The estimation of the correct number of missing
spot groups in the observation is a difficult task, since one has to
take into account visibility problems near the solar limb, different
decay stages of the spot groups, and the recurrence of sunspot groups
(see, e.g., Kopecký et al. 1985). For our aims, we restrict ourselves
to a rough estimation of the missing spot groups by assuming a sunspot
group observed at longitude
of the small sunspots. For larger sunspot groups, this
fraction is smaller because such groups emerging on the far side of the
Sun may live sufficiently long to rotate to the visible hemisphere and
thus become observable. The estimation of the correct number of missing
spot groups in the observation is a difficult task, since one has to
take into account visibility problems near the solar limb, different
decay stages of the spot groups, and the recurrence of sunspot groups
(see, e.g., Kopecký et al. 1985). For our aims, we restrict ourselves
to a rough estimation of the missing spot groups by assuming a sunspot
group observed at longitude  to emerge as well at longitude
 ,
with equal size and at the same latitude. This
procedure will somewhat overestimate the contribution of very large
sunspot groups. On the other hand, recurrent flux emergence (nests of
activity) within the same area could possibly be missed by our
procedure, which takes into account only the maximum area of a sunspot
group throughout its whole evolution.
,
with equal size and at the same latitude. This
procedure will somewhat overestimate the contribution of very large
sunspot groups. On the other hand, recurrent flux emergence (nests of
activity) within the same area could possibly be missed by our
procedure, which takes into account only the maximum area of a sunspot
group throughout its whole evolution.
Since the SOON data give no information about magnetic polarity, we
infer the polarities of the BMRs through Hale's rules
(Hale & Nicholson 1925) applied to each cycle.
The angular deviation from the East-West direction of the line joining
the centroids of the two polarities of a BMR (leading and following
parts of the sunspot groups), the tilt angle  ,
is crucial for
the evolution of the polar fields and the solar axial dipole
(e.g., Mackay et al. 2002a). Since no tilt angle information is
given in the SOON data, we assume a latitude dependence of the form
,
is crucial for
the evolution of the polar fields and the solar axial dipole
(e.g., Mackay et al. 2002a). Since no tilt angle information is
given in the SOON data, we assume a latitude dependence of the form
 .
The factor of proportionality, f, is left as a parameter to be fixed by comparison with the observed surface fluxes
(see below). A number of earlier studies with flux transport models have
used f=0.5 as proposed by Wang & Sheeley (1989) on the basis of
magnetograph data, but our results below suggest a considerably smaller value.
.
The factor of proportionality, f, is left as a parameter to be fixed by comparison with the observed surface fluxes
(see below). A number of earlier studies with flux transport models have
used f=0.5 as proposed by Wang & Sheeley (1989) on the basis of
magnetograph data, but our results below suggest a considerably smaller value.
![\begin{figure}
\par\includegraphics[angle=270,width=7.5cm,clip]{5871fig4.eps}\end{figure}](/articles/aa/full/2006/45/aa5871-06/Timg57.gif) |
Figure 4:
Longitude-averaged photospheric magnetic field, unsigned and
integrated over latitude, as a function of time (three-months
averages). Shown are the result from our flux transport simulations
(FTM, full line) with sources taken from the SOON sunspot area database
together with the observed data (dotted line) based upon the NSO/Kitt peak synoptic magnetograms (courtesy of D. Hathaway, NASA/MSFC). The
conversion factor between bipolar magnetic region area and input
magnetic flux for the flux transport simulations has been chosen such
that the two curves show a reasonable agreement. The calibrated curves
for different values of the proportionality factor, f, in the
latitudinal tilt angle profile,
,
are nearly identical
for  .
Shown here is the curve for f=0.15. .
Shown here is the curve for f=0.15. |
| Open with DEXTER |
In order to fix the value of f, we calculate the longitude-averaged
photospheric radial surface field, take its modulus and integrate over
latitude to obtain
 .
This quantity is very sensitive to the tilt angle of the BMRs. In fact,
for the small tilt angles relevant here, we have
.
This quantity is very sensitive to the tilt angle of the BMRs. In fact,
for the small tilt angles relevant here, we have
 .
Therefore, for a given value of f we can calibrate the (still
unspecified) conversion factor between BMR area,
,
and its
magnetic flux by comparing the simulated with the observed time
evolution of
.
Therefore, for a given value of f we can calibrate the (still
unspecified) conversion factor between BMR area,
,
and its
magnetic flux by comparing the simulated with the observed time
evolution of  .
This is shown in Fig. 4 for
the period 1976-2004 with observational data derived from NSO Kitt
Peak synoptic magnetgrams. The calibrated curves for different values of f are almost identical, but the conversion factors are inversely
proportional to f. The actual curve shown in Fig. 4
is for f=0.15.
.
This is shown in Fig. 4 for
the period 1976-2004 with observational data derived from NSO Kitt
Peak synoptic magnetgrams. The calibrated curves for different values of f are almost identical, but the conversion factors are inversely
proportional to f. The actual curve shown in Fig. 4
is for f=0.15.
![\begin{figure}
\par\includegraphics[width=7.75cm,clip]{5871fig5.eps}\end{figure}](/articles/aa/full/2006/45/aa5871-06/Timg61.gif) |
Figure 5:
Averaged unsigned photospheric field as a function of time.
The symbols represent data from Mt. Wilson Observatory and Wilcox Solar
Observatory, respectively (cf. Arge et al. 2002). The curves give
three-months averaged results from flux transport simulations for two values of the proportionality factor, f, in the latitudinal tilt angle
profile, calibrated by requiring consistency with the longitudinally
averaged flux density (see Fig. 4). While the curve
for f=0.5 (dashed line) shows a much too small average surface field,
the result for f=0.15 (solid line) is consistent with the data. |
| Open with DEXTER |
Having determined the linear relationship between the area-flux
conversion factor and f, we use the mean unsigned surface flux
density,
 to fix the correct value of f. This is shown in Fig. 5, which gives three-month
averages of the simulation results for f=0.15 (solid curve) and for
f=0.5 (dashed curve). The symbols show the corresponding observations
from the Mount Wilson Observatory and Wilcox Solar Observatory
magnetograph data (cf. Arge et al. 2002). It is obvious that the
case f=0.5 shows a much too small surface flux while the case f=0.15fits the data well, without requiring any further calibration.
Therefore, requiring the consistency of both,
and
to fix the correct value of f. This is shown in Fig. 5, which gives three-month
averages of the simulation results for f=0.15 (solid curve) and for
f=0.5 (dashed curve). The symbols show the corresponding observations
from the Mount Wilson Observatory and Wilcox Solar Observatory
magnetograph data (cf. Arge et al. 2002). It is obvious that the
case f=0.5 shows a much too small surface flux while the case f=0.15fits the data well, without requiring any further calibration.
Therefore, requiring the consistency of both,
and  ,
with the observational data uniquely fixes the tilt angle law to
,
with the observational data uniquely fixes the tilt angle law to
 .
This value is consistent with the analysis
of sunspot data (Sivaraman et al. 1999; Howard 1991) as well as with
results from numerical simulations of rising flux tubes
(e.g., Caligari et al. 1995).
.
This value is consistent with the analysis
of sunspot data (Sivaraman et al. 1999; Howard 1991) as well as with
results from numerical simulations of rising flux tubes
(e.g., Caligari et al. 1995).
![\begin{figure}
\par\hspace*{1.2cm}\includegraphics[width=15.25cm,clip]{5871fig6a...
...\vspace*{3mm}
\par\includegraphics[width=16.2cm,clip]{5871fig6c.eps}\end{figure}](/articles/aa/full/2006/45/aa5871-06/Timg65.gif) |
Figure 6:
Simulated and observed time-latitude plots (butterfly diagrams)
of the longitudinally averaged radial magnetic field at the solar
surface. Upper panel: result of the flux transport simulation
(running time averages of over 27 days) based upon SOON sunspot data
with a value of f=0.15 for the tilt angle slope. Lower panel:
evolution of the observed field from NSO Kitt Peak synoptic maps
(courtesy D. Hathaway). Simulation and observation are in qualitative
agreement, particularly concerning the poleward surges of
following-polarity magnetic flux leading to the reversals of the polar
fields. |
| Open with DEXTER |
Figure 6 gives time-latitude diagrams of the
azimuthally averaged radial surface field from the flux-transport model
(with f=0.15, calibrated as described above) and from observational
results. Both diagrams show a reasonable agreement, particularly
concerning the polar field reversals shortly after the activity maxima
and the poleward surges of following-polarity magnetic flux leading to
these reversals. Figure 7 shows the temporal
evolution of the field strength on both polar caps (poleward of 
 latitude), which is consistent with the observational
results presented by Dikpati et al. (2004).
latitude), which is consistent with the observational
results presented by Dikpati et al. (2004).
![\begin{figure}
\par\includegraphics[angle=270,width=7.5cm,clip]{5871fig7.eps}\end{figure}](/articles/aa/full/2006/45/aa5871-06/Timg67.gif) |
Figure 7:
Evolution of polar fields (average field strength poleward of
latitude) in the flux transport simulation.
South (North) polar fields are indicated by the thick (thin) line. The
field amplitudes and reversal times are consistent with the
observational results presented by Dikpati et al. (2004, cf. their
Fig. 3#. Owing to the calibration of the flux
transport model (see Fig. 4), the curves
for different values of the proportionality factor, f, in the
latitudinal tilt angle profile,
,
are nearly identical
as long as .
Shown here is the case f=0.15. |
| Open with DEXTER |
Latitudinal variation, open flux, and near-Earth field
The latitudinal profiles of the unsigned radial field at the source
surface based on extrapolations of the photospheric fields from the flux
transport simulations show the same characteristics as those for the WSO data given in Fig. 1: only the CSSS model with a source surface located at
(or beyond) reproduces a latitude-independent radial field in the heliosphere as observed with
the Ulysses probe. This is not surprising since the latitude
dependence of the heliospheric field is largely determined by the
extrapolation model and not by the detailed distribution of the
photospheric sources.
Figure 8 gives the time evolution between 1976 and
2004 of
,
the mean unsigned radial field at 1 AU, which
is proportional to the total open flux (Lockwood et al. 2004). Shown
are the CSSS extrapolations (with
and
 ,
solid lines) based upon the flux transport
simulations for f=0.15 (upper panel) and f=0.5 (lower panel),
respectively. Dashed lines give the measurements (OMNI data). It is
clear that the simulation with f=0.5 fails to reproduce the
measurements, while for f=0.15 the agreement is quite satisfactory,
apart from somewhat too low values during the rising phases of the
cycles. Note that no further calibration or adjustment has been made in
order to achieve this agreement.
,
solid lines) based upon the flux transport
simulations for f=0.15 (upper panel) and f=0.5 (lower panel),
respectively. Dashed lines give the measurements (OMNI data). It is
clear that the simulation with f=0.5 fails to reproduce the
measurements, while for f=0.15 the agreement is quite satisfactory,
apart from somewhat too low values during the rising phases of the
cycles. Note that no further calibration or adjustment has been made in
order to achieve this agreement.
4 Discussion and conclusions
We have addressed the latitude dependence of the
heliospheric field and the total open solar flux as resulting from
extrapolation models. The photospheric field distribution has been taken
either from observations (WSO data) or from flux transport simulations
with flux emergence determined from the SOON sunspot group database.
We have confirmed that the widely used potential field source surface
model (PFSS) cannot reproduce the latitude-independent radial field in
the heliosphere as found by Ulysses measurements. Other
researchers already have noted this fact
(e.g., Wang & Sheeley 1995,2002; Wang 1993) and suggested
that the heliospheric current could be responsible for transforming the
field configuration into the observed "split monopole'' configuration. We
have shown here, in the framework of the current sheet source surface
(CSSS) model of Zhao & Hoeksema (1995), that the effect of the current
sheet has to be combined with a source surface located in the region of
the Alfvénic surface beyond
in order to obtain a latitude-independent radial field. Such a location of the source surface
makes physical sense because the field can be expected to be drawn out
radially only when the kinetic energy density of the solar wind
dominates over the magnetic energy density.
With a latitude-independent radial field, the time series of field
measurements near Earth also represents the evolution of the open
flux. It turns out that the total open flux determined by a PFSS extrapolation on the basis of the WSO magnetograms of the photospheric
field can reproduce the measurements when it is assumed that the open
flux becomes distributed uniformly in latitude beyond the source surface
(Fig. 2a, see
also Wang & Sheeley 1995,2002). Consequently, the choice of the
source surface radius
in the PFSS seems seems to
capture the right amount of amount of open flux. We have shown here
that an extrapolation fully consistent with both, the time evolution of
the near-Earth radial field (also representing the open flux) as well as
the latitude independence of the heliospheric radial field, can be
obtained with the CSSS model incorporating the heliospheric current
sheet and a source surface in the vicinity of the Alfvénic surface
beyond
.
![\begin{figure}
\par\includegraphics[angle=270,width=7.4cm,clip]{5871fig8a.eps}\vspace*{3mm}
\includegraphics[angle=270,width=7.4cm,clip]{5871fig8b.eps}\end{figure}](/articles/aa/full/2006/45/aa5871-06/Timg69.gif) |
Figure 8:
Temporal evolution of the mean unsigned radial field at 1 AU:
comparison between measurements (dashed lines, OMNI data) and CSSS extrapolations (solid lines,
,
)
based on flux transport simulations with input from the SOON sunspot
group areas. The upper panel shows the case f=0.15 (tilt angle
profile as consistently determined by comparison with observed surface
fluxes, see Figs. 4 and 5). The
lower panel shows the case f=0.5. In this
case, the overall amplitude of the open flux is too low. In addition,
there is a phase shift between the curves, although they are not in
antiphase (see, e.g., Mackay et al. 2002b)
owing to the effect of the decay term in the flux transport equation
(Baumann et al. 2006). Clearly, the simulation with f=0.15 yields a reasonable representation of
the measurements. |
| Open with DEXTER |
The second topic of this paper is the question under which conditions
flux transport simulations can reproduce the observed characteristics of
the evolution of the total open flux during the solar
cycle. Mackay et al. (2002b) have noted that with standard
assumptions concerning diffusivity, meridional flow, tilt angle, and
latitude distribution of emerging flux (butterfly diagram) the open flux
is in antiphase with the activity cycle, i.e., it peaks during solar
activity minima, in contradiction to the measurements (see also
Fig. 2 in Wang et al. 2002). This result indicates a too strong
weighting of the axial dipole field (polar field) during solar minima
with respect to the contribution of the low-latitude fields (active
regions and their remnants, equatorial dipole) in the standard flux
transport simulations. In fact, Wang & Sheeley (2003a) and
Schrijver & DeRosa (2003) have shown on the basis of potential-field
models that the open flux around solar activity maximum is strongly
affected by low-latitude active region emergence.
Mackay & van Ballegooijen (2006) have confirmed and substantiated this
result with non-potential simulations of interacting bipoles.
Because the extrapolation models based on actual observations of the
photospheric field successfully reproduce the observed time evolution of
the total open flux, including its phase relation with activity cycle,
the problem probably does not arise from the extrapolation
models. Wang et al. (2002) have suggested a combination of increased
source strength (amplifying the low-latitude contribution) and a strong
meridional flow with a particular latitude profile, which reduces the
polar fields by suppressing the diffusion of magnetic flux across the
equator. They find that a PFSS extrapolation with this "revised model''
reproduces the observed evolution of the open flux in solar cycle 21. However, the assumed profile of the meridional flow is at variance
with the results from helioseismology (see curve "flow WS'' in
Fig. 3).
We have shown that the problem can be solved without modifying the
meridional flow profile. We have abandoned the commonly used value
f=0.5 of the proportionality factor in the latitude dependence of the
tilt angle,
(Wang & Sheeley 1989). Instead, we
have determined a consistent value of f by requiring that the
longitudinally averaged photospheric magnetic flux ()
and the
total surface flux ()
from the simulation simultaneously
agree with the observational data. Simulations of the photospheric flux
distributions carried out with the value of f=0.15 obtained in this
way lead to a reasonably good reproduction of the measured near-Earth
radial field (see Fig. 8, upper panel) when
extrapolated with a CSSS model with a cusp surface at
(determining the total amount of open flux) and a source surface at
,
providing a latitude-independent radial field in the heliosphere.
The flatter profile of the tilt angle law suggested by our simulations is
consistent with results from sunspot groups (Sivaraman et al. 1999; Howard 1991) as well as with tilt angles from numerical simulations
of rising magnetic flux tubes (e.g., Caligari et al. 1995). In
fact, sunspot groups are very well suited to observationally determine the
relevant tilt angles because they represent active regions in their
early phases during and after emergence. Later, the configuration of
active regions becomes distorted through flux transport on the surface
and does no longer necessarily reflect the tilt angle of the emerging
flux tube. This probably explains why the sunspot
results (e.g., Howard 1991) and our indirect determination
of the tilt angle profile differ from the results of
Wang & Sheeley (1989).
Our successful reproduction of the observed variation of the total open
flux with realistic assumptions about the flux transport processes
indicates that the evolution of the solar open flux is largely
determined by the instantaneous photospheric sources. Reconnection
processes in the corona (e.g., Fisk 2005) could possibly modify
the distribution of the open flux. Such "interchange reconnection''
has recently been demonstrated by Mackay & van Ballegooijen (2006)
through simulations of interacting, non-potential bipoles. However,
such processes do neither affect the total amount of open flux nor do
they change the "split-monopole'' configuration at larger distances from
the Sun, resulting from the heliospheric current sheet and the
dominating, radially streaming solar wind (for a comprehensive and
illustrative picture of the changing topology of the coronal field in
the course of the solar cycle see Wang & Sheeley 2003b).
Our model certainly leaves much room for improvement. For instance, the
treatment of flux emergence on the invisible hemisphere is rather crude
and could be improved (e.g., Kopecký et al. 1985). In the future,
far-side helioseismic information can help to cover the full solar
surface (e.g., Schrijver & DeRosa 2003). Our treatment probably
somewhat overestimate the contribution of very large sunspot groups,
which may have resulted in requiring a slightly flatter tilt angle
profile, i.e., somewhat smaller value of f, than actually present.
This would mainly affect the contribution of BMRs at higher latitudes
during the rising phase of the solar activity cycle and could possibly
explain the systematically too low values of the simulated open flux
during these phases. Furthermore, by the nature of the sunspot
group data, complexes of activity with recurrent flux emergence and
multiple bipoles may often appear in our source model only as a single large bipole. If the individual bipoles of such a complex show a large scatter of tilt angles, this would also reduce the effective tilt
angle associated with the complex of activity. It would certainly be
preferable to determine the tilt angles directly from sunspot
observations, but such data covering extended periods of time are not
available at present. Another unclear point is the temporal variation of
the meridional flow and a possible dependence on the activity cycle
(e.g., Gizon & Birch 2005; Gizon 2004), which could also affect the
long-term evolution of the open flux (Wang et al. 2002). At present,
however, the degree and character of such a variation is still rather
uncertain.
We have exclusively used photospheric observational data to calibrate
our flux transport model based upon sunspot area data and obtained a good representation of the observed open flux via a CSSS extrapolation. This opens the possibility to extend the model backward
in time: first, by using the combined RGO/SOON sunspot data reaching
back to 1874 and comparing with the open flux reconstructed from the
geomagnetic aa index since 1868 by Lockwood et al. (1999);
secondly, by using the sunspot number as a proxy for flux emergence
and thus extend the model back to the year 1700. These results will be
presented in a subsequent paper.
Acknowledgements
We are grateful to Y.-M. Wang and N. R. Sheely for
helpful dicussions, to L. Gizon for kindly providing the
helioseismic meridional flow data, and to C. N. Arge for making
available the corrected data for the total photospheric surface flux.
D. Schmitt provided helpful comments on a draft version of the
manuscript.
- Altschuler, M. D., &
Newkirk, G. 1969, Sol. Phys., 9, 131 [NASA ADS] [CrossRef] (In the text)
- Arge,
C. N., Hildner, E., Pizzo, V. J., & Harvey,
J. W. 2002, J. Geophys. Res. (Space Physics), 107
(In the text)
- Balogh, A.,
Smith, E. J., Tsurutani, B. T., et al. 1995,
Science, 268, 1007 [NASA ADS]
- Banaszkiewicz, M., Axford,
W. I., & McKenzie, J. F. 1998, A&A, 337, 940 [NASA ADS] (In the text)
- Baumann, I.,
Schmitt, D., Schüssler, M., & Solanki, S. K. 2004,
A&A, 426, 1075 [EDP Sciences] [NASA ADS] [CrossRef]
- Baumann, I.,
Schmitt, D., & Schüssler, M. 2006, A&A, 446, 307 [EDP Sciences] [NASA ADS] [CrossRef]
-
Caligari, P., Moreno-Insertis, F., & Schüssler, M. 1995,
ApJ, 441, 886 [NASA ADS] [CrossRef] (In the text)
- Chapman, G. A.,
Cookson, A. M., & Dobias, J. J. 1997, ApJ, 482,
541 [NASA ADS] [CrossRef]
- Chapman, G. A.,
Cookson, A. M., Dobias, J. J., & Walton, S. R.
2001, ApJ, 555, 462 [NASA ADS] [CrossRef]
- DeVore, C. R.,
Boris, J. P., & Sheeley, N. R. 1984, Sol. Phys.,
92, 1 [NASA ADS] [CrossRef]
-
Dikpati, M., de Toma, G., Gilman, P. A., Arge, C. N.,
& White, O. R. 2004, ApJ, 601, 1136 [NASA ADS] [CrossRef] (In the text)
- Fisk, L. A.
2005, ApJ, 626, 563 [NASA ADS] [CrossRef] (In the text)
- Gizon, L. 2004,
Sol. Phys., 224, 217 [NASA ADS] [CrossRef]
- Gizon, L.,
& Birch, A. C. 2005, Living Rev. Sol. Phys., 2, 6 [NASA ADS]
-
Gizon, L., & Duvall, T. L. 2004, in Multi-Wavelength
Investigations of Solar Activity, ed. A. V. Stepanov,
E. E. Benevolenskaya, & A. G. Kosovichev (Cambridge
University Press), IAU Symp., 223, 41
(In the text)
- Hale,
G. E., & Nicholson, S. B. 1925, ApJ, 62, 270 [NASA ADS] [CrossRef] (In the text)
- Hoeksema,
J. T. 1984, Ph.D. Thesis, Stanford University
(In the text)
- Howard,
R. F. 1991, Sol. Phys., 136, 251 [NASA ADS] [CrossRef]
- Kopecký,
M., Kuklin, G. V., & Starkova, I. P. 1985, Bull.
Astron. Inst. Czech., 36, 189 [NASA ADS] (In the text)
- Leighton,
R. B. 1964, ApJ, 140, 1547 [NASA ADS] [CrossRef]
-
Lockwood, M., Stamper, R., & Wild, M. N. 1999, Nature,
399, 437 [NASA ADS] [CrossRef] (In the text)
-
Lockwood, M., Forsyth, R., Balogh, A., & McComas, D. 2004,
Annales Geophys., 22, 1395 [NASA ADS] (In the text)
- Mackay, D. H., & van
Ballegooijen, A. A. 2006, ApJ, 642, 1193 [NASA ADS] [CrossRef] (In the text)
-
Mackay, D. H., Priest, E. R., & Lockwood, M. 2002a,
Sol. Phys., 207, 291 [NASA ADS] [CrossRef] (In the text)
-
Mackay, D. H., Priest, E. R., & Lockwood, M. 2002b,
Sol. Phys., 209, 287 [NASA ADS] [CrossRef] (In the text)
- Marsch, E., & Richter,
A. K. 1984, J. Geophys. Res., 89, 5386 [NASA ADS] (In the text)
- Schatten,
K. H. 1972, in Solar Wind, ed. C. P. Sonett,
P. J. Coleman, & J. M. Wilcox (Washington, D.C.: NASA
SP-308), 44
(In the text)
- Schatten,
K. H., Wilcox, J. M., & Ness, N. F. 1969,
Sol. Phys., 6, 442 [NASA ADS] [CrossRef] (In the text)
- Schrijver,
C. J. 2001, ApJ, 547, 475 [NASA ADS] [CrossRef]
- Schrijver, C. J., &
DeRosa, M. L. 2003, Sol. Phys., 212, 165 [NASA ADS] [CrossRef] (In the text)
- Schrijver, C. J., &
Harvey, K. L. 1994, Sol. Phys., 150, 1 [NASA ADS] [CrossRef] (In the text)
- Sivaraman, K. R., Gupta,
S. S., & Howard, R. F. 1999, Sol. Phys., 189,
69 [NASA ADS] [CrossRef]
- Smith,
E. J., & Balogh, A. 1995, Geophys. Res. Lett.,
22, 3317 [NASA ADS] [CrossRef]
-
Smith, E. J., & Balogh, A. 2003, in Solar Wind Ten,
ed. M. Velli, R. Bruno, & F. Malara (American Institute of
Physics), AIP Conf. Proc., 679, 67
- Smith,
E. J., Marsden, R. G., Balogh, A., et al. 2003,
Science, 302, 1165 [NASA ADS] [CrossRef]
- Snodgrass,
H. B. 1983, ApJ, 270, 288 [NASA ADS] [CrossRef] (In the text)
-
Solanki, S. K., Schüssler, M., & Fligge, M. 2000,
Nature, 408, 445 [NASA ADS] [CrossRef]
-
Solanki, S. K., Schüssler, M., & Fligge, M. 2002,
A&A, 383, 706 [EDP Sciences] [NASA ADS] [CrossRef]
- Ulrich,
R. K. 1992, in Cool Stars, Stellar Systems, and the Sun,
ed. J. Bookbinder, & M. Giampapa (San Francisco,
California: ASP), ASP Conf. Ser., 26, 265
(In the text)
- Ulrich,
R. K., Evans, S., Boyden, J. E., & Webster, L. 2002,
ApJS, 139, 259 [NASA ADS] [CrossRef] (In the text)
- van Ballegooijen,
A. A., Cartledge, N. P., & Priest, E. R. 1998,
ApJ, 501, 866 [NASA ADS] [CrossRef]
- Wang,
Y.-M. 1993, J. Geophys. Res., 98, 3529 [NASA ADS]
-
Wang, Y.-M., & Sheeley, N. R. 1989, Sol. Phys., 124,
81 [NASA ADS] [CrossRef] (In the text)
- Wang, Y.-M., &
Sheeley, N. R. 1992, ApJ, 392, 310 [NASA ADS] [CrossRef] (In the text)
- Wang, Y.-M., &
Sheeley, N. R. 1995, ApJ, 447, L143 [NASA ADS]
-
Wang, Y.-M., & Sheeley, N. R. 2002,
J. Geophys. Res., 107, 10
-
Wang, Y.-M., & Sheeley, N. R. 2003a, ApJ, 590, 1111 [NASA ADS] [CrossRef] (In the text)
-
Wang, Y.-M., & Sheeley, N. R. 2003b, ApJ, 599, 1404 [NASA ADS] [CrossRef] (In the text)
- Wang,
Y.-M., Nash, A. G., & Sheeley, N. R. 1989, Science,
245, 712 [NASA ADS]
- Wang,
Y.-M., Sheeley, Jr., N. R., & Lean, J. 2002, ApJ, 580,
1188 [NASA ADS] [CrossRef]
- Wang,
Y.-M., Lean, J. L., & Sheeley, N. R. 2005, ApJ, 625,
522 [NASA ADS] [CrossRef] (In the text)
- Wolfson, R.
1985, ApJ, 288, 769 [NASA ADS] [CrossRef] (In the text)
-
Zhao, X., & Hoeksema, J. T. 1994, Sol. Phys., 151,
91 [NASA ADS] [CrossRef] (In the text)
-
Zhao, X., & Hoeksema, J. T. 1995,
J. Geophys. Res., 100, 19 [NASA ADS] [CrossRef] (In the text)
Copyright ESO 2006
![\begin{figure}
\par\includegraphics[width=12cm,clip]{5871fig1.eps}\end{figure}](/articles/aa/full/2006/45/aa5871-06/img38.gif)
![\begin{figure}
\par\includegraphics[width=12cm,clip]{5871fig2.eps}\end{figure}](/articles/aa/full/2006/45/aa5871-06/img43.gif)
![\begin{figure}
\par\includegraphics[angle=270,width=7.65cm,clip]{5871fig3.eps}\end{figure}](/articles/aa/full/2006/45/aa5871-06/img55.gif)
![\begin{figure}
\par\includegraphics[angle=270,width=7.5cm,clip]{5871fig4.eps}\end{figure}](/articles/aa/full/2006/45/aa5871-06/img57.gif)
![\begin{figure}
\par\includegraphics[width=7.75cm,clip]{5871fig5.eps}\end{figure}](/articles/aa/full/2006/45/aa5871-06/img61.gif)
![\begin{figure}
\par\hspace*{1.2cm}\includegraphics[width=15.25cm,clip]{5871fig6a...
...\vspace*{3mm}
\par\includegraphics[width=16.2cm,clip]{5871fig6c.eps}\end{figure}](/articles/aa/full/2006/45/aa5871-06/img65.gif)
![\begin{figure}
\par\includegraphics[angle=270,width=7.5cm,clip]{5871fig7.eps}\end{figure}](/articles/aa/full/2006/45/aa5871-06/img67.gif)
![\begin{figure}
\par\includegraphics[angle=270,width=7.4cm,clip]{5871fig8a.eps}\vspace*{3mm}
\includegraphics[angle=270,width=7.4cm,clip]{5871fig8b.eps}\end{figure}](/articles/aa/full/2006/45/aa5871-06/img69.gif)