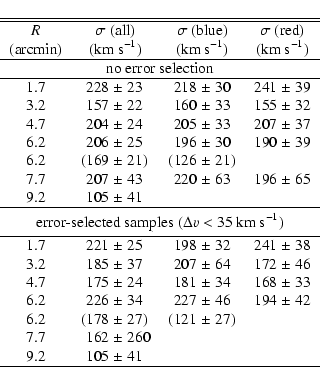
Table 4:
Projected velocity dispersion as a function of projected
galactocentric radius. The upper section shows the values for all, the
blue, and the red clusters. The dispersions for the corresponding
error-selected samples are listed in the lower section. The data are
shown in Fig. 11. The values in brackets are those obtained
when omitting the two (blue) GCs with velocities above
 .
.
|
Source LaTeX |
All tables |
In the text

