A&A 459, 71-84 (2006)
DOI: 10.1051/0004-6361:20065622
Y. I. Izotov1 - D. Schaerer2,3 - A. Blecha2 - F. Royer4 - N. G. Guseva1 - P. North5
1 - Main Astronomical Observatory,
Ukrainian National Academy of Sciences,
Zabolotnoho 27, Kyiv 03680, Ukraine
2 -
Observatoire de Genève,
51 Ch. des Maillettes,
1290 Sauverny, Switzerland
3 -
Laboratoire d'Astrophysique Toulouse-Tarbes, UMR 5572, 14 Av. E. Belin,
31400 Toulouse, France
4 -
GEPI, CNRS UMR 8111, Observatoire de Paris, 5 place Janssen, 92195 Meudon Cedex, France
5 -
Laboratoire d'Astrophysique, École Polytechnique Fédérale de Lausanne (EPFL),
Observatoire, 1290 Sauverny, Switzerland
Received 17 May 2006 / Accepted 24 July 2006
Abstract
Aims. We present two-dimensional spectroscopy of the extremely metal-deficient blue compact dwarf (BCD) galaxy SBS 0335-052E to study physical conditions, element abundances and kinematical properties of the ionised gas in this galaxy.
Methods. Observations were obtained in the spectral range ![]() 3620-9400 Å with the imaging spectrograph GIRAFFE on the UT2 of the Very Large Telescope (VLT). These observations are the first ones carried out so far with GIRAFFE in the ARGUS mode which allows one to simultaneously obtain 308 spectra covering a 11
3620-9400 Å with the imaging spectrograph GIRAFFE on the UT2 of the Very Large Telescope (VLT). These observations are the first ones carried out so far with GIRAFFE in the ARGUS mode which allows one to simultaneously obtain 308 spectra covering a 11
![]() 4
4![]() 7
7
![]() 3 region.
3 region.
Results. We produced images of SBS 0335-052E in the continuum and in emission lines of different stages of excitation. While the maximum of emission in the majority of lines, including the strong lines H![]() 4861 Å, H
4861 Å, H![]() 6563 Å, [O III] 4363,5007 Å, [O II] 3726,3729 Å, coincides with the youngest south-eastern star clusters 1 and 2, the emission of He II 4686 Å line is offset to the more evolved north-west clusters 4, 5. This suggests that hard ionising radiation responsible for the He II
6563 Å, [O III] 4363,5007 Å, [O II] 3726,3729 Å, coincides with the youngest south-eastern star clusters 1 and 2, the emission of He II 4686 Å line is offset to the more evolved north-west clusters 4, 5. This suggests that hard ionising radiation responsible for the He II ![]() 4686 Å emission is not related to the most massive youngest stars, but rather is related to fast radiative shocks. This conclusion is supported by the kinematical properties of the ionised gas from the different emission lines as the velocity dispersion in the He II
4686 Å emission is not related to the most massive youngest stars, but rather is related to fast radiative shocks. This conclusion is supported by the kinematical properties of the ionised gas from the different emission lines as the velocity dispersion in the He II ![]() 4686 Å line is systematically higher, by
4686 Å line is systematically higher, by ![]() 50-100%, than that in other lines. The variations of the emission line profiles suggest the presence of an ionised gas outflow in the direction perpendicular to the galaxy disk. We find a relatively high electron number density
50-100%, than that in other lines. The variations of the emission line profiles suggest the presence of an ionised gas outflow in the direction perpendicular to the galaxy disk. We find a relatively high electron number density ![]() of several hundred cm-3 in the brightest part of SBS 0335-052E. There is a small gradient of the electron temperature
of several hundred cm-3 in the brightest part of SBS 0335-052E. There is a small gradient of the electron temperature ![]() and oxygen abundance from the East to the West with systematically higher
and oxygen abundance from the East to the West with systematically higher ![]() and lower 12+log O/H in the western part of the galaxy. The oxygen abundances for the whole H II region and its brightest part are 12 + log O/H =
and lower 12+log O/H in the western part of the galaxy. The oxygen abundances for the whole H II region and its brightest part are 12 + log O/H =
![]() and
and
![]() ,
respectively. We derive the He mass fraction taking into account all systematic effects. The He mass fraction
,
respectively. We derive the He mass fraction taking into account all systematic effects. The He mass fraction
![]() ,
derived from the emission of the whole H II region, is consistent with the primordial value predicted by the standard Big Bang nucleosynthesis model. We confirm the presence of Wolf-Rayet stars in cluster 3.
,
derived from the emission of the whole H II region, is consistent with the primordial value predicted by the standard Big Bang nucleosynthesis model. We confirm the presence of Wolf-Rayet stars in cluster 3.
Key words: galaxies: fundamental parameters - galaxies: starburst - galaxies: ISM - galaxies: abundances - galaxies: indvidual: SBS 0335-052E
The blue compact dwarf (BCD) galaxy SBS 0335-052E is an excellent nearby
laboratory for studying star formation in low-metallicity environments.
Since its discovery as one of the
most metal-deficient star-forming galaxies known (Izotov et al. 1990),
with oxygen abundance 12 + log O/H ![]() 7.30 (Thuan & Izotov 2005; Melnick et al. 1992; Izotov et al. 1997b,1999),
SBS 0335-052E has often been proposed as a nearby young dwarf
galaxy (Papaderos et al. 1998; Izotov et al. 1997b; Thuan et al. 1997; Izotov et al. 1990; Pustilnik et al. 2004). Thuan et al. (1997) and Papaderos et al. (1998), using the
same Hubble Space Telescope (HST) images, have found several luminous clusters.
The brightest clusters are labelled in Fig. 1
which represents the highest spatial resolution archival UV HST/Advanced
Camera for Surveys (ACS) image of SBS 0335-052E obtained by Kunth et al. (2003).
Some of the clusters are very young and produce extended regions of ionised gas
(Melnick et al. 1992; Papaderos et al. 1998; Izotov et al. 1997b; Pustilnik et al. 2004). In particular, Izotov et al. (2001b), using deep long-slit
spectra of SBS 0335-052E,
have shown that extended H
7.30 (Thuan & Izotov 2005; Melnick et al. 1992; Izotov et al. 1997b,1999),
SBS 0335-052E has often been proposed as a nearby young dwarf
galaxy (Papaderos et al. 1998; Izotov et al. 1997b; Thuan et al. 1997; Izotov et al. 1990; Pustilnik et al. 2004). Thuan et al. (1997) and Papaderos et al. (1998), using the
same Hubble Space Telescope (HST) images, have found several luminous clusters.
The brightest clusters are labelled in Fig. 1
which represents the highest spatial resolution archival UV HST/Advanced
Camera for Surveys (ACS) image of SBS 0335-052E obtained by Kunth et al. (2003).
Some of the clusters are very young and produce extended regions of ionised gas
(Melnick et al. 1992; Papaderos et al. 1998; Izotov et al. 1997b; Pustilnik et al. 2004). In particular, Izotov et al. (2001b), using deep long-slit
spectra of SBS 0335-052E,
have shown that extended H![]() emission is detected over
emission is detected over
![]() 6-8 kpc, suggesting that hot ionised gas is spread out far away from
the central part of the galaxy.
6-8 kpc, suggesting that hot ionised gas is spread out far away from
the central part of the galaxy.
Thuan & Izotov (1997) using HST/GHRS UV spectrum of SBS 0335-052E have discovered
a very broad Ly![]() line in absorption suggesting that this galaxy is
embedded in a large envelope of neutral gas. The column density of
N(H I) =
line in absorption suggesting that this galaxy is
embedded in a large envelope of neutral gas. The column density of
N(H I) =
![]() cm-2 in SBS 0335-052E
derived by Thuan & Izotov (1997) is the largest one known for the BCDs. Later,
Pustilnik et al. (2001) using Very Large Array (VLA) observations in the line H I
cm-2 in SBS 0335-052E
derived by Thuan & Izotov (1997) is the largest one known for the BCDs. Later,
Pustilnik et al. (2001) using Very Large Array (VLA) observations in the line H I
![]() 21 cm have detected a large neutral gas cloud around SBS 0335-052E
with a size 66 by 22 kpc elongated in the east-west direction
and with two maxima separated by 22 kpc. The first
maximum in H I distribution is connected to SBS 0335-052E, and the
second one to the companion dwarf galaxy SBS 0335-052W discovered
by Pustilnik et al. (1997). The latter galaxy is shown by Izotov et al. (2005) to be
the lowest metallicity emission-line galaxy known with
12 + log O/H =
21 cm have detected a large neutral gas cloud around SBS 0335-052E
with a size 66 by 22 kpc elongated in the east-west direction
and with two maxima separated by 22 kpc. The first
maximum in H I distribution is connected to SBS 0335-052E, and the
second one to the companion dwarf galaxy SBS 0335-052W discovered
by Pustilnik et al. (1997). The latter galaxy is shown by Izotov et al. (2005) to be
the lowest metallicity emission-line galaxy known with
12 + log O/H =
![]() .
Thuan et al. (2005) using Far Ultraviolet Spectroscopic
Explorer (FUSE) observations have found that the oxygen abundance of the
neutral gas around SBS 0335-052E of 12 + log O/H
.
Thuan et al. (2005) using Far Ultraviolet Spectroscopic
Explorer (FUSE) observations have found that the oxygen abundance of the
neutral gas around SBS 0335-052E of 12 + log O/H ![]() 7.0 is only slightly
lower than that of the ionised gas, implying that this galaxy was not formed
from pristine gas.
7.0 is only slightly
lower than that of the ionised gas, implying that this galaxy was not formed
from pristine gas.
Despite the low metallicity of SBS 0335-052E, an appreciable amount of dust
has been detected in it. Izotov et al. (1997b) and Thuan et al. (1997) have found variations
of extinction in this galaxy from the optical spectroscopic and photometric
observations. Later, Thuan et al. (1999) and Houck et al. (2004) using
Infrared Space Observatory (ISO) and Spitzer
mid-infrared observations have found an emission of an appreciable amount of
warm dust with a characteristic temperature of ![]() 100 K. Even hotter
dust with a temperature of several hundred degrees is expected to be present
in SBS 0335-052E which is indicated in the infrared spectra at shorter
wavelengths, namely 2-4
100 K. Even hotter
dust with a temperature of several hundred degrees is expected to be present
in SBS 0335-052E which is indicated in the infrared spectra at shorter
wavelengths, namely 2-4 ![]() m (Vanzi et al. 2000; Hunt et al. 2001).
m (Vanzi et al. 2000; Hunt et al. 2001).
Since the discovery paper by Izotov et al. (1990) it has been known that the ionising
radiation in SBS 0335-052E is hard. The presence of the high-ionisation
He II ![]() 4686 Å emission line (e.g. Melnick et al. 1992; Izotov et al. 1997b,1990)
and of the [Fe V]
4686 Å emission line (e.g. Melnick et al. 1992; Izotov et al. 1997b,1990)
and of the [Fe V] ![]() 4227 Å emission line (Izotov et al. 2001b; Fricke et al. 2001) suggests
that radiation with photon energies greater than 4 Rydberg is intense and
could not be explained by stellar emission. Furthermore, Izotov et al. (2001b)
and Thuan & Izotov (2005)
have found [Fe VII] and [Ne V] emission lines which require
intense radiation with photon energies above 7 Rydberg. SBS 0335-052E has
also been detected in the X-ray range (Thuan et al. 2004). The origin of the hard
ionising radiation remains unclear. Several mechanisms such as radiation
from most massive main-sequence stars, Wolf-Rayet stars, high-mass X-ray
binaries and radiative shocks have been discussed
by e.g. Garnett et al. (1991), Schaerer (1996), Izotov et al. (2001b), Izotov et al. (2004) and Thuan & Izotov (2005).
The most recent investigations have shown
that although the stellar origin
of hard radiation is not completely excluded, the most likely source of hard
radiation is fast radiative shocks.
4227 Å emission line (Izotov et al. 2001b; Fricke et al. 2001) suggests
that radiation with photon energies greater than 4 Rydberg is intense and
could not be explained by stellar emission. Furthermore, Izotov et al. (2001b)
and Thuan & Izotov (2005)
have found [Fe VII] and [Ne V] emission lines which require
intense radiation with photon energies above 7 Rydberg. SBS 0335-052E has
also been detected in the X-ray range (Thuan et al. 2004). The origin of the hard
ionising radiation remains unclear. Several mechanisms such as radiation
from most massive main-sequence stars, Wolf-Rayet stars, high-mass X-ray
binaries and radiative shocks have been discussed
by e.g. Garnett et al. (1991), Schaerer (1996), Izotov et al. (2001b), Izotov et al. (2004) and Thuan & Izotov (2005).
The most recent investigations have shown
that although the stellar origin
of hard radiation is not completely excluded, the most likely source of hard
radiation is fast radiative shocks.
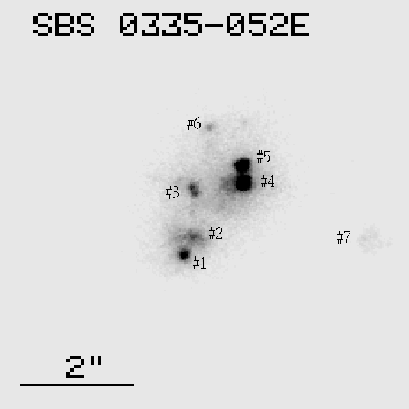 |
Figure 1: Archival HST/ACS UV image of SBS 0335-052E with thelabelled compact clusters. North is up and East is to the left. |
| Open with DEXTER | |
Table 1: Journal of observations.
Despite the efforts of different groups in studying the properties of
SBS 0335-052E and its evolutionary status many problems remain unsolved.
Since this galaxy is possibly a young galaxy it could be considered as a local
counterpart of the high-redshift young dwarf galaxies.
Therefore the continuation of
its studies is important for cosmological applications.
In this paper we present a two-dimensional
spectroscopic study of SBS 0335-052E with the VLT/GIRAFFE. These are
the first observations carried out so far in the ARGUS mode.
Two new features
are characteristic of these new observations, which were not present in
previous spectroscopic studies of this galaxy. First, new observations allow us
to map the whole galaxy in different emission lines and in the continuum. This gives
integrated characteristics of different emission lines for the whole H II
region, such as the line luminosities, which are necessary input parameters
to build up the model of the H II region. Second,
the spectral resolution of new observations is by one order of magnitude
better than in all previous spectroscopic observations of SBS 0335-052E
and it is enough to obtain the intrinsic profiles of emission lines.
This allows us to study the kinematics of the H II region, and to make a
comparison of kinematic characteristics in regions of different ionisation
stages. In particular, it is important to compare the
He II ![]() 4686 Å
line profiles with the profiles of other emission lines and, hence, to draw
conclusions concerning the origin of hard radiation in SBS 0335-052E.
4686 Å
line profiles with the profiles of other emission lines and, hence, to draw
conclusions concerning the origin of hard radiation in SBS 0335-052E.
In Sect. 2 we describe the observations and data reduction. Morphology of SBS 0335-052E in different emission lines and continuum is considered in Sect. 3. Kinematic properties are discussed in Sect. 4. Heavy element abundances and helium abundance are derived in Sect. 5. The Wolf-Rayet stellar population in SBS 0335-052E is discussed in Sect. 6. Our conclusions are summarised in Sect. 7.
Observations of SBS 0335-052E with the VLT/GIRAFFE spectrograph were
performed during the nights 19-22 November, 2003 in the entire visible range.
GIRAFFE is equipped with a 2K![]() 4K EEV CCD. The size of the CCD pixels is
4K EEV CCD. The size of the CCD pixels is
![]()
![]() m. The spatial scale is
0
m. The spatial scale is
0
![]() 52/pixel in the ARGUS direct mode used during our observations.
The ARGUS array is a rectangular array of 22 by 14 microlenses which is fixed
at the center of one positioner arm. We used a spatial scale with a sampling
of 0
52/pixel in the ARGUS direct mode used during our observations.
The ARGUS array is a rectangular array of 22 by 14 microlenses which is fixed
at the center of one positioner arm. We used a spatial scale with a sampling
of 0
![]() 52 per microlens and a total aperture of
52 per microlens and a total aperture of
![]() .
The major axis of the array was directed along the major axis of SBS 0335-052E
at a position angle PA = -30
.
The major axis of the array was directed along the major axis of SBS 0335-052E
at a position angle PA = -30![]() and centered on the cluster 1
(Fig. 1). The low-resolution mode with the 600 lines/mm grating
was used. Since the wavelength coverage with this grating
ranges from 400 Å to 1200 Å depending on the central wavelength, eight
exposures were done with
setups LR1 - LR8 (Table 1) to obtain panoramic spectra in the
wavelength range
and centered on the cluster 1
(Fig. 1). The low-resolution mode with the 600 lines/mm grating
was used. Since the wavelength coverage with this grating
ranges from 400 Å to 1200 Å depending on the central wavelength, eight
exposures were done with
setups LR1 - LR8 (Table 1) to obtain panoramic spectra in the
wavelength range ![]() 3620-9400 Å and a spectral resolution of
0.5-1 Å. Each exposure was split in two subexposures for the removal
of cosmic ray hits. The journal of observations is shown in Table 1.
Additionally, for the same setups the spectra of two standard stars, Feige 110
and HD 49798, were obtained for flux calibration. During the days the
exposures of bias, Nasmyth screen flats and comparison lamps for the wavelength
calibration have been obtained. The description of GIRAFFE may be found
in Pasquini et al. (2002).
3620-9400 Å and a spectral resolution of
0.5-1 Å. Each exposure was split in two subexposures for the removal
of cosmic ray hits. The journal of observations is shown in Table 1.
Additionally, for the same setups the spectra of two standard stars, Feige 110
and HD 49798, were obtained for flux calibration. During the days the
exposures of bias, Nasmyth screen flats and comparison lamps for the wavelength
calibration have been obtained. The description of GIRAFFE may be found
in Pasquini et al. (2002).
The spectra were extracted and calibrated using the standard Python version of BLDRS - Baseline Data Reduction Software (girbldrs-1.12) available from http://girbldrs.sourceforge.net. Basic description of BLDRS is given in Blecha et al. (2000) and Royer et al. (2002). The processing includes the bias subtraction, correction for the pixel sensitivity variations, localisation, optimal extraction, rebinning to linear wavelength scale and night sky subtraction.
The flux calibration was done using IRAF![]() .
The flux-calibrated and redshift-corrected spectrum of the
brightest rectangular region
delineated by the thick solid line in the center of Fig. 7a is shown
in Fig. 2. The region includes clusters 1 and 2. Many
strong permitted and forbidden emission lines are seen in
the spectrum of this region. One
important feature of this spectrum is that its spectral resolution is the
highest among all other spectra of SBS 0335-052E obtained so far. In
particular, several blends are resolved for the first time for this object,
most notably, [O II]
.
The flux-calibrated and redshift-corrected spectrum of the
brightest rectangular region
delineated by the thick solid line in the center of Fig. 7a is shown
in Fig. 2. The region includes clusters 1 and 2. Many
strong permitted and forbidden emission lines are seen in
the spectrum of this region. One
important feature of this spectrum is that its spectral resolution is the
highest among all other spectra of SBS 0335-052E obtained so far. In
particular, several blends are resolved for the first time for this object,
most notably, [O II] ![]() 3726 and [O II]
3726 and [O II] ![]() 3729,
He I
3729,
He I ![]() 3965, [Ne III]
3965, [Ne III] ![]() 3967 and H7
3967 and H7 ![]() 3970,
[Ar IV]
3970,
[Ar IV] ![]() 4711 and He I
4711 and He I ![]() 4713. The spectrum
contains emission lines of ions of a broad range of ionisation stages. In
particular, [Fe II], [Fe III], [Fe IV],
[Fe V], [Fe VI] and [Fe VII] emission lines are detected.
4713. The spectrum
contains emission lines of ions of a broad range of ionisation stages. In
particular, [Fe II], [Fe III], [Fe IV],
[Fe V], [Fe VI] and [Fe VII] emission lines are detected.
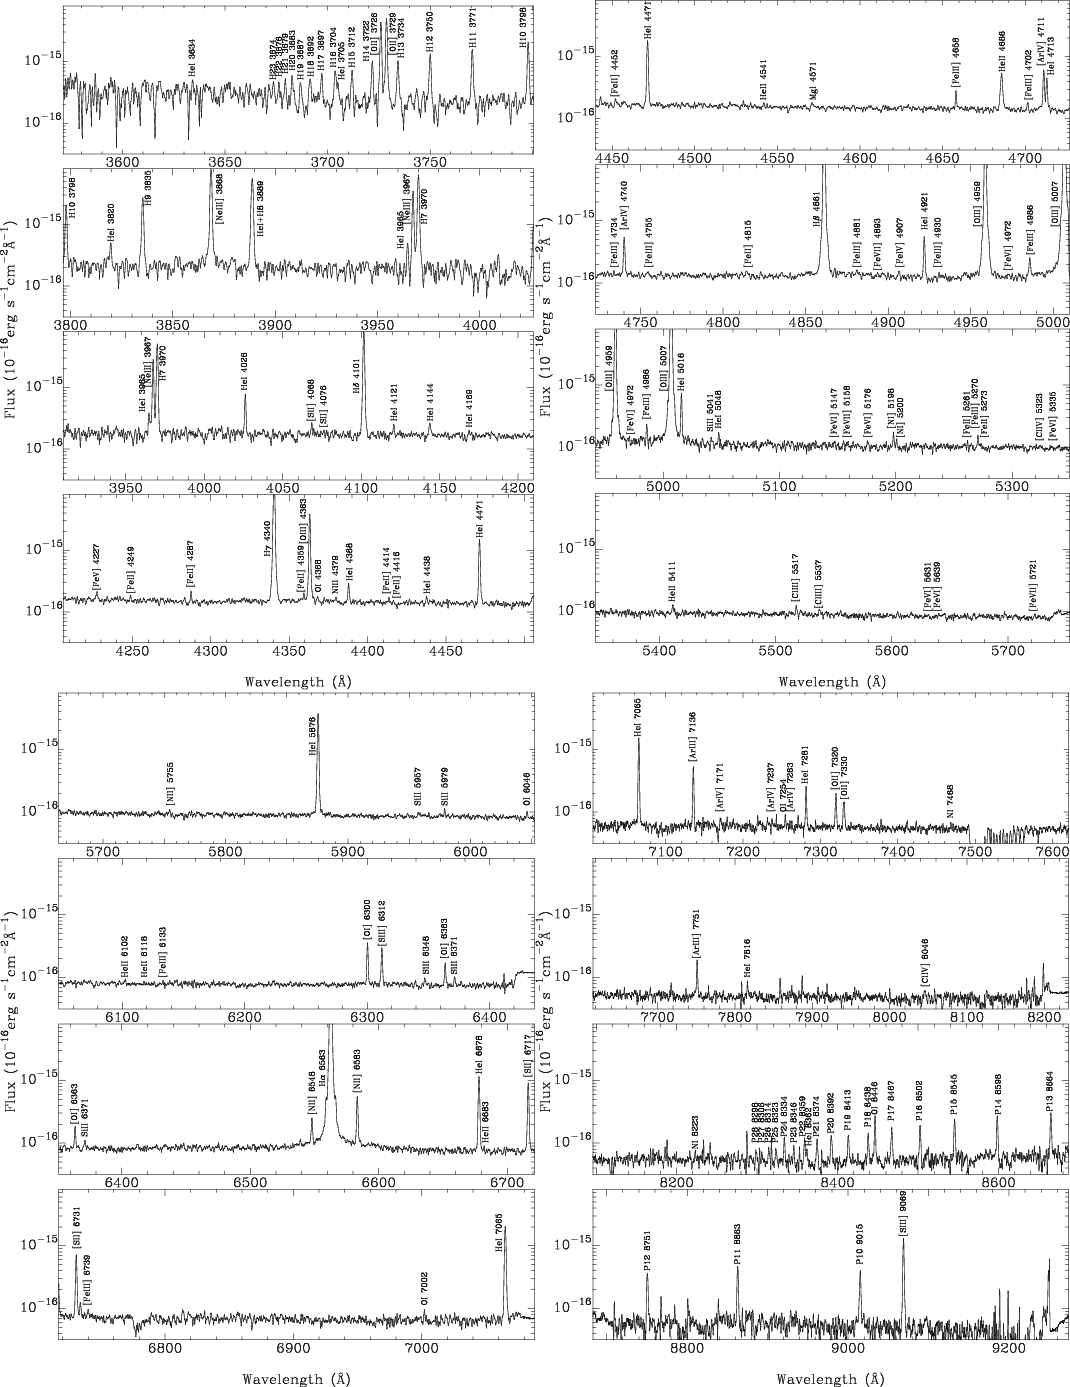 |
Figure 2: Spectrum of the brightest part of SBS 0335-052E shown in Fig. 7a as a rectangular region delineated by the thick solid line. |
| Open with DEXTER | |
The spectrum of another region centered on the clusters 4 and 5 and delineated by the thick dashed line in Fig. 7a is shown in Fig. 3. The level of continuum in this spectrum is comparable to that in the spectrum of the brightest region (Fig. 2), but emission lines are weaker.
The emission line fluxes and widths were measured in each of the
22![]() 14 lens array using the routine SPLOT in
IRAF. Flux errors were derived from the photon statistics using
non-flux-calibrated spectra. These errors were propagated in the determination
of the electron temperatures, electron number densities and element
abundances.
14 lens array using the routine SPLOT in
IRAF. Flux errors were derived from the photon statistics using
non-flux-calibrated spectra. These errors were propagated in the determination
of the electron temperatures, electron number densities and element
abundances.
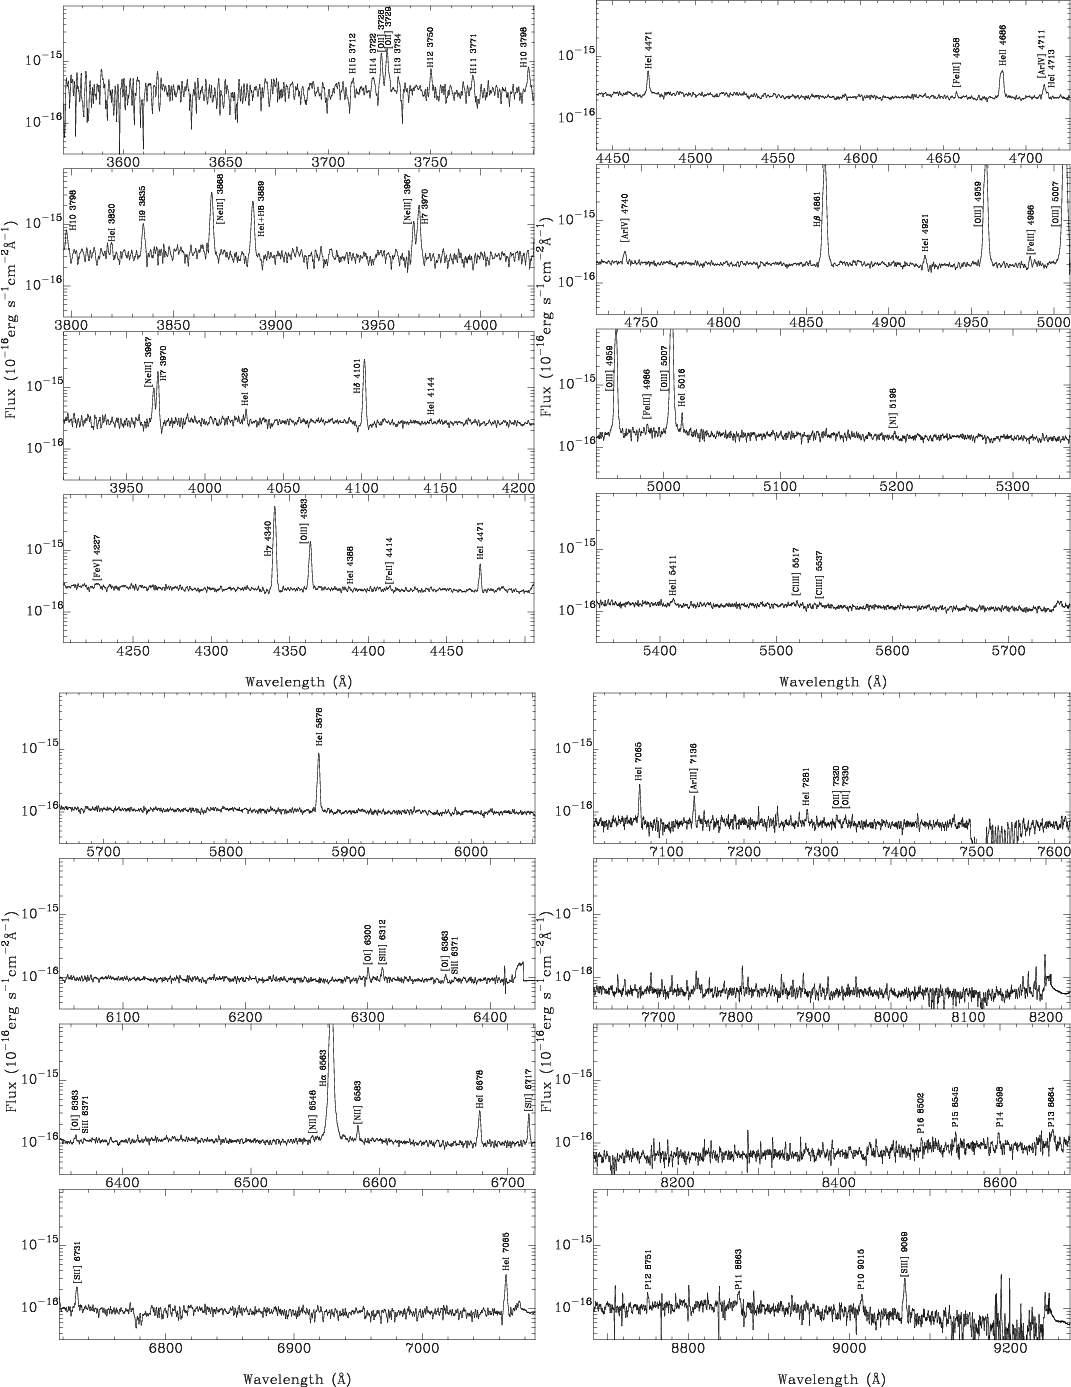 |
Figure 3: Spectrum of a region centered on clusters 4 and 5 and shown in Fig. 7a as a square region delineated by a thick dashed line. |
| Open with DEXTER | |
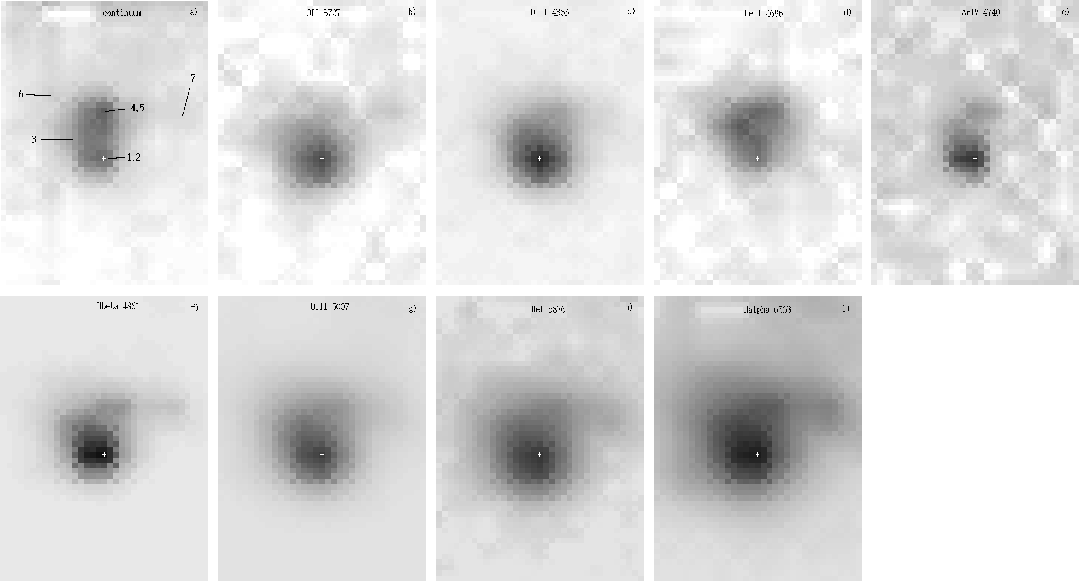 |
Figure 4:
Images in the continuum near H |
| Open with DEXTER | |
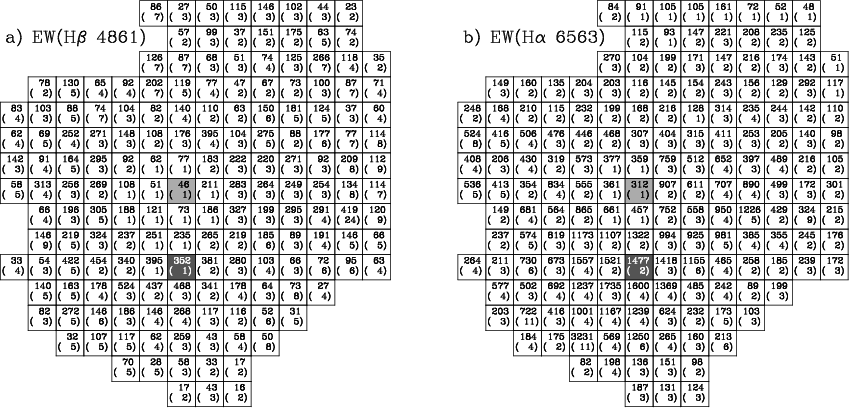 |
Figure 5:
Distribution of the H |
| Open with DEXTER | |
One of the advantages of the SBS 0335-052E panoramic observations with
GIRAFFE/ARGUS is that the spectra of each region with an angular size of
![]() within an aperture
within an aperture
![]() were obtained. This allows us to study the morphology of the galaxy
in the continuum and individual emission lines and to construct a model of
its H II region.
were obtained. This allows us to study the morphology of the galaxy
in the continuum and individual emission lines and to construct a model of
its H II region.
The central part of SBS 0335-052E containing the brightest clusters has an
angular size ![]() 2
2
![]() (Fig. 1) which is only
(Fig. 1) which is only ![]() 4 times
larger than the angular size of 0
4 times
larger than the angular size of 0
![]() 52 of each ARGUS lens. Therefore, for
better viewing we rebinned the images, splitting
each pixel in 9 from 0
52 of each ARGUS lens. Therefore, for
better viewing we rebinned the images, splitting
each pixel in 9 from 0
![]() 52 pixels to 0
52 pixels to 0
![]() 17
pixels linearly interpolating flux values in adjacent 0
17
pixels linearly interpolating flux values in adjacent 0
![]() 52 pixels.
In Fig. 4 we show the rebinned images of SBS 0335-052E in the
continuum near H
52 pixels.
In Fig. 4 we show the rebinned images of SBS 0335-052E in the
continuum near H![]()
![]() 4861 Å (a), and in the emission lines
[O II]
4861 Å (a), and in the emission lines
[O II] ![]() 3727 Å (b), [O III]
3727 Å (b), [O III] ![]() 4363 Å (c),
He II
4363 Å (c),
He II ![]() 4686 Å (d), [Ar IV]
4686 Å (d), [Ar IV] ![]() 4740 Å (e),
H
4740 Å (e),
H![]()
![]() 4861 Å (f), [O III]
4861 Å (f), [O III] ![]() 5007 Å (g),
He I
5007 Å (g),
He I ![]() 5876 Å (h) and H
5876 Å (h) and H![]()
![]() 6563 Å (i).
In all panels white crosses denote the pixel with the largest flux of
the H
6563 Å (i).
In all panels white crosses denote the pixel with the largest flux of
the H![]()
![]() 6563 Å emission line which is coincident with the
location of clusters 1+2 in Fig. 1.
6563 Å emission line which is coincident with the
location of clusters 1+2 in Fig. 1.
The image in the continuum (Fig. 4a) with labelled clusters resembles
the HST UV image (Fig. 1) despite the much lower angular
resolution determined by a seeing of ![]() 1
1
![]() (Table 1).
Several clusters are seen. However, the angular resolution in
the GIRAFFE data is not enough to separate clusters 1 and 2, and 4 and 5.
(Table 1).
Several clusters are seen. However, the angular resolution in
the GIRAFFE data is not enough to separate clusters 1 and 2, and 4 and 5.
The images in all emission lines (except for the He II ![]() 4686 Å
line) are
very similar. They show very bright emission in the region of clusters
1, 2 and much fainter emission in the direction of other clusters.
Furthermore, the equivalent widths of H
4686 Å
line) are
very similar. They show very bright emission in the region of clusters
1, 2 and much fainter emission in the direction of other clusters.
Furthermore, the equivalent widths of H![]()
![]() 4861 Å and
H
4861 Å and
H![]()
![]() 6563 Å emission lines in the clusters 1 and 2 (dark
squares in Fig. 5) and in the regions around these clusters are high.
These facts suggest that clusters 1 and 2 are young, with an age 3-4 Myr,
and contain numerous hot and massive ionising main-sequence stars.
It is likely that clusters 7 and probably 3 are also young because
EW(H
6563 Å emission lines in the clusters 1 and 2 (dark
squares in Fig. 5) and in the regions around these clusters are high.
These facts suggest that clusters 1 and 2 are young, with an age 3-4 Myr,
and contain numerous hot and massive ionising main-sequence stars.
It is likely that clusters 7 and probably 3 are also young because
EW(H![]() )
and EW(H
)
and EW(H![]() )
are high.
However, the number of ionising massive stars in those clusters is much lower
than in clusters 1 and 2.
On the other hand, clusters 4, 5 and 6 are probably more evolved as
suggested by their lower equivalent widths of the H
)
are high.
However, the number of ionising massive stars in those clusters is much lower
than in clusters 1 and 2.
On the other hand, clusters 4, 5 and 6 are probably more evolved as
suggested by their lower equivalent widths of the H![]()
![]() 4861 Å
and H
4861 Å
and H![]()
![]() 6563 Å emission lines.
In particular, the H
6563 Å emission lines.
In particular, the H![]() equivalent width
EW(H
equivalent width
EW(H![]() )
= 46 Å for clusters 4, 5 (grey square in
Fig. 5) and 87 Å for the square region delineated by the thick
dashed line correspond to an age of
)
= 46 Å for clusters 4, 5 (grey square in
Fig. 5) and 87 Å for the square region delineated by the thick
dashed line correspond to an age of ![]() 6-8 Myr and
6-8 Myr and ![]() 5 Myr adopting
a heavy element mass fraction Z = 0.001 for stars (Schaerer & Vacca 1998). The age for
clusters 4, 5 is larger if a lower
Z = 0.0004 corresponding to the metallicity
of the ionised gas is adopted.
The older age of clusters 4 and 5 is supported by their weak P
5 Myr adopting
a heavy element mass fraction Z = 0.001 for stars (Schaerer & Vacca 1998). The age for
clusters 4, 5 is larger if a lower
Z = 0.0004 corresponding to the metallicity
of the ionised gas is adopted.
The older age of clusters 4 and 5 is supported by their weak P![]() emission as compared to that of clusters 1 and 2 (Thompson et al. 2006).
The different ages of clusters 1+2and 4+5 could in principle explain why the brightness of clusters 4 and 5
in the UV range is greater than that of clusters 1 and 2 (Fig. 1),
why their brightness is comparable in the optical continuum (Fig. 4a)
and why clusters 4 and 5 are fainter in the NIR (Thompson et al. 2006). This is because
the relative contribution of the ionised gas emission is increased from the UV
to the NIR. The effect is stronger for clusters 1 and 2 because of the higher
EW(H
emission as compared to that of clusters 1 and 2 (Thompson et al. 2006).
The different ages of clusters 1+2and 4+5 could in principle explain why the brightness of clusters 4 and 5
in the UV range is greater than that of clusters 1 and 2 (Fig. 1),
why their brightness is comparable in the optical continuum (Fig. 4a)
and why clusters 4 and 5 are fainter in the NIR (Thompson et al. 2006). This is because
the relative contribution of the ionised gas emission is increased from the UV
to the NIR. The effect is stronger for clusters 1 and 2 because of the higher
EW(H![]() )
and hence of higher contribution of the ionised gas to the
total emission. In addition, the interstellar extinction may play role if it
is higher for clusters 1 and 2.
)
and hence of higher contribution of the ionised gas to the
total emission. In addition, the interstellar extinction may play role if it
is higher for clusters 1 and 2.
The morphology of SBS 0335-052E in the He II ![]() 4686 Å emission line
(Fig. 4d) significantly differs from that in other emission lines.
The emission of this line in the direction of the clusters 3 and 4+5is stronger than that in the direction of the clusters 1 and 2.
This offset of the He II
4686 Å emission line
(Fig. 4d) significantly differs from that in other emission lines.
The emission of this line in the direction of the clusters 3 and 4+5is stronger than that in the direction of the clusters 1 and 2.
This offset of the He II ![]() 4686 Å emission
line relative to other nebular
lines was noted by Izotov et al. (1997b) and Izotov et al. (2001b). Thus, it is evident
that the hard ionising radiation responsible for the
He II
4686 Å emission
line relative to other nebular
lines was noted by Izotov et al. (1997b) and Izotov et al. (2001b). Thus, it is evident
that the hard ionising radiation responsible for the
He II ![]() 4686 Å emission is not related to the young
main-sequence stars, but rather related to the post-main-sequence stars or
their remnants. This effect is more clearly seen in Fig. 6 where we
show the distribution of the relative flux He II
4686 Å emission is not related to the young
main-sequence stars, but rather related to the post-main-sequence stars or
their remnants. This effect is more clearly seen in Fig. 6 where we
show the distribution of the relative flux He II ![]() 4686/H
4686/H![]() .
In the direction on the clusters 1 and 2 the relative
He II
.
In the direction on the clusters 1 and 2 the relative
He II ![]() 4686/H
4686/H![]() flux is
flux is ![]() 1-2% while in
north-west
regions it increases to
1-2% while in
north-west
regions it increases to ![]() 6-7%.
Such high relative fluxes of
the He II
6-7%.
Such high relative fluxes of
the He II ![]() 4686 emission line is difficult to
explain by the ionising stellar radiation (e.g. Thuan & Izotov 2005; Izotov et al. 2004).
Although a small number of Wolf-Rayet stars are found in cluster 3
(see Papaderos et al. 2006, and this paper),
other mechanisms such as radiative shocks need to be invoked.
4686 emission line is difficult to
explain by the ionising stellar radiation (e.g. Thuan & Izotov 2005; Izotov et al. 2004).
Although a small number of Wolf-Rayet stars are found in cluster 3
(see Papaderos et al. 2006, and this paper),
other mechanisms such as radiative shocks need to be invoked.
 |
Figure 6:
He II |
| Open with DEXTER | |
The second advantage of the present GIRAFFE spectra for SBS 0335-052E is that they are obtained with sufficient spectral resolution. Therefore, the panoramic spectroscopic data can be used to study the kinematics of the H II regions in this galaxy.
In Fig. 7 we show the profiles of the
H![]()
![]() 6563 Å (a), He II
6563 Å (a), He II ![]() 4686 Å (b),
[O II]
4686 Å (b),
[O II] ![]() 3726, 3729 Å (c) and [O III]
3726, 3729 Å (c) and [O III] ![]() 4363 Å
(d) emission
lines in each pixel of the ARGUS array. Dotted lines show the wavelengths
of emission lines adopting the average redshift derived from the observed
wavelengths of all strong emission lines in the spectrum of the
brightest rectangular region delineated by a thick solid
line in Fig. 7a. H
4363 Å
(d) emission
lines in each pixel of the ARGUS array. Dotted lines show the wavelengths
of emission lines adopting the average redshift derived from the observed
wavelengths of all strong emission lines in the spectrum of the
brightest rectangular region delineated by a thick solid
line in Fig. 7a. H![]()
![]() 6563 Å is the strongest
line in all ARGUS array spectra and thus allows us to study the kinematical
properties in the
low-intensity extended regions of SBS 0335-052E. Other lines originate
in different zones of the H II region: He II
6563 Å is the strongest
line in all ARGUS array spectra and thus allows us to study the kinematical
properties in the
low-intensity extended regions of SBS 0335-052E. Other lines originate
in different zones of the H II region: He II ![]() 4686 Å
is characteristic of the highest ionisation zone,
[O II]
4686 Å
is characteristic of the highest ionisation zone,
[O II] ![]() 3726, 3729 Å are
characteristic of the lowest ionisation zone,
and [O III]
3726, 3729 Å are
characteristic of the lowest ionisation zone,
and [O III] ![]() 4363 Å
emission corresponds to the intermediate zone which is overlapped with the
highest- and lowest-ionisation zones.
4363 Å
emission corresponds to the intermediate zone which is overlapped with the
highest- and lowest-ionisation zones.
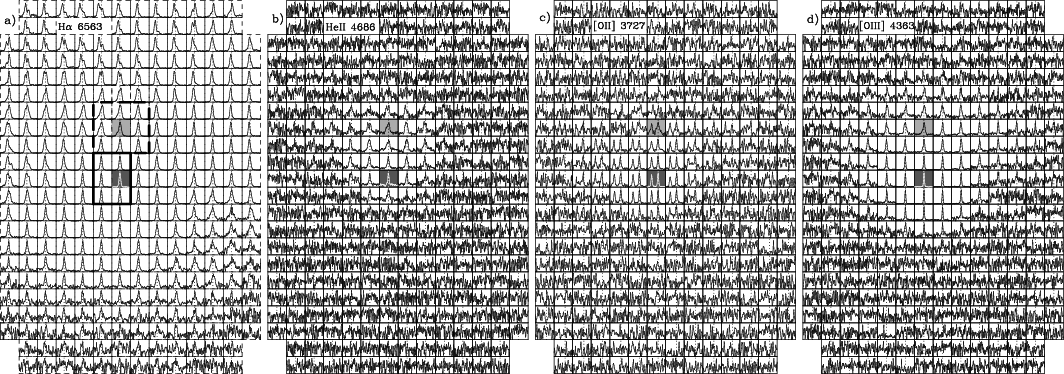 |
Figure 7:
Profiles of the emission lines: a) H |
| Open with DEXTER | |
H![]() emission is seen almost in the whole region observed with GIRAFFE
(Fig. 7a). The total aperture 1
emission is seen almost in the whole region observed with GIRAFFE
(Fig. 7a). The total aperture 1
![]() of ARGUS
corresponds to linear size
of ARGUS
corresponds to linear size ![]() 3.1 kpc
3.1 kpc![]() 1.8 kpc adopting the distance
to SBS 0335-052E of 54.3 Mpc (Izotov et al. 1997b). Thus,
the observed region is only a part of a much larger H II region
with a size of
1.8 kpc adopting the distance
to SBS 0335-052E of 54.3 Mpc (Izotov et al. 1997b). Thus,
the observed region is only a part of a much larger H II region
with a size of ![]() 6-8 kpc detected by Izotov et al. (2001b).
In the brightest
central region and in the slice oriented west-east the
H
6-8 kpc detected by Izotov et al. (2001b).
In the brightest
central region and in the slice oriented west-east the
H![]()
![]() 6563 line is narrow and no systematic offset of
the line profile from the dotted line is seen. Thus, no evidence is present for
the rotation of the observed part of the galaxy, since the
west-east orientation of the region
with narrow profiles is close to that of the disk-like H I cloud
seen edge-on (Pustilnik et al. 2001). On the other hand, in the north-south direction
the H
6563 line is narrow and no systematic offset of
the line profile from the dotted line is seen. Thus, no evidence is present for
the rotation of the observed part of the galaxy, since the
west-east orientation of the region
with narrow profiles is close to that of the disk-like H I cloud
seen edge-on (Pustilnik et al. 2001). On the other hand, in the north-south direction
the H![]() profiles are much broader and with more complex structure,
suggesting an outflow of ionised gas in the direction perpendicular
to the H I disk.
The schematic H
profiles are much broader and with more complex structure,
suggesting an outflow of ionised gas in the direction perpendicular
to the H I disk.
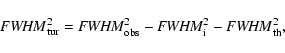
The schematic H![]() kinematic model is shown in Fig. 8
where the grey rectangular region is the region with narrow H
kinematic model is shown in Fig. 8
where the grey rectangular region is the region with narrow H![]() profiles oriented approximately along the H I cloud
detected by Pustilnik et al. (2001). Two regions with the ionised gas outflow are
shown to the north and south of the region with the narrow H
profiles oriented approximately along the H I cloud
detected by Pustilnik et al. (2001). Two regions with the ionised gas outflow are
shown to the north and south of the region with the narrow H![]() line.
The double-peaked H
line.
The double-peaked H![]() profiles in the northern
and southern parts of Fig. 7a suggest the presence of expanding
shells of ionised hydrogen with radial components of velocities of
profiles in the northern
and southern parts of Fig. 7a suggest the presence of expanding
shells of ionised hydrogen with radial components of velocities of
![]() 50 km s-1. This finding is consistent with the presence of
a shell of ionised gas at an angular distance of
50 km s-1. This finding is consistent with the presence of
a shell of ionised gas at an angular distance of ![]() 5
5
![]() to the north of cluster 1 (Thuan et al. 1997).
The width of H
to the north of cluster 1 (Thuan et al. 1997).
The width of H![]() in clusters 4, 5
(grey square in Fig. 7a) is
in clusters 4, 5
(grey square in Fig. 7a) is ![]() 2 times larger than that in
clusters 1 and 2 (dark square in Fig. 7a)
implying higher dynamic activity of the interstellar medium in the former,
older clusters. This higher activity is probably due to supernova
explosions.
2 times larger than that in
clusters 1 and 2 (dark square in Fig. 7a)
implying higher dynamic activity of the interstellar medium in the former,
older clusters. This higher activity is probably due to supernova
explosions.
All observed profiles were fit with a single Gaussian profile.
In Fig. 9a we show FWHMs of the H![]() emission line in
km s-1 due to the macroscopic motion only.
Errors are given in parentheses.
The widths are obtained after correction for the instrumental profiles and
for the thermal motion, following the formula
emission line in
km s-1 due to the macroscopic motion only.
Errors are given in parentheses.
The widths are obtained after correction for the instrumental profiles and
for the thermal motion, following the formula
 |
(1) |
In the brightest part of SBS 0335-052E the FWHM(H![]() )
in and around
the clusters 1 and 2 is
)
in and around
the clusters 1 and 2 is ![]() 40 km s-1. This value is lower than
the FWHM(H
40 km s-1. This value is lower than
the FWHM(H![]() )
of 83 km s-1 and 62 km s-1 derived by
Petrosian et al. (1997) for the NW and SE components of I Zw 18. Apparently, the
dispersion of macroscopic motion is strongly dependent on the age of
the starburst
and it is larger in the evolved starbursts where the SNe activity is higher.
Indeed, the difference between clusters 1 and 2 in SBS 0335-052E and the
NW and SE components of I Zw 18 is that the clusters 1 and 2 are
younger as the equivalent width of the H
)
of 83 km s-1 and 62 km s-1 derived by
Petrosian et al. (1997) for the NW and SE components of I Zw 18. Apparently, the
dispersion of macroscopic motion is strongly dependent on the age of
the starburst
and it is larger in the evolved starbursts where the SNe activity is higher.
Indeed, the difference between clusters 1 and 2 in SBS 0335-052E and the
NW and SE components of I Zw 18 is that the clusters 1 and 2 are
younger as the equivalent width of the H![]() emission line there,
EW(H
emission line there,
EW(H![]() )
)
![]() 300-400 Å (Fig. 5a), is much larger than
the EW(H
300-400 Å (Fig. 5a), is much larger than
the EW(H![]() )
)
![]() 100 Å in the NW and SE components of I Zw 18.
It is probable that SNe have not yet appeared or their number is small
in clusters 1 and 2.
100 Å in the NW and SE components of I Zw 18.
It is probable that SNe have not yet appeared or their number is small
in clusters 1 and 2.
On the other hand, the macroscopic motion in and around the older
clusters 4 and 5 is significantly larger with
FWHM(H![]() )
)
![]() 100 km s-1, likely due to a high SN activity.
Similar FWHM values and a similar spatial behaviour are found for the
[O II]
100 km s-1, likely due to a high SN activity.
Similar FWHM values and a similar spatial behaviour are found for the
[O II] ![]() 3729 Å and [O III]
3729 Å and [O III] ![]() 4363 Å
emission lines. (Figs. 9c and 9d).
The tendency of higher FWHM in more evolved clusters is also retained for
the He II
4363 Å
emission lines. (Figs. 9c and 9d).
The tendency of higher FWHM in more evolved clusters is also retained for
the He II ![]() 4686 Å emission line (Fig. 9b).
However, the macroscopic
velocity in the regions of He II emission is significantly higher than
that in the emission regions of other lines. This difference may be an
additional indication that the source of hard radiation is connected to fast
radiative shocks.
4686 Å emission line (Fig. 9b).
However, the macroscopic
velocity in the regions of He II emission is significantly higher than
that in the emission regions of other lines. This difference may be an
additional indication that the source of hard radiation is connected to fast
radiative shocks.
The large aperture (
![]() ), high enough spectral resolution and
large wavelength coverage of the ARGUS observations allow the detailed study
of physical conditions (electron temperature and electron number density) and
element abundances in the H II region.
However, there are some limitations to this study. First,
observations in different wavelength ranges have been done not in single
but in separate exposures over several nights (see Table 1).
Therefore, due to the varying weather conditions (seeing, transparency),
effects of atmospheric refraction and non-perfect pointing during
different exposures, the spectra in small apertures such as in a single pixel
of
), high enough spectral resolution and
large wavelength coverage of the ARGUS observations allow the detailed study
of physical conditions (electron temperature and electron number density) and
element abundances in the H II region.
However, there are some limitations to this study. First,
observations in different wavelength ranges have been done not in single
but in separate exposures over several nights (see Table 1).
Therefore, due to the varying weather conditions (seeing, transparency),
effects of atmospheric refraction and non-perfect pointing during
different exposures, the spectra in small apertures such as in a single pixel
of
![]() and in different wavelength ranges are not
well adjusted since they represent slightly different regions of the galaxy.
These effects tend to be lower with increasing aperture. Therefore, depending
on the adopted aperture, we will follow different approaches in the
determination of element abundances. We consider the element abundance
determination from the spectra obtained in apertures with three different
sizes. First, for the
spectra obtained within the largest available aperture of
and in different wavelength ranges are not
well adjusted since they represent slightly different regions of the galaxy.
These effects tend to be lower with increasing aperture. Therefore, depending
on the adopted aperture, we will follow different approaches in the
determination of element abundances. We consider the element abundance
determination from the spectra obtained in apertures with three different
sizes. First, for the
spectra obtained within the largest available aperture of
![]() there is no need to adjust the different wavelength
ranges. This allows us to consistently correct the spectra for interstellar
extinction using the observed decrement of hydrogen Balmer lines and then
derive element abundances. Second, we consider the spectrum of the brightest
region of SBS 0335-052E obtained within an aperture
there is no need to adjust the different wavelength
ranges. This allows us to consistently correct the spectra for interstellar
extinction using the observed decrement of hydrogen Balmer lines and then
derive element abundances. Second, we consider the spectrum of the brightest
region of SBS 0335-052E obtained within an aperture
![]() (the rectangular region delineated by a thick solid line in Fig. 7a).
This spectrum is shown in
Fig. 2. Since the aperture for this spectrum is relatively small, some
adjustment of adjacent wavelength ranges is needed. However, thanks to the high
brightness of this region many bright emission lines are seen in its spectrum.
Therefore we use the same brightest emission lines in the overlapping
wavelength ranges (where this is possible) to scale the spectra in the
adjacent wavelength ranges. These lines are H7
(the rectangular region delineated by a thick solid line in Fig. 7a).
This spectrum is shown in
Fig. 2. Since the aperture for this spectrum is relatively small, some
adjustment of adjacent wavelength ranges is needed. However, thanks to the high
brightness of this region many bright emission lines are seen in its spectrum.
Therefore we use the same brightest emission lines in the overlapping
wavelength ranges (where this is possible) to scale the spectra in the
adjacent wavelength ranges. These lines are H7 ![]() 3970 Å,
He I
3970 Å,
He I ![]() 4471 Å, [O III]
4471 Å, [O III] ![]() 4959 Å,
[O I]
4959 Å,
[O I] ![]() 6300 Å and He I
6300 Å and He I ![]() 7065 Å.
In the remaining two overlapping wavelength
ranges
7065 Å.
In the remaining two overlapping wavelength
ranges ![]() 5650-5750 and
5650-5750 and ![]() 8100-8200
where no strong emission lines are seen we used the continuum
levels to adjust the adjacent spectra. Thus, in the spectrum of the
brightest region the determination
of the interstellar extinction is still possible, which was used to correct the
spectra. Third, in the case of smallest apertures
of
8100-8200
where no strong emission lines are seen we used the continuum
levels to adjust the adjacent spectra. Thus, in the spectrum of the
brightest region the determination
of the interstellar extinction is still possible, which was used to correct the
spectra. Third, in the case of smallest apertures
of
![]() ,
in general the signal-to-noise of the spectra is not
enough to use the same emission lines in the overlapping wavelength ranges.
Therefore, for these apertures we adjust spectra in different wavelength ranges
assuming that the ratios of hydrogen Balmer lines correspond to the theoretical
values at the electron temperature of
,
in general the signal-to-noise of the spectra is not
enough to use the same emission lines in the overlapping wavelength ranges.
Therefore, for these apertures we adjust spectra in different wavelength ranges
assuming that the ratios of hydrogen Balmer lines correspond to the theoretical
values at the electron temperature of
![]() K. Hence, no determination
of the interstellar extinction is possible
for the smallest apertures and not all wavelength ranges could be adjusted.
Fortunately, it is possible to adjust wavelength ranges containing the [O II]
K. Hence, no determination
of the interstellar extinction is possible
for the smallest apertures and not all wavelength ranges could be adjusted.
Fortunately, it is possible to adjust wavelength ranges containing the [O II]
![]() 3726, 3729 Å, [O III]
3726, 3729 Å, [O III] ![]() 4363, 4959, 5007 Å,
[S II]
4363, 4959, 5007 Å,
[S II] ![]() 6717, 6731 Å emission lines,
therefore at least the determination of the electron temperature
6717, 6731 Å emission lines,
therefore at least the determination of the electron temperature
![]() (O III), the electron number density
(O III), the electron number density ![]() (S II) and the
oxygen abundance is possible.
(S II) and the
oxygen abundance is possible.
To derive ![]() ,
,
![]() and heavy element abundances we follow the prescriptions
by Izotov et al. (2006a). Where possible, the coefficient of interstellar
extinction C(H
and heavy element abundances we follow the prescriptions
by Izotov et al. (2006a). Where possible, the coefficient of interstellar
extinction C(H![]() )
and the equivalent width of absorption hydrogen lines
EW
)
and the equivalent width of absorption hydrogen lines
EW
![]() are derived from the observed hydrogen Balmer decrement. In this
procedure we assume that EW
are derived from the observed hydrogen Balmer decrement. In this
procedure we assume that EW
![]() is the same for all hydrogen lines. Then
the fluxes of emission lines were corrected for interstellar extinction
and underlying stellar absorption (where this is possible).
is the same for all hydrogen lines. Then
the fluxes of emission lines were corrected for interstellar extinction
and underlying stellar absorption (where this is possible).
We adopt the three zone model of the H II region. The electron
temperature ![]() (O III) in the high-ionisation zone is derived from
the [O III]
(O III) in the high-ionisation zone is derived from
the [O III] ![]() 4363/(
4363/(![]() 4959+
4959+![]() 5007) flux ratio.
This temperature is used to derive abundances of ions O2+ and Ne2+.
Since He II
5007) flux ratio.
This temperature is used to derive abundances of ions O2+ and Ne2+.
Since He II ![]() 4686 Å emission is present in the SBS 0335-052E
spectrum, the O3+ abundance is derived following Izotov et al. (2006a) and adopting
4686 Å emission is present in the SBS 0335-052E
spectrum, the O3+ abundance is derived following Izotov et al. (2006a) and adopting
![]() (O III). Since the O3+ abundance is significantly lower than
the O2+ abundance, the uncertainties in the temperature for the zone
where the O3+ ion is present introduce only a small uncertainty in the total
oxygen abundance. Some other emission lines of high-ionisation
ions Ar3+, Cl3+, Fe3+ - Fe6+ are seen in the spectrum of
SBS 0335-052E in Fig. 2. In general these ions are present in the
inner part of the H II region with a temperature higher than
(O III). Since the O3+ abundance is significantly lower than
the O2+ abundance, the uncertainties in the temperature for the zone
where the O3+ ion is present introduce only a small uncertainty in the total
oxygen abundance. Some other emission lines of high-ionisation
ions Ar3+, Cl3+, Fe3+ - Fe6+ are seen in the spectrum of
SBS 0335-052E in Fig. 2. In general these ions are present in the
inner part of the H II region with a temperature higher than
![]() (O III).
(O III).
 |
Figure 8:
Schematic H |
| Open with DEXTER | |
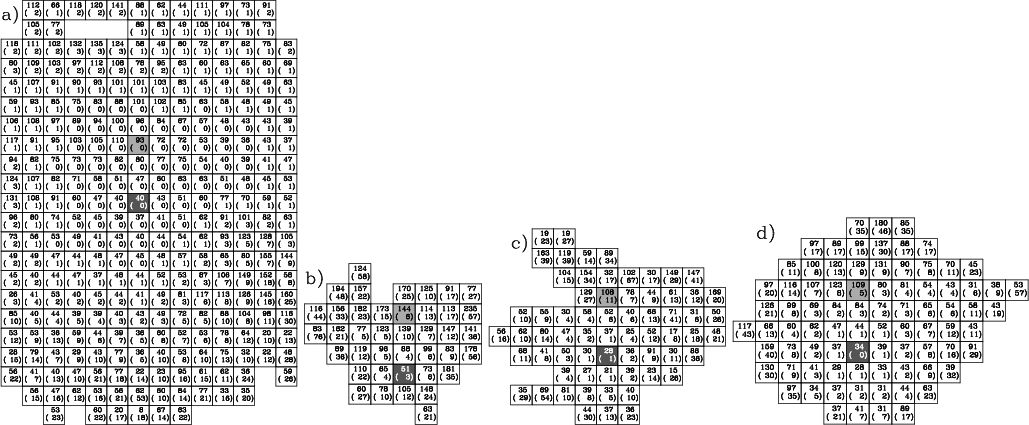 |
Figure 9:
Macroscopic/turbulent velocity dispersion at the FWHM (in km s-1) derived
from the a) H |
| Open with DEXTER | |
However, since there is no temperature
constraint from observations for
these ions and atomic data are not well known for some of them,
we decided not to use these ions for the abundance determination.
For the intermediate-ionisation zone we adopt the electron
temperature ![]() (S III) which was derived using the relation
between
(S III) which was derived using the relation
between ![]() (S III) and
(S III) and ![]() (O III) from Izotov et al. (2006a). The
temperature
(O III) from Izotov et al. (2006a). The
temperature ![]() (S III) is used to derive the abundances of ions
S2+, Ar2+ and Cl2+. Finally, for the low-ionisation zone
we adopt the electron
temperature
(S III) is used to derive the abundances of ions
S2+, Ar2+ and Cl2+. Finally, for the low-ionisation zone
we adopt the electron
temperature ![]() (O II) which was derived using the relation
between
(O II) which was derived using the relation
between ![]() (O II) and
(O II) and ![]() (O III) from Izotov et al. (2006a). This
temperature is used to derive the abundances of ions O+, N+, S+ and
Fe2+. Emission lines of some other low-ionisation ions and neutral
species are present in the low-ionisation zone, namely, Fe+, O0, N0.
We decided not to use them for the abundance determination since they reside
both in the neutral and ionised gas and their abundances in the H II
region are subject to large uncertainties.
(O III) from Izotov et al. (2006a). This
temperature is used to derive the abundances of ions O+, N+, S+ and
Fe2+. Emission lines of some other low-ionisation ions and neutral
species are present in the low-ionisation zone, namely, Fe+, O0, N0.
We decided not to use them for the abundance determination since they reside
both in the neutral and ionised gas and their abundances in the H II
region are subject to large uncertainties.
The electron number density ![]() is derived using the
[O II]
is derived using the
[O II] ![]() 3726/
3726/![]() 3729,
[Ar IV]
3729,
[Ar IV] ![]() 4711/
4711/![]() 4740 and
[S II]
4740 and
[S II] ![]() 6717/
6717/![]() 6731 emission line fluxes.
6731 emission line fluxes.
The total heavy element abundances are obtained with the use of ionisation correction factors ICFs from Izotov et al. (2006a) for each element. ICFs take into account the abundances of ions in unseen stages of ionisation.
We first consider the chemical composition in the brightest part of
SBS 0335-052E. Observed emission line fluxes
relative to the H![]() flux,
F(
flux,
F(![]() )/F(H
)/F(H![]() ), emission line fluxes relative to the
H
), emission line fluxes relative to the
H![]() flux, corrected for interstellar extinction
and underlying stellar absorption, I(
flux, corrected for interstellar extinction
and underlying stellar absorption, I(![]() )/I(H
)/I(H![]() ), and the
equivalent widths of emission lines
EW(
), and the
equivalent widths of emission lines
EW(![]() )
are shown in Table 4.
The extinction coefficient C(H
)
are shown in Table 4.
The extinction coefficient C(H![]() ), the equivalent width EW
), the equivalent width EW
![]() of the absorption hydrogen Balmer lines and the observed flux F(H
of the absorption hydrogen Balmer lines and the observed flux F(H![]() )
of the H
)
of the H![]() emission line are shown at the end of Table
4.
Electron temperatures, electron number densities, ionic and total heavy
element abundances for the brightest region are shown in the second
column of Table 2. In general, the derived parameters are
consistent with previous determinations e.g. by Izotov et al. (1997b), Izotov et al. (1999),
Thuan & Izotov (2005). In particular, the electron temperature
emission line are shown at the end of Table
4.
Electron temperatures, electron number densities, ionic and total heavy
element abundances for the brightest region are shown in the second
column of Table 2. In general, the derived parameters are
consistent with previous determinations e.g. by Izotov et al. (1997b), Izotov et al. (1999),
Thuan & Izotov (2005). In particular, the electron temperature ![]() (O III)
in all measurements is high and is close to 20 000 K. It was found in previous
studies that the H II region in SBS 0335-052E is relatively dense.
We confirm this finding. The electron number density, which we derive
from the [S II]
(O III)
in all measurements is high and is close to 20 000 K. It was found in previous
studies that the H II region in SBS 0335-052E is relatively dense.
We confirm this finding. The electron number density, which we derive
from the [S II] ![]() 6717/
6717/![]() 6731 flux ratio
in the brightest region, is
6731 flux ratio
in the brightest region, is ![]() 150 cm-3. A similar value is obtained
from the [O II]
150 cm-3. A similar value is obtained
from the [O II] ![]() 3726/
3726/![]() 3729 flux ratio. On the other
hand, the electron number density derived from the [Ar IV]
3729 flux ratio. On the other
hand, the electron number density derived from the [Ar IV]
![]() 4711/
4711/![]() 4740 flux ratio, using the data from Aller (1984),
is much larger,
4740 flux ratio, using the data from Aller (1984),
is much larger, ![]() 6000 cm-3. Thus, it appears that the
high-ionisation regions are much denser than the low-ionisation regions.
6000 cm-3. Thus, it appears that the
high-ionisation regions are much denser than the low-ionisation regions.
Table 2: Heavy element abundances.
The oxygen abundance 12 + log O/H = 7.31 ![]() 0.01 is in perfect
agreement with recent determinations by Izotov et al. (1997b), Izotov et al. (1999) and
Thuan & Izotov (2005). The Ne/O, S/O, Cl/O and Ar/O abundance ratios are
very close to the average values found by, e.g., Izotov et al. (2006a) for
the large sample of low-metallicity emission-line galaxies. On the
other hand, the N/O abundance ratio -1.37 appears higher than the mean
value of -1.5 to -1.6 for the most metal-deficient BCDs (Izotov et al. 2006a; Izotov & Thuan 1999).
Since only N+ lines are observed in the optical spectrum of SBS 0335-052E
the total nitrogen abundance is derived as N/H = ICF(N)
0.01 is in perfect
agreement with recent determinations by Izotov et al. (1997b), Izotov et al. (1999) and
Thuan & Izotov (2005). The Ne/O, S/O, Cl/O and Ar/O abundance ratios are
very close to the average values found by, e.g., Izotov et al. (2006a) for
the large sample of low-metallicity emission-line galaxies. On the
other hand, the N/O abundance ratio -1.37 appears higher than the mean
value of -1.5 to -1.6 for the most metal-deficient BCDs (Izotov et al. 2006a; Izotov & Thuan 1999).
Since only N+ lines are observed in the optical spectrum of SBS 0335-052E
the total nitrogen abundance is derived as N/H = ICF(N)![]() N+/H+,
where ICF(N)
N+/H+,
where ICF(N) ![]() (O3++O2++O+)/O+. Inspection
of Table 4 shows that the relative flux
[O II]
(O3++O2++O+)/O+. Inspection
of Table 4 shows that the relative flux
[O II] ![]() 3727/H
3727/H![]() is 0.2, or 30% lower than
that in some other observations of SBS 0335-052E (e.g. Papaderos et al. 2006; Izotov et al. 1999)
resulting in high ICF(N). The lower [O II]
is 0.2, or 30% lower than
that in some other observations of SBS 0335-052E (e.g. Papaderos et al. 2006; Izotov et al. 1999)
resulting in high ICF(N). The lower [O II] ![]() 3727 flux in the bright
region (Table 4) could be due to observational uncertainties
(slightly different pointings of SBS 0335-052E during observations with
different setups, effect of differential refraction, variable seeing, etc.).
Adopting an [O II]
3727 flux in the bright
region (Table 4) could be due to observational uncertainties
(slightly different pointings of SBS 0335-052E during observations with
different setups, effect of differential refraction, variable seeing, etc.).
Adopting an [O II] ![]() 3727 flux
3727 flux ![]() 30% higher will result
in log N/O
30% higher will result
in log N/O ![]() -1.5, in much better agreement with other determinations.
Such increase of the [O II]
-1.5, in much better agreement with other determinations.
Such increase of the [O II] ![]() 3727 flux will also slightly
decrease by
3727 flux will also slightly
decrease by ![]() 0.1 dex the iron abundance, while the abundances of
other heavy elements will remain almost unchanged. In particular, the oxygen
abundance 12 + log O/H will be increased only by 0.01 dex. The
Fe/O abundance ratio is high and is typical for the extremely
metal-deficient BCDs (Izotov et al. 2006a). This fact suggests that the
depletion of iron onto dust in SBS 0335-052E is small.
0.1 dex the iron abundance, while the abundances of
other heavy elements will remain almost unchanged. In particular, the oxygen
abundance 12 + log O/H will be increased only by 0.01 dex. The
Fe/O abundance ratio is high and is typical for the extremely
metal-deficient BCDs (Izotov et al. 2006a). This fact suggests that the
depletion of iron onto dust in SBS 0335-052E is small.
We use panoramic VLT/GIRAFFE data to obtain the integrated spectrum of
SBS 0335-052E by summing each
![]() spectra in the whole
aperture. The resulting spectrum is significantly more noisy than
the spectrum of the brightest region because many spectra of
low-brightness regions were co-added to the spectrum of the brightest
region. However, the integrated spectrum is not subject to the observational
uncertainties which are much more important for the spectra obtained
with the smaller apertures (non-perfect pointing, variable seeing).
Additionally, it allows us to obtain integrated characteristics such as
the luminosity of the galaxy in individual lines.
spectra in the whole
aperture. The resulting spectrum is significantly more noisy than
the spectrum of the brightest region because many spectra of
low-brightness regions were co-added to the spectrum of the brightest
region. However, the integrated spectrum is not subject to the observational
uncertainties which are much more important for the spectra obtained
with the smaller apertures (non-perfect pointing, variable seeing).
Additionally, it allows us to obtain integrated characteristics such as
the luminosity of the galaxy in individual lines.
In Table 5 we show the measured absolute fluxes F(![]() )
of the emission lines, the absolute fluxes I(
)
of the emission lines, the absolute fluxes I(![]() )
corrected for
the interstellar extinction and underlying stellar absorption, the respective
fluxes relative to the H
)
corrected for
the interstellar extinction and underlying stellar absorption, the respective
fluxes relative to the H![]()
![]() 4861 flux,
F(
4861 flux,
F(![]() )/F(H
)/F(H![]() )
and I(
)
and I(![]() )/I(H
)/I(H![]() ),
the equivalent widths EW(
),
the equivalent widths EW(![]() )
of the emission lines, the interstellar
extinction coefficient C(H
)
of the emission lines, the interstellar
extinction coefficient C(H![]() )
and equivalent width of hydrogen
Balmer absorption lines EW
)
and equivalent width of hydrogen
Balmer absorption lines EW
![]() .
The absolute measured flux of
H
.
The absolute measured flux of
H![]() emission line
F(H
emission line
F(H![]() )
=
)
=
![]() erg s-1 cm-2 is consistent
with the value
erg s-1 cm-2 is consistent
with the value
![]() erg s-1 cm-2 obtained by
Pustilnik et al. (2004). The luminosities of the H
erg s-1 cm-2 obtained by
Pustilnik et al. (2004). The luminosities of the H![]() and H
and H![]() emission lines
corrected for interstellar extinction and underlying stellar absorption
are equal to L(H
emission lines
corrected for interstellar extinction and underlying stellar absorption
are equal to L(H![]() )
=
)
=
![]() erg s-1 and
L(H
erg s-1 and
L(H![]() )
=
)
=
![]() erg s-1, corresponding to the
equivalent number of O7 V stars N(O7 V) =
erg s-1, corresponding to the
equivalent number of O7 V stars N(O7 V) =
![]() .
The major fraction of these stars (
.
The major fraction of these stars (![]() 90%) is located in the two compact
clusters 1 and 2 as it is shown by the high-resolution spatial
distribution of the P
90%) is located in the two compact
clusters 1 and 2 as it is shown by the high-resolution spatial
distribution of the P![]() emission in SBS 0335-052E obtained by
Thompson et al. (2006) from the HST observations.
To the best of our knowledge, these two clusters (most likely, cluster 1)
are among the richest super-star clusters, hosting a very large number of O
stars within a region of angular size
emission in SBS 0335-052E obtained by
Thompson et al. (2006) from the HST observations.
To the best of our knowledge, these two clusters (most likely, cluster 1)
are among the richest super-star clusters, hosting a very large number of O
stars within a region of angular size ![]() 0
0
![]() 1-0
1-0
![]() 2,
corresponding to a linear size
2,
corresponding to a linear size ![]() 25-50 pc.
25-50 pc.
Electron temperatures, electron number densities ![]() (S II) and
(S II) and
![]() (O II), ionic and
total element abundances derived from the integrated spectrum are shown in
the third column of Table 2. They are similar to the parameters
derived for the brightest region despite the fact that the statistical errors
for the parameters derived from the integrated spectrum are higher.
Note that the N/O abundance ratio derived
from the integrated spectrum is lower than that derived from the spectrum of
the brightest region and is consistent with the average values of N/O
obtained for most metal-deficient galaxies (Izotov et al. 2006a; Izotov & Thuan 1999).
(O II), ionic and
total element abundances derived from the integrated spectrum are shown in
the third column of Table 2. They are similar to the parameters
derived for the brightest region despite the fact that the statistical errors
for the parameters derived from the integrated spectrum are higher.
Note that the N/O abundance ratio derived
from the integrated spectrum is lower than that derived from the spectrum of
the brightest region and is consistent with the average values of N/O
obtained for most metal-deficient galaxies (Izotov et al. 2006a; Izotov & Thuan 1999).
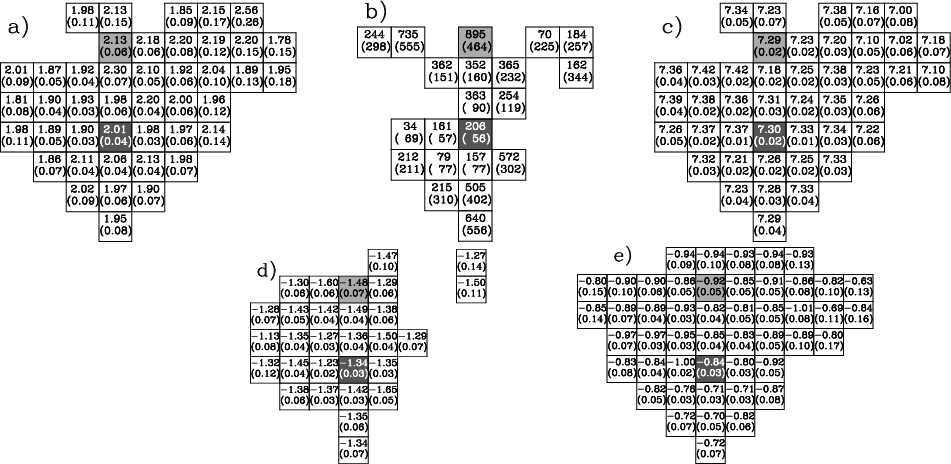 |
Figure 10:
a) Electron temperature distribution (in 104 K) from the
[O III] |
| Open with DEXTER | |
The VLT/GIRAFFE panoramic spectra allow us to study the distribution
of the electron temperature ![]() (O III), the electron number density
(O III), the electron number density
![]() (S II) and heavy element abundances in the H II region.
For this we use the spectra
obtained for the
(S II) and heavy element abundances in the H II region.
For this we use the spectra
obtained for the
![]() apertures. We took into
consideration only spectra in which at least the following lines of
heavy elements are detected: [O II]
apertures. We took into
consideration only spectra in which at least the following lines of
heavy elements are detected: [O II] ![]() 3726, 3729 Å,
[O III]
3726, 3729 Å,
[O III] ![]() 4363, 4959, 5007 Å. This allows us to derive
the electron temperature
4363, 4959, 5007 Å. This allows us to derive
the electron temperature ![]() (O III) and oxygen abundance. From these
spectra we excluded those, where the oxygen abundance
12 + log O/H is derived with an error greater than 0.1 dex.
(O III) and oxygen abundance. From these
spectra we excluded those, where the oxygen abundance
12 + log O/H is derived with an error greater than 0.1 dex.
In Fig. 10a we show the distribution of the electron temperature
![]() (O III). It is seen that the H II region is hot in all
small apertures and has a characteristic temperature of
(O III). It is seen that the H II region is hot in all
small apertures and has a characteristic temperature of ![]() 20 000 K.
There is a slight spatial trend of the electron temperature with
20 000 K.
There is a slight spatial trend of the electron temperature with
![]() (O III) being
slightly higher in the western part and slightly lower in the eastern part.
The electron number density derived from the
[S II]
(O III) being
slightly higher in the western part and slightly lower in the eastern part.
The electron number density derived from the
[S II] ![]() 6717, 6731 Å emission lines is high,
of several hundred particles per cm3 (Fig. 10b). However, the
errors in the determination of
6717, 6731 Å emission lines is high,
of several hundred particles per cm3 (Fig. 10b). However, the
errors in the determination of ![]() are large and are
caused by the low intensity of the [S II]
emission lines. Similar number densities are derived from the
[O II]
are large and are
caused by the low intensity of the [S II]
emission lines. Similar number densities are derived from the
[O II] ![]() 3726/
3726/![]() 3729 flux ratio. Although
[O II]
3729 flux ratio. Although
[O II] ![]() 3726, 3729 Å emission lines are brighter than
[S II]
3726, 3729 Å emission lines are brighter than
[S II] ![]() 6717, 6731 Å, the low signal-to-noise ratio of the
spectrum containing [O II] lines (Fig. 2) due to lower
sensitivity of the GIRAFFE detector in that wavelength range
prevents the determination
of the electron number density from the [O II] lines in a region
larger than that from the [S II] emission lines.
As already mentioned, other emission lines detected in our spectra
can in principle be used to determine the electron density.
[Ar IV]
6717, 6731 Å, the low signal-to-noise ratio of the
spectrum containing [O II] lines (Fig. 2) due to lower
sensitivity of the GIRAFFE detector in that wavelength range
prevents the determination
of the electron number density from the [O II] lines in a region
larger than that from the [S II] emission lines.
As already mentioned, other emission lines detected in our spectra
can in principle be used to determine the electron density.
[Ar IV] ![]() 4711 and 4740 Å are strong enough only in the brightest region of SBS 0335-052E, where they
consistently indicate an electron number density in the range
103-104 cm-3.
[Cl III]
4711 and 4740 Å are strong enough only in the brightest region of SBS 0335-052E, where they
consistently indicate an electron number density in the range
103-104 cm-3.
[Cl III] ![]() 5517 and 5537 Å are too weak even
in the brightest region (Fig. 2) and are therefore not used.
5517 and 5537 Å are too weak even
in the brightest region (Fig. 2) and are therefore not used.
The oxygen abundance 12 + log O/H distribution is shown in Fig. 10c.
There are some variations of the oxygen abundance in the range 7.00-7.42
with a slight trend of a decreasing 12 + log O/H from the East to the West.
In particular, it appears that the oxygen abundance in cluster 7 of ![]() 7.2
(western side of Fig. 10c) is slightly lower than in other clusters,
confirming the finding by Papaderos et al. (2006).
Thus, there is some evidence for a possible self-enrichment by heavy elements
(cf. Izotov et al. 1997b,1999) or for the presence of "initial'' abundance
variations in the gas. However, the errors in
the electron temperature, electron number density and oxygen abundance include
only errors derived based on the photon statistics of non-flux-calibrated
emission line fluxes and they do not take into account uncertainties in
pointing, variable seeing, differential refraction, etc., which a difficult to
estimate. Therefore, variations in the oxygen abundance may not be
statistically significant.
7.2
(western side of Fig. 10c) is slightly lower than in other clusters,
confirming the finding by Papaderos et al. (2006).
Thus, there is some evidence for a possible self-enrichment by heavy elements
(cf. Izotov et al. 1997b,1999) or for the presence of "initial'' abundance
variations in the gas. However, the errors in
the electron temperature, electron number density and oxygen abundance include
only errors derived based on the photon statistics of non-flux-calibrated
emission line fluxes and they do not take into account uncertainties in
pointing, variable seeing, differential refraction, etc., which a difficult to
estimate. Therefore, variations in the oxygen abundance may not be
statistically significant.
In Fig. 10d we show variations of N/O abundance ratio. The log N/O
varies in the range from -1.13 to -1.65 with relatively small
errors. However, the real errors might be much higher because of the
limitations introduced by the small apertures of
![]() for
each spectrum. The same is true for the distribution of the Ne/O abundance
ratio (Fig. 10e).
for
each spectrum. The same is true for the distribution of the Ne/O abundance
ratio (Fig. 10e).
SBS 0335-052E, being one of the most metal-deficient BCDs, plays an important
role in the determination of the primordial He mass fraction ![]() and, thus,
in the determination of the baryonic mass fraction
of the Universe. Since the precision in the
determination of
and, thus,
in the determination of the baryonic mass fraction
of the Universe. Since the precision in the
determination of ![]() should be better than
should be better than ![]() 1% to place useful
constraints on the cosmological models, high signal-to-noise spectra
are needed for this. Additionally, several systematic effects should
be taken into account, and spectra and emission line fluxes should be
corrected for them (see for details Izotov et al. 2006b; Izotov & Thuan 2004).
These are the corrections for (1) interstellar extinction, (2) ionisation
structure, (3) collisional excitation of helium lines, (4)
fluorescence in helium lines, (5) temperature variations,
(6) underlying stellar
absorption, (7) collisional excitation of hydrogen lines. All
these corrections are at a level of a few percent and, apart from (2)
influence each other in a complicated way.
The case of SBS 0335-052E is particularly complicated, because
its H II region is dense, hot and optically thick in some He I
emission lines (Izotov et al. 1999). Therefore, effects (3), (4) and (7) are strong
in the H II region of SBS 0335-052E.
1% to place useful
constraints on the cosmological models, high signal-to-noise spectra
are needed for this. Additionally, several systematic effects should
be taken into account, and spectra and emission line fluxes should be
corrected for them (see for details Izotov et al. 2006b; Izotov & Thuan 2004).
These are the corrections for (1) interstellar extinction, (2) ionisation
structure, (3) collisional excitation of helium lines, (4)
fluorescence in helium lines, (5) temperature variations,
(6) underlying stellar
absorption, (7) collisional excitation of hydrogen lines. All
these corrections are at a level of a few percent and, apart from (2)
influence each other in a complicated way.
The case of SBS 0335-052E is particularly complicated, because
its H II region is dense, hot and optically thick in some He I
emission lines (Izotov et al. 1999). Therefore, effects (3), (4) and (7) are strong
in the H II region of SBS 0335-052E.
To derive the He abundance we use the integrated spectrum of SBS 0335-052E
because it is least dependent on the observational parameters discussed
above. The He+ abundance y+ which is derived from the He I
emission lines depends on the adopted He I
emissivities. We adopt the new He I emissivities by Porter et al. (2005).
In this paper, following Izotov et al. (1997a,1994), Izotov & Thuan (1998,2004) and
Izotov et al. (2006b) we use the five
strongest He I ![]() 3889,
3889, ![]() 4471,
4471,
![]() 5876,
5876, ![]() 6678 and
6678 and ![]() 7065 emission lines to derive
7065 emission lines to derive
![]() (He+) and
(He+) and ![]() (
(![]() 3889).
The He I
3889).
The He I ![]() 3889 and
3889 and
![]() 7065 lines play an important role because they are particularly
sensitive to both quantities. Since the
He I
7065 lines play an important role because they are particularly
sensitive to both quantities. Since the
He I ![]() 3889 line is blended with the H8
3889 line is blended with the H8 ![]() 3889 line,
we have subtracted the latter, assuming its intensity to be equal to 0.107 I(H
3889 line,
we have subtracted the latter, assuming its intensity to be equal to 0.107 I(H![]() )
(Aller 1984).
)
(Aller 1984).
Besides the emissivities the derived
![]() /H+ abundance
depends on several
other parameters: collisional excitation of hydrogen emission lines, electron
number density
/H+ abundance
depends on several
other parameters: collisional excitation of hydrogen emission lines, electron
number density ![]() (He+) and electron temperature
(He+) and electron temperature ![]() (He+), equivalent
widths EW(
(He+), equivalent
widths EW(![]() 3889), EW(
3889), EW(![]() 4471), EW(
4471), EW(![]() 5876),
EW(
5876),
EW(![]() 6678) and EW(
6678) and EW(![]() 7065) of He I stellar absorption lines,
optical depth
7065) of He I stellar absorption lines,
optical depth
![]() (
(![]() 3889) of the He I
3889) of the He I ![]() 3889 emission line.
We use Monte Carlo simulations for the y+ determination, randomly varying
the parameters
in their ranges. First, we subtract the fractions of the H
3889 emission line.
We use Monte Carlo simulations for the y+ determination, randomly varying
the parameters
in their ranges. First, we subtract the fractions of the H![]() and H
and H![]() observed fluxes due to the collisional excitation. We adopt that
the fraction
observed fluxes due to the collisional excitation. We adopt that
the fraction
![]() (H
(H![]() )/I(H
)/I(H![]() )
of the
H
)
of the
H![]() flux due to the collisional excitation varying in the range
0%-5% of the total flux. This fraction is
randomly generated 100 times in the adopted range. The fraction of
the H
flux due to the collisional excitation varying in the range
0%-5% of the total flux. This fraction is
randomly generated 100 times in the adopted range. The fraction of
the H![]() emission line flux due to the collisional excitation
is adopted to be three times less than that of the H
emission line flux due to the collisional excitation
is adopted to be three times less than that of the H![]() flux.
For each generated fraction
of the H
flux.
For each generated fraction
of the H![]() and H
and H![]() they are subtracted from the total observed
fluxes and then all emission line fluxes are corrected for the interstellar
extinction and abundances of elements are calculated.
they are subtracted from the total observed
fluxes and then all emission line fluxes are corrected for the interstellar
extinction and abundances of elements are calculated.
To calculate y+ we simultaneously and randomly vary ![]() (He+),
(He+),
![]() (He+) and
(He+) and ![]() (
(![]() 3889). The
total number of such realizations is 105 for
each value of
3889). The
total number of such realizations is 105 for
each value of
![]() (H
(H![]() )/I(H
)/I(H![]() ).
Thus, the total number of Monte Carlo realizations is
100
).
Thus, the total number of Monte Carlo realizations is
100 ![]() 105 = 107.
As for the He I underlying stellar absorption, we keep values of
EW(
105 = 107.
As for the He I underlying stellar absorption, we keep values of
EW(![]() 3889), EW(
3889), EW(![]() 4471), EW(
4471), EW(![]() 5876), EW(
5876), EW(![]() 6678) and
EW(
6678) and
EW(![]() 7065) constant during simulations.
In our spectrum, other He I emission lines, namely
He I
7065) constant during simulations.
In our spectrum, other He I emission lines, namely
He I ![]() 3820,
3820, ![]() 4388,
4388, ![]() 4026,
4026, ![]() 4921,
and
4921,
and ![]() 7281 are seen. However, we do not attempt to use these lines for
He abundance determination because they are much weaker than the five
brightest lines, and hence have larger uncertainties.
7281 are seen. However, we do not attempt to use these lines for
He abundance determination because they are much weaker than the five
brightest lines, and hence have larger uncertainties.
We solve the problem by minimization of the expression
The best solution for
![]() is found from the minimum of
is found from the minimum of ![]() ,
the systematic error
,
the systematic error
![]() is obtained from the dispersion
of
is obtained from the dispersion
of
![]() in the range of
in the range of ![]() between
between
![]() and
and
![]() + 1. Then the total error for
+ 1. Then the total error for
![]() is
derived from
is
derived from
![]() =
=
![]() +
+
![]() .
.
Additionally, since the nebular He II ![]() 4686 Å
emission line was detected, we have added the abundance of doubly ionised
helium
4686 Å
emission line was detected, we have added the abundance of doubly ionised
helium
![]() /H+ to y+. Although the He2+ zone
is hotter than the He+ zone, we adopt
/H+ to y+. Although the He2+ zone
is hotter than the He+ zone, we adopt ![]() (He2+) =
(He2+) = ![]() (He+).
This last assumption introduces little change in the y value, because
the value of y2+ is small (
(He+).
This last assumption introduces little change in the y value, because
the value of y2+ is small (![]() 4% of y+).
Finally, the ionisation correction factor ICF(He) is taken into account
from Izotov et al. (2006b) to convert y++y2+ to the total He abundance
4% of y+).
Finally, the ionisation correction factor ICF(He) is taken into account
from Izotov et al. (2006b) to convert y++y2+ to the total He abundance
![]() .
.
The derived parameters and He abundances for each He I emission
line are shown in Table 3. Here,
![]() (H
(H![]() )/I(H
)/I(H![]() )
is the fraction of H
)
is the fraction of H![]() flux due to the collisional excitation. The
electron number density
flux due to the collisional excitation. The
electron number density ![]() in the He+ zone is high, 295 cm-3, and
is consistent with the number density derived from the [S II] emission
lines. The electron temperature
in the He+ zone is high, 295 cm-3, and
is consistent with the number density derived from the [S II] emission
lines. The electron temperature ![]() (O III) in Table 3
slightly differs from that in Table 2 (right column). This is because
in Table 3 collisional excitation of hydrogen lines is taken into
account resulting in smaller C(H
(O III) in Table 3
slightly differs from that in Table 2 (right column). This is because
in Table 3 collisional excitation of hydrogen lines is taken into
account resulting in smaller C(H![]() )
than that in Table
2. The electron temperature
)
than that in Table
2. The electron temperature ![]() (He+) is only slightly lower than
(He+) is only slightly lower than
![]() (O III) suggesting that temperature fluctuations in the H II
region of SBS 0335-052E are small.
The optical depth
(O III) suggesting that temperature fluctuations in the H II
region of SBS 0335-052E are small.
The optical depth ![]() (
(![]() 3889) of 2.9 is high compared to
that in other BCDs (see e.g. Izotov & Thuan 2004) implying an important contribution
of the fluorescent enhancement of He I emission lines.
3889) of 2.9 is high compared to
that in other BCDs (see e.g. Izotov & Thuan 2004) implying an important contribution
of the fluorescent enhancement of He I emission lines.
The derived weighted mean He mass fraction in SBS 0335-052E,
![]() ,
is slightly lower (but consistent within the errors)
than the primordial He mass
fraction
,
is slightly lower (but consistent within the errors)
than the primordial He mass
fraction
![]() (syst.)
from the 3-year data of the WMAP experiment
(Spergel et al. 2006)
and the D abundance, supporting the standard cosmological model of the primordial nucleosynthesis.
(syst.)
from the 3-year data of the WMAP experiment
(Spergel et al. 2006)
and the D abundance, supporting the standard cosmological model of the primordial nucleosynthesis.
Table 3: Helium abundance
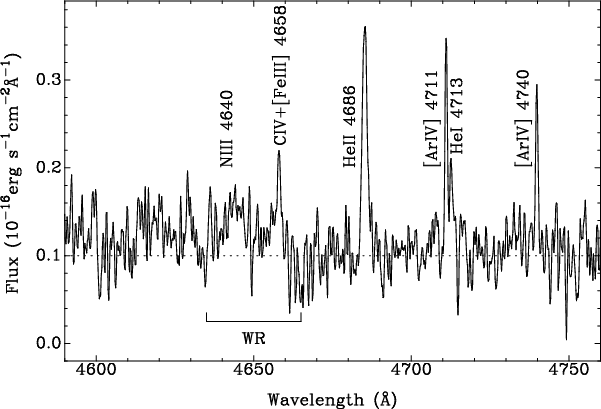 |
Figure 11:
Part of the spectrum of cluster 3 showing the probable broad Wolf-Rayet
emission lines N III |
| Open with DEXTER | |
The search for Wolf-Rayet (WR) stars in extremely low-metallicity dwarf galaxies is of great interest for constraining stellar evolution models. However, such studies are difficult since the strength of WR emission lines is significantly reduced with decreasing metallicity. Therefore, very high signal-to-noise ratio spectra are required to detect weak WR features. For a long time no WR galaxies with an oxygen abundance 12 + log O/H < 7.9 were known (Masegosa et al. 1991). Later, Izotov et al. (1997c) and Legrand et al. (1997) discovered WR stars in I Zw 18, at that time the most metal-deficient emission-line galaxy, with the oxygen abundance 12 + log O/H = 7.17. Thus, it appears that WR stars could be found in any other dwarf emission-line galaxy with active star formation, including SBS 0335-052E. However, the strength of WR emission features depends not only on metallicity but also on the age of a starburst. In starbursts with the metallicity of SBS 0335-052E, the WR stage is expected to be very short, typically less than 1 Myr (Schaerer & Vacca 1998; de Mello et al. 1998). Therefore, not all young clusters ionising the interstellar medium in SBS 0335-052E may be expected to contain WR stars. Recently, Papaderos et al. (2006) found that WR stars of the early carbon sequence (WC4 stars) are present in cluster 3 of SBS 0335-052E.
GIRAFFE/ARGUS observations allow in principle a more detailed search for
WR stars in SBS 0335-052E, a more precise localisation in the galaxy,
and also to resolve the ![]() 4650 WR bump into N III
4650 WR bump into N III ![]() 4640
and C IV
4640
and C IV ![]() 4658 broad features, thus allowing the detection
of both late nitrogen WR stars (WNL stars) and early carbon WR stars
(WCE stars). Previous observations by Papaderos et al. (2006) had too low spectral
resolution to definitely distinguish between two types of WR stars.
However, there are some limitations of GIRAFFE/ARGUS observations
that make such a study more difficult
than that of Papaderos et al. (2006). Although Papaderos et al. (2006) have observed
with the smaller 3.6 m ESO telescope, their spectrum has a higher S/N ratio
because of the
4658 broad features, thus allowing the detection
of both late nitrogen WR stars (WNL stars) and early carbon WR stars
(WCE stars). Previous observations by Papaderos et al. (2006) had too low spectral
resolution to definitely distinguish between two types of WR stars.
However, there are some limitations of GIRAFFE/ARGUS observations
that make such a study more difficult
than that of Papaderos et al. (2006). Although Papaderos et al. (2006) have observed
with the smaller 3.6 m ESO telescope, their spectrum has a higher S/N ratio
because of the ![]() 3 times longer exposure and
3 times longer exposure and ![]() 10 times lower
spectral resolution.
10 times lower
spectral resolution.
We checked all
![]() spectra obtained with GIRAFFE
and found that broad WR features near
spectra obtained with GIRAFFE
and found that broad WR features near ![]() 4650 are likely present
only in one spectrum associated with cluster 3. This spectrum is shown
in Fig. 11. The S/N ratio of
4650 are likely present
only in one spectrum associated with cluster 3. This spectrum is shown
in Fig. 11. The S/N ratio of ![]() 5 of this
spectrum is not high, but broad WR features are clearly seen.
Thus, we confirm the finding by Papaderos et al. (2006) that
WR stars appear to be present in cluster 3. However, we find that
the WR feature consists in fact of two lines: N III
5 of this
spectrum is not high, but broad WR features are clearly seen.
Thus, we confirm the finding by Papaderos et al. (2006) that
WR stars appear to be present in cluster 3. However, we find that
the WR feature consists in fact of two lines: N III ![]() 4640 and
C IV
4640 and
C IV ![]() 4658. The latter line is blended with the much
narrower nebular [Fe III]
4658. The latter line is blended with the much
narrower nebular [Fe III] ![]() 4658 emission line.
We find that, after subtraction of the [Fe III] line from the
4658 emission line.
We find that, after subtraction of the [Fe III] line from the ![]() 4658
blend, the fluxes of the N III
4658
blend, the fluxes of the N III ![]() 4640 and C IV
4640 and C IV ![]() 4658
lines and their FWHMs are similar,
4658
lines and their FWHMs are similar,
![]() (
(
![]() erg s-1 cm-2
and 6.5 Å, respectively.
Thus, the total flux of the
erg s-1 cm-2
and 6.5 Å, respectively.
Thus, the total flux of the ![]() 4650 bump (N III
4650 bump (N III ![]() 4640 +
C IV
4640 +
C IV ![]() 4658) non-corrected for extinction
is
4658) non-corrected for extinction
is ![]()
![]() erg s-1 cm-2, or 2/3 that measured
by Papaderos et al. (2006) in a larger aperture. The total equivalent width of this
bump is EW(
erg s-1 cm-2, or 2/3 that measured
by Papaderos et al. (2006) in a larger aperture. The total equivalent width of this
bump is EW(![]() 4650)
4650) ![]() 9 Å. The
C IV
9 Å. The
C IV ![]() 4658 emission line should be accompanied by
the C IV
4658 emission line should be accompanied by
the C IV ![]() 5808 emission line with a comparable flux.
Unfortunately, the redshifted C IV
5808 emission line with a comparable flux.
Unfortunately, the redshifted C IV ![]() 5808 emission line
in SBS 0335-052E coincides with the night sky Na I
5808 emission line
in SBS 0335-052E coincides with the night sky Na I
![]() 5890, 5895 emission lines. Therefore, the imperfect night sky
subtraction hinders the detection of the WR line.
5890, 5895 emission lines. Therefore, the imperfect night sky
subtraction hinders the detection of the WR line.
The observed (i.e. not extinction corrected)
N III ![]() 4640 and C IV
4640 and C IV ![]() 4658
emission line luminosities of cluster 3 are
equal to L(N III
4658
emission line luminosities of cluster 3 are
equal to L(N III ![]() 4640) = L(C IV
4640) = L(C IV ![]() 4658) =
4658) =
![]() erg s-1 and correspond to the number of WNL and
stars N(WNL)
erg s-1 and correspond to the number of WNL and
stars N(WNL) ![]()
![]() and to the number of WC4 stars
N(WC4)
and to the number of WC4 stars
N(WC4) ![]()
![]() if we adopt the "standard'' WR line luminosities computed by Schaerer & Vacca (1998),
i.e. assuming N III
if we adopt the "standard'' WR line luminosities computed by Schaerer & Vacca (1998),
i.e. assuming N III ![]() 4640 and C IV
4640 and C IV ![]() 4658 emission line
luminosities of
4658 emission line
luminosities of
![]() erg s-1
and
erg s-1
and
![]() erg s-1 respectively for a single WNL and WC4 star.
The derived values of WNL and WC4 stars are not reliable
for various reasons. First these are likely
lower limits because of the neglected reddening, and because
WR stars at low metallicity
may have lower intrinsic line luminosities (e.g. Crowther & Hadfield 2006).
Second, it is not necessarily clear that the observed lines are indeed due to
WN and WC stars, as their strengths and widths are somewhat unusual.
Their relatively narrow widths could be due to lower mass loss rates
and/or smaller wind velocities in WR stars at such low metallicity
(Crowther et al. 2002; Crowther & Hadfield 2006; Vink & de Koter 2005).
Alternatively, from their relative strength and the narrow widths,
the observed lines could also correspond to very late WNL stars
(WN 10h-11h) (cf. Crowther & Smith 1997), if most of the C IV
erg s-1 respectively for a single WNL and WC4 star.
The derived values of WNL and WC4 stars are not reliable
for various reasons. First these are likely
lower limits because of the neglected reddening, and because
WR stars at low metallicity
may have lower intrinsic line luminosities (e.g. Crowther & Hadfield 2006).
Second, it is not necessarily clear that the observed lines are indeed due to
WN and WC stars, as their strengths and widths are somewhat unusual.
Their relatively narrow widths could be due to lower mass loss rates
and/or smaller wind velocities in WR stars at such low metallicity
(Crowther et al. 2002; Crowther & Hadfield 2006; Vink & de Koter 2005).
Alternatively, from their relative strength and the narrow widths,
the observed lines could also correspond to very late WNL stars
(WN 10h-11h) (cf. Crowther & Smith 1997), if most of the C IV ![]() 4658
was nebular.
Given the faintness of these spectral signatures and the lack of known individual WR stars
at such low metallicities as comparison objects, it is difficult to draw
firm conclusions on the WR content in this cluster.
4658
was nebular.
Given the faintness of these spectral signatures and the lack of known individual WR stars
at such low metallicities as comparison objects, it is difficult to draw
firm conclusions on the WR content in this cluster.
In this paper we present panoramic spectroscopic observations with
the VLT/GIRAFFE in the spectral range ![]() 3620-9400 Å of one of the
most metal-deficient blue compact dwarf (BCD)
galaxies, SBS 0335-052E. Our findings can be summarized as follows:
3620-9400 Å of one of the
most metal-deficient blue compact dwarf (BCD)
galaxies, SBS 0335-052E. Our findings can be summarized as follows:
Acknowledgements
Y.I.I. and N.G.G. thank the Observatoire de Genève for hospitality. D.S. thanks Paul Crowther for useful comments on WR stars and the Swiss National Science Foundation for support.
Table 4: Emission line fluxes and equivalent widths in the spectrum of the brightest region.
Table 5: Emission line fluxes and equivalent widths in the integrated spectrum of the H II region.