 |
Figure 1: Archival HST/ACS UV image of SBS 0335-052E with thelabelled compact clusters. North is up and East is to the left. |
| Open with DEXTER | |
In the text
 |
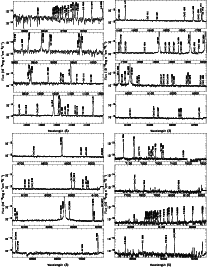
Figure 2: Spectrum of the brightest part of SBS 0335-052E shown in Fig. 7a as a rectangular region delineated by the thick solid line. |
| Open with DEXTER | |
In the text
 |
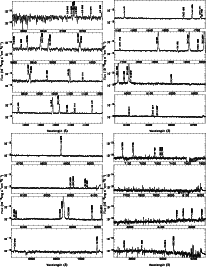
Figure 3: Spectrum of a region centered on clusters 4 and 5 and shown in Fig. 7a as a square region delineated by a thick dashed line. |
| Open with DEXTER | |
In the text
 |
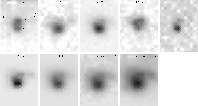
Figure 4:
Images in the continuum near H |
| Open with DEXTER | |
In the text
 |
Figure 5:
Distribution of the H |
| Open with DEXTER | |
In the text
 |
Figure 6:
He II |
| Open with DEXTER | |
In the text
 |
Figure 7:
Profiles of the emission lines: a) H |
| Open with DEXTER | |
In the text
 |
Figure 8:
Schematic H |
| Open with DEXTER | |
In the text
 |
Figure 9:
Macroscopic/turbulent velocity dispersion at the FWHM (in km s-1) derived
from the a) H |
| Open with DEXTER | |
In the text
 |
Figure 10:
a) Electron temperature distribution (in 104 K) from the
[O III] |
| Open with DEXTER | |
In the text
 |
Figure 11:
Part of the spectrum of cluster 3 showing the probable broad Wolf-Rayet
emission lines N III |
| Open with DEXTER | |
In the text